

Analysis

February 2, 2022
CPIP Data: Construction Spending Up Slightly in December
Written by David Schollaert
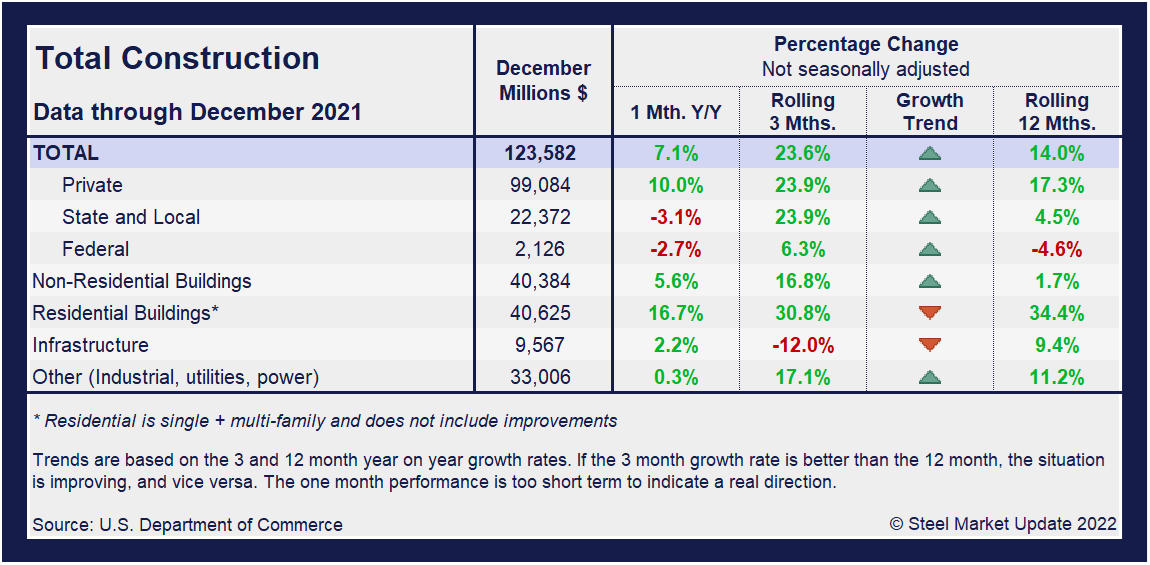
U.S. construction spending edged up in December, though monthly outlays were down in nearly a dozen nonresidential subcategories. Construction spending rose 0.2% above the upward revised November figure and 9.0% above the same year-ago period, the Commerce Department reported.
The Census Bureau’s report on construction shows spending on private construction projects rose 0.7% in December. Outlays on residential construction were up 1.1%, driven by a 2.1% increase in single-family homebuilding spending, while outlays on multi-family housing projects edged up 0.4%.
Year over year, construction spending increased 9% in December. For the whole year of 2021, spending on construction projects rose 8.2% to $1.589 trillion, from $1.469 trillion spent in 2020.
Since the economy reopened from the initial pandemic-driven lockdown in June 2020, the homebuilding market has been on a firm footing. Despite rising labor and raw material costs, demand for single-family houses has been on the rise.
Although the pace of growth somewhat slowed down in December after a 0.6% rise in spending in November, it was an overall great year for the construction sector. Spending gained momentum as the economy continued to grow.
Spending on public construction projects fell 1.6% in December. Outlays on state and local government construction projects dropped 1.3%, while federal government spending fell 5.4%. For the year, the value of public construction in 2021 was $346.2 billion, 4.2% below the $361.2 billion spent in 2020.
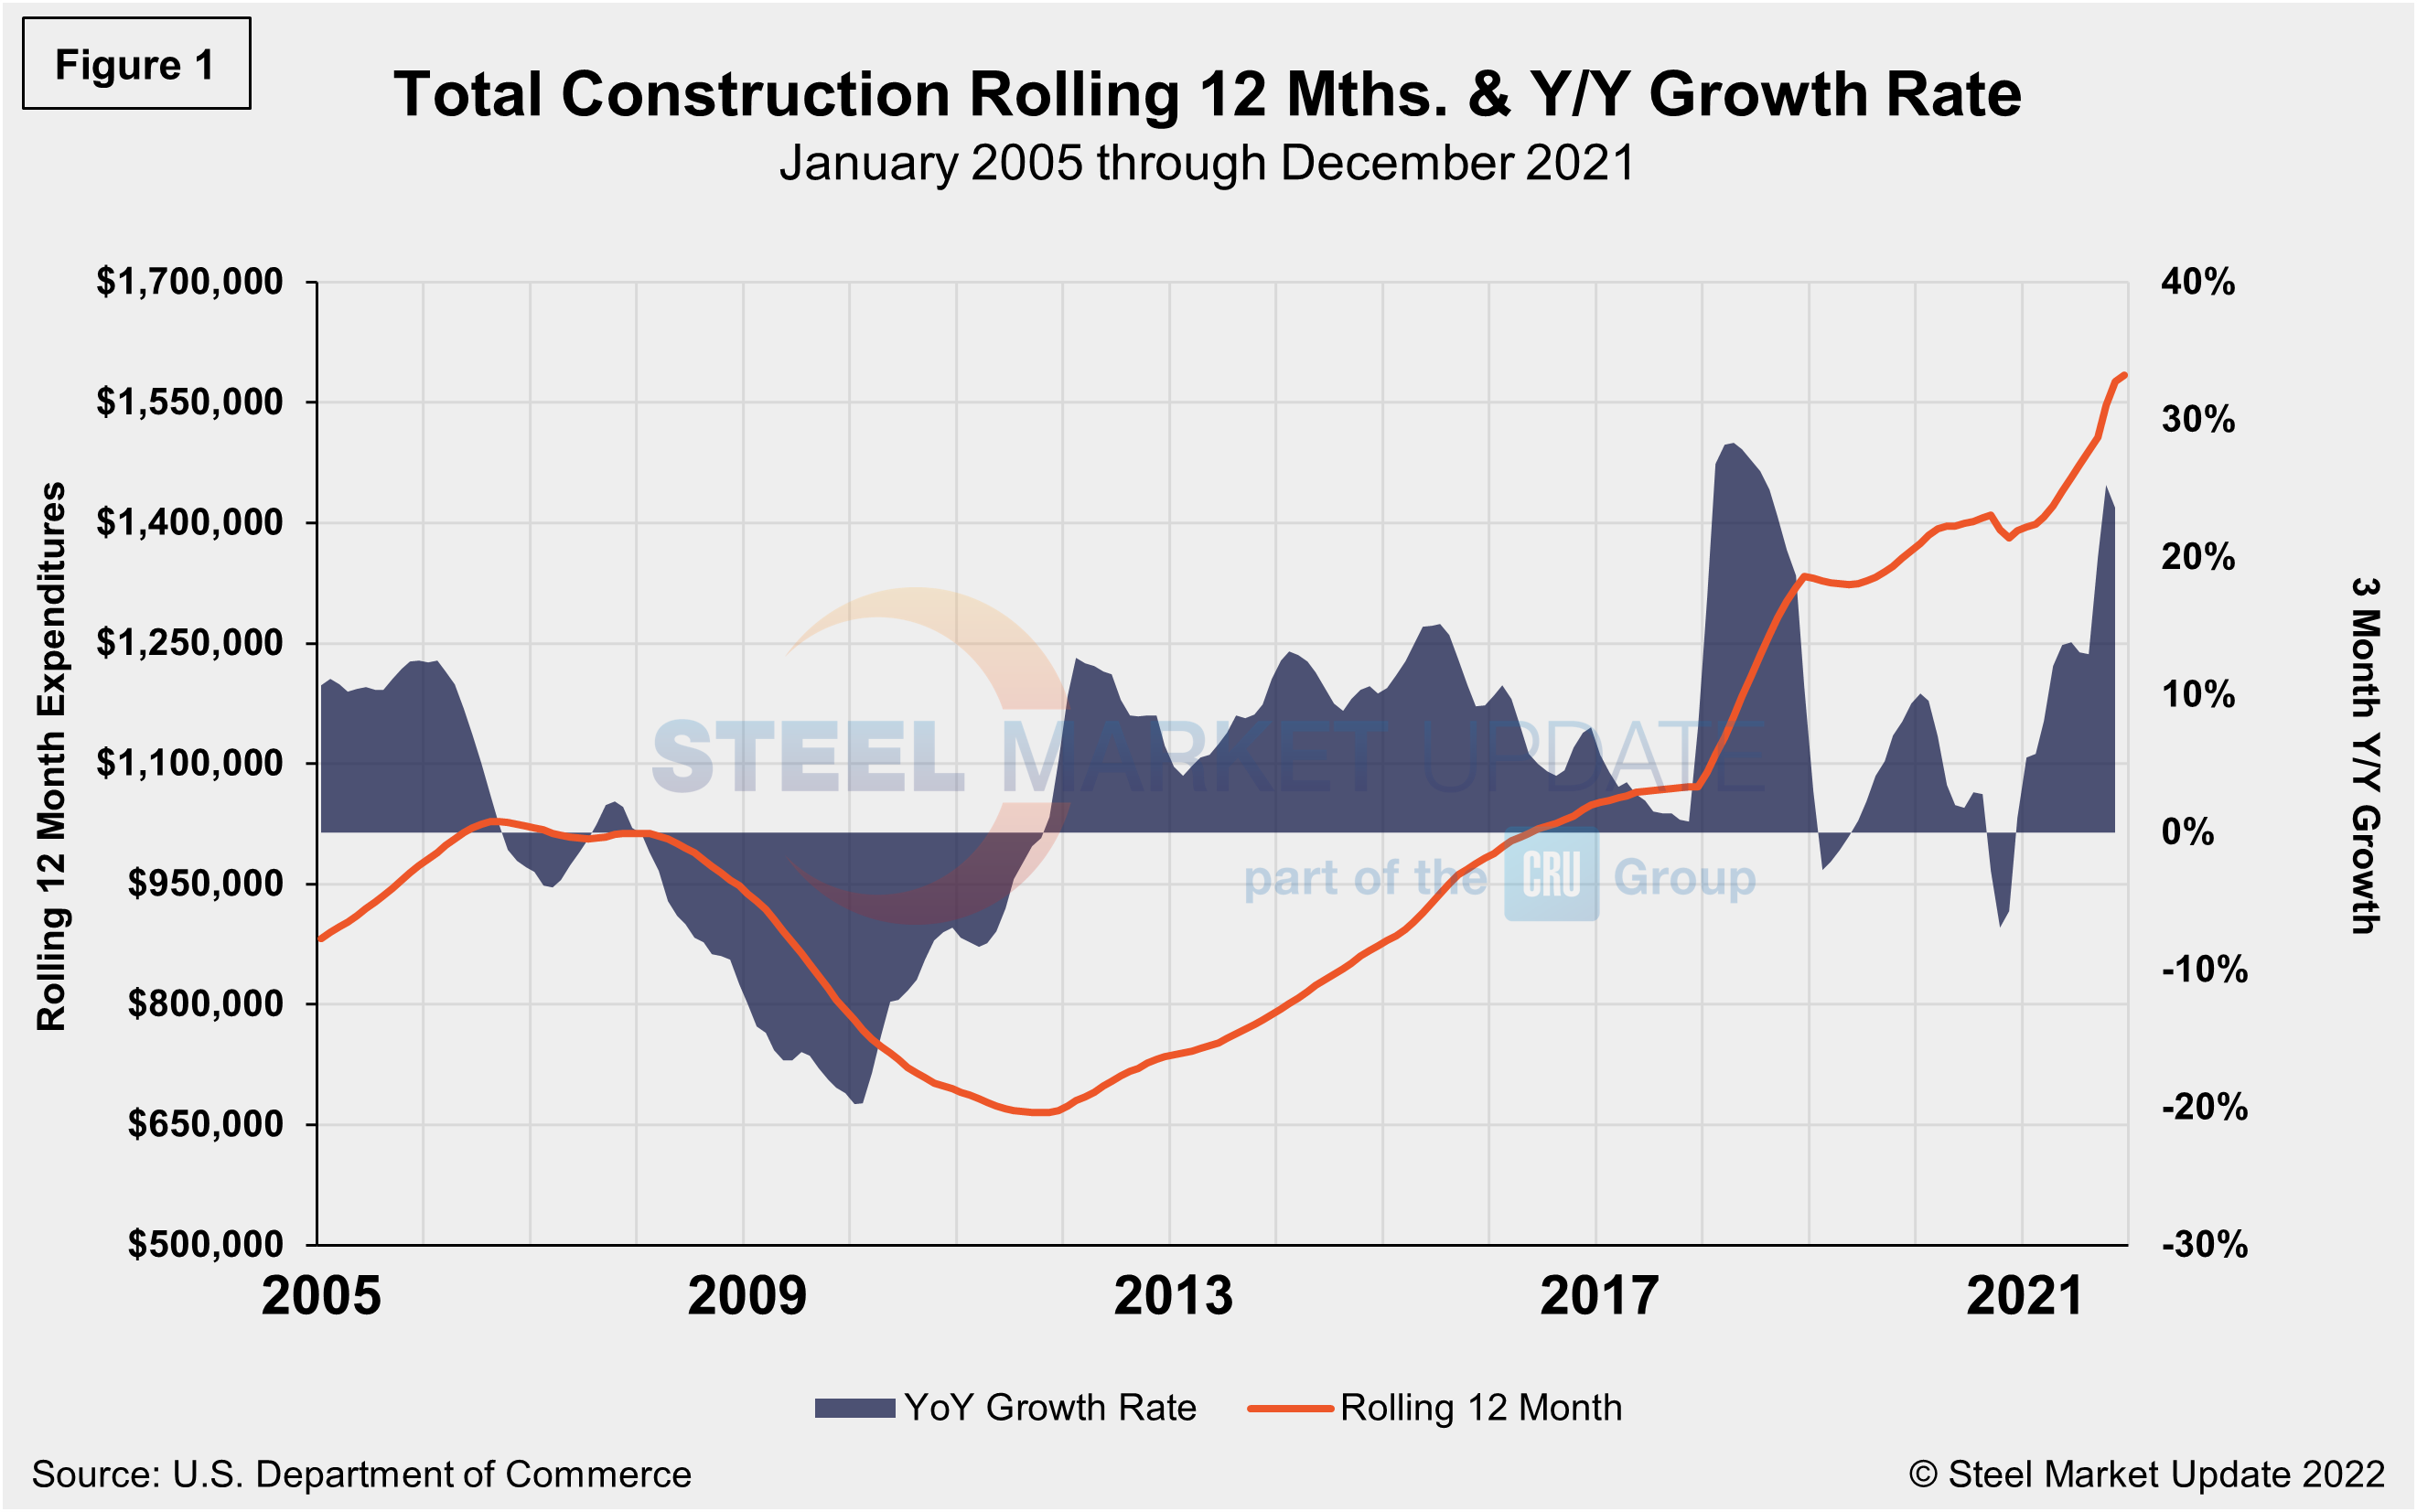
Construction put in place in the private sector was at a seasonally adjusted $1.640 trillion in December, up from the revied $1.637 trillion the prior month, a 0.2% increase. Publicly funded construction spending in December rose 1.6% to an annual rate of $347 billion, rising for the third straight month. Total construction expenditures and its major categories are shown in the table and chart (Figure 1) below.
Private Construction
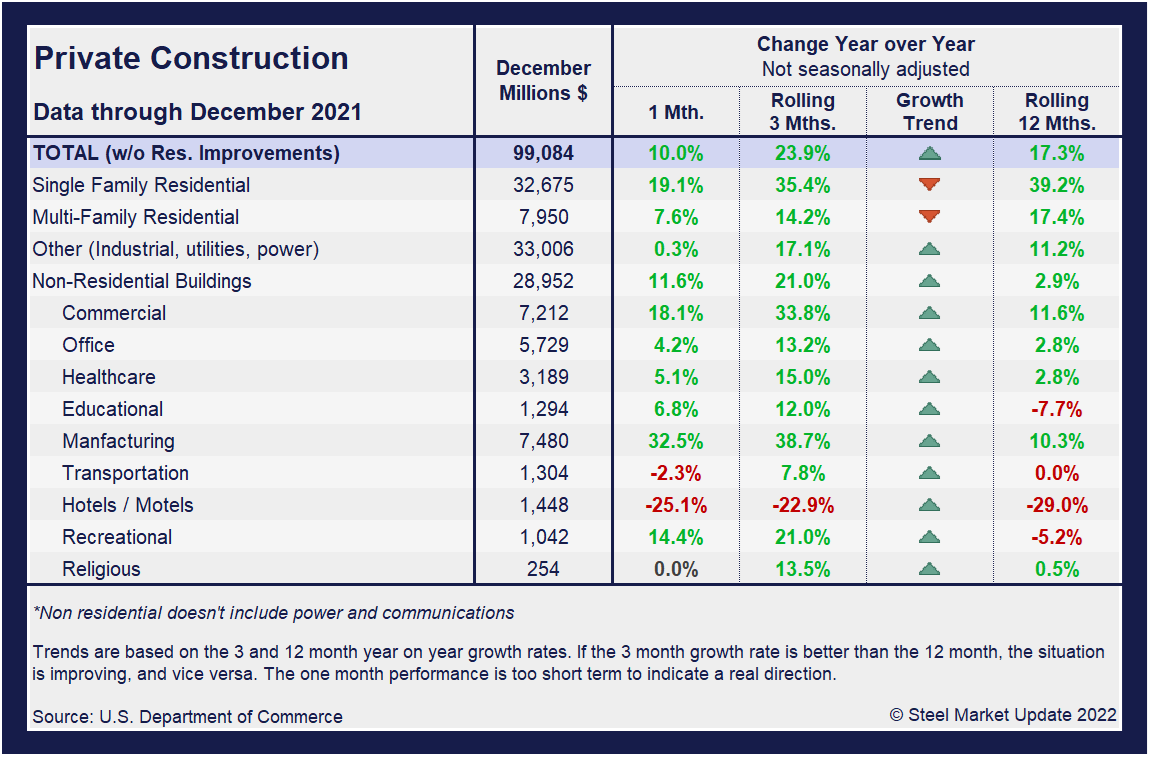
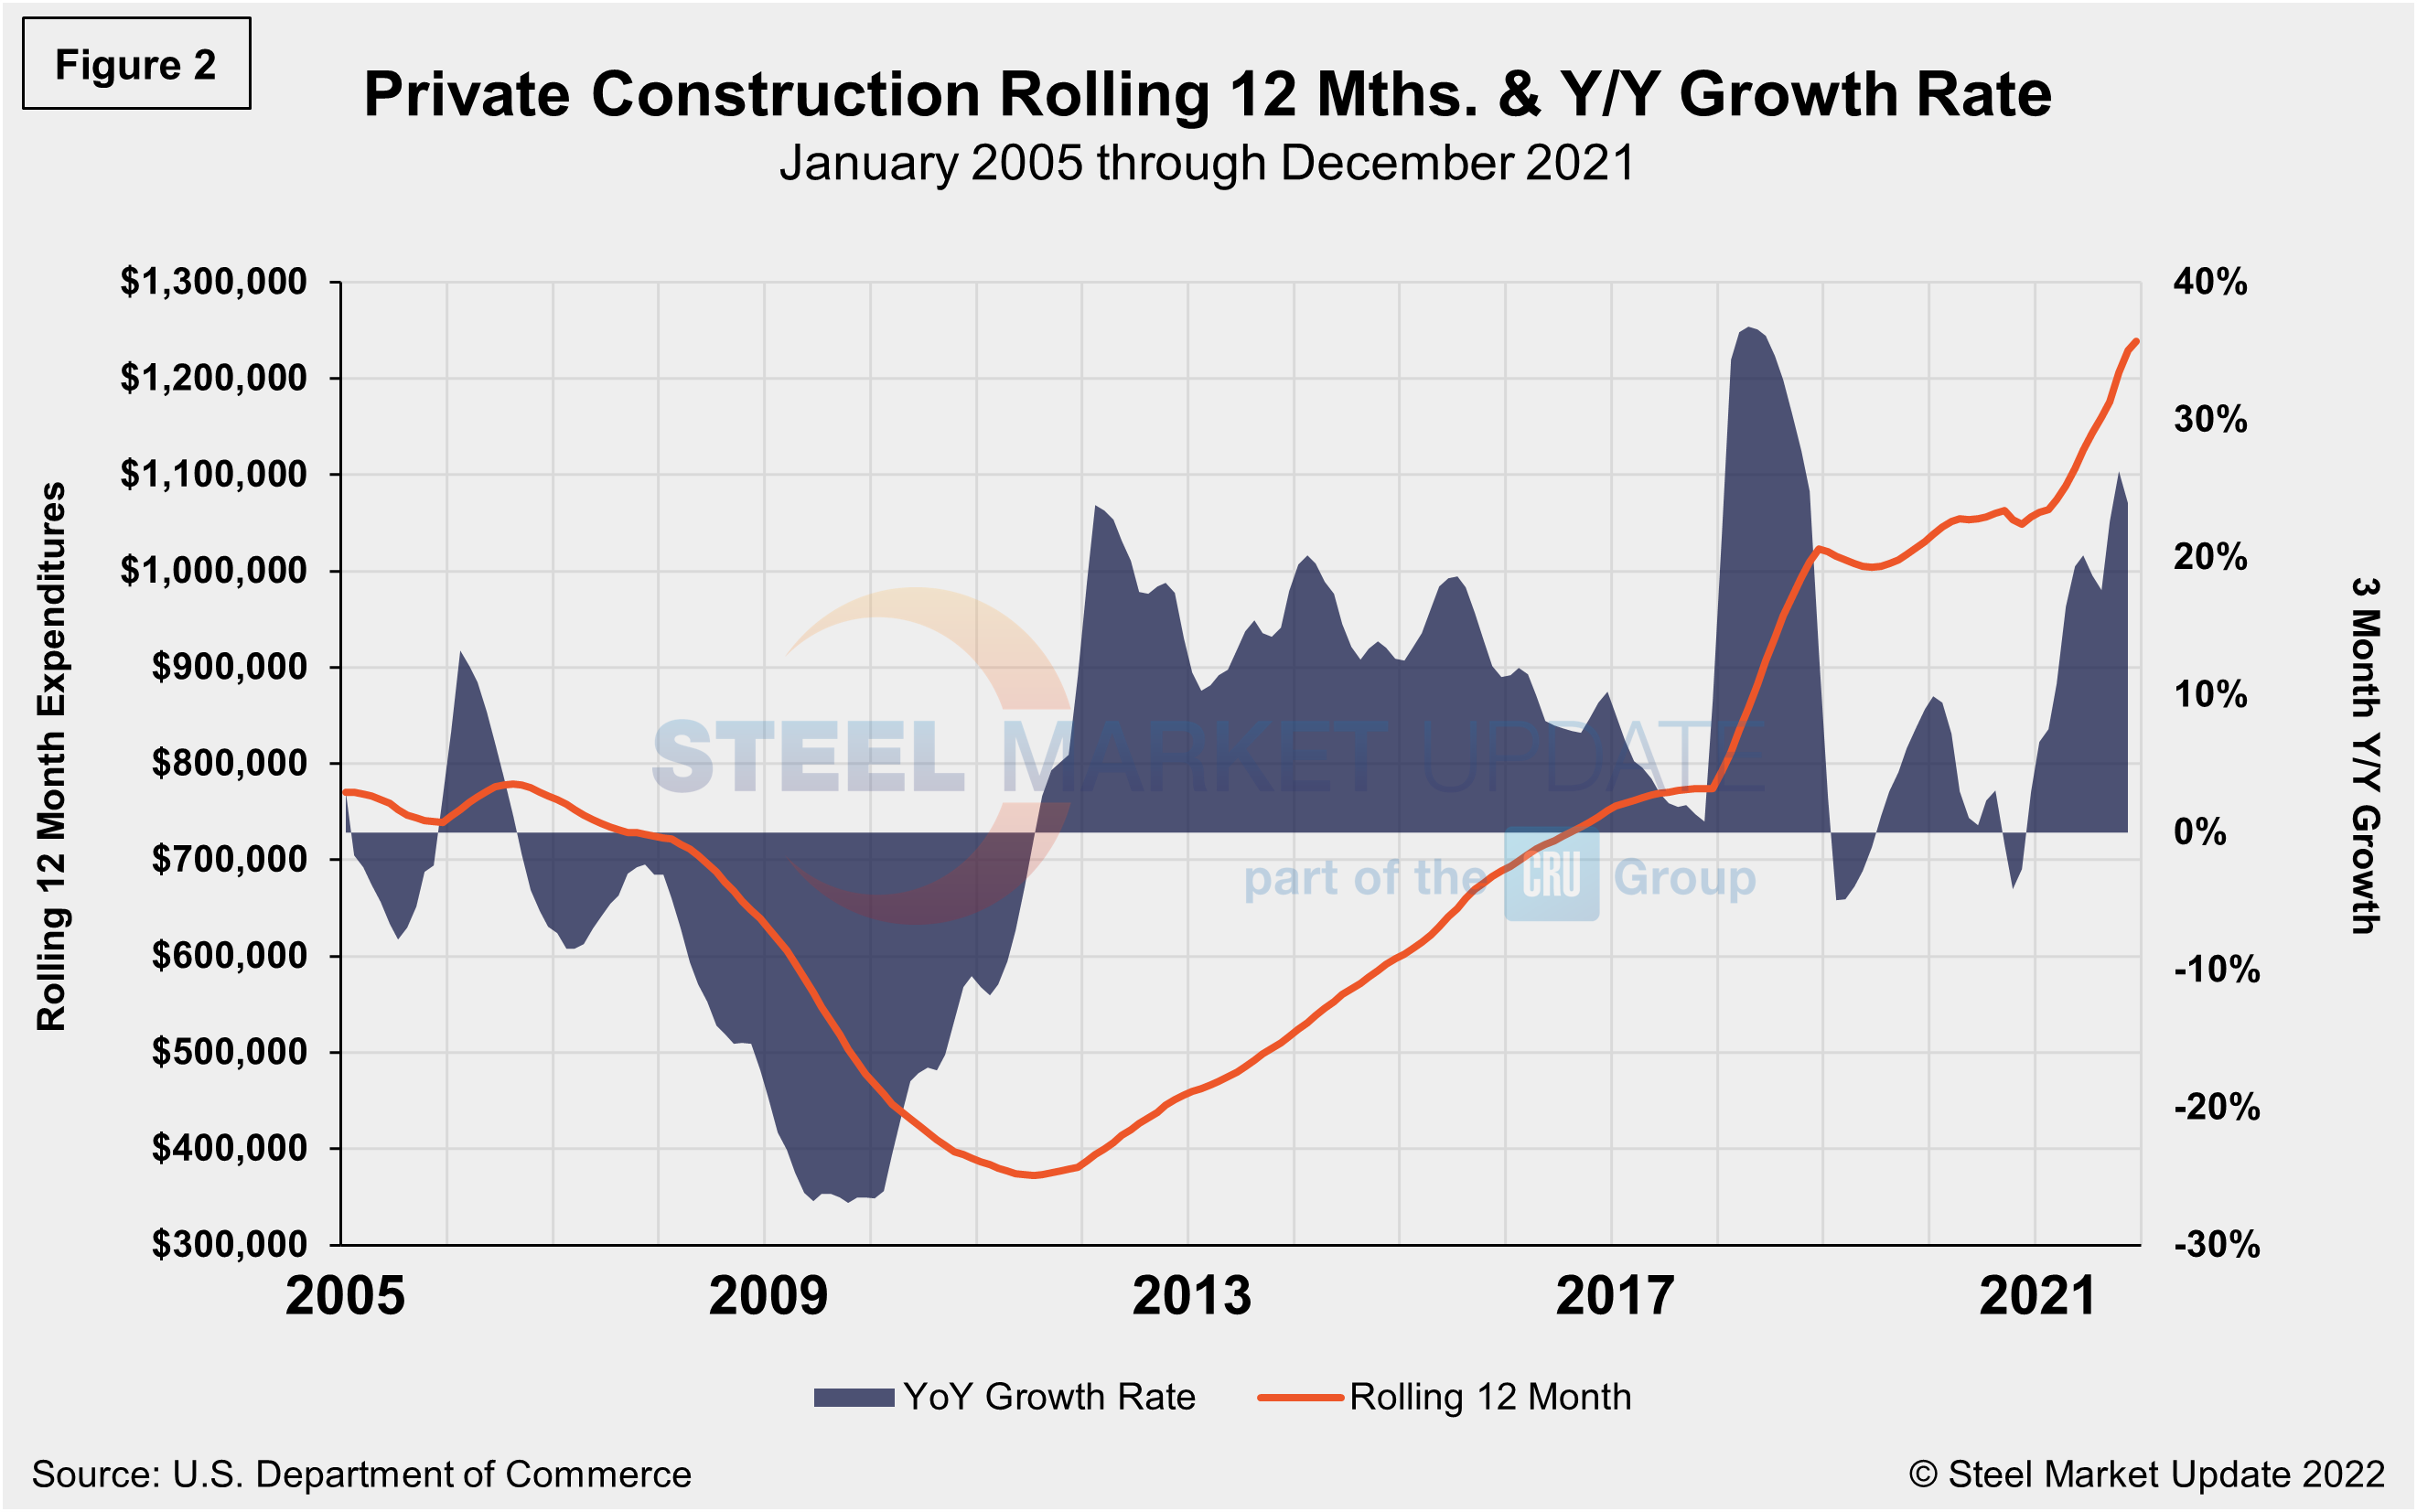
The breakdown of private expenditures into residential and nonresidential and their subsectors are highlighted in the table below. Private construction spending increased 17.3% year over year to an annual rate of $1.293 trillion. Within that category, private single-family residential construction spending rose 39.2% annually, while private nonresidential expanded by just 2.9% compared the same period.
Both residential and nonresidential private construction contracted in December. Spending on new single- and multifamily residential projects, along with additions and renovations to existing houses, slipped 11.3% for the month, but were up 16.7% from a year earlier. Weighed down by declines in home improvements and single-family homebuilding, residential investment contracted for a third consecutive quarter, down from Q2 to Q4.
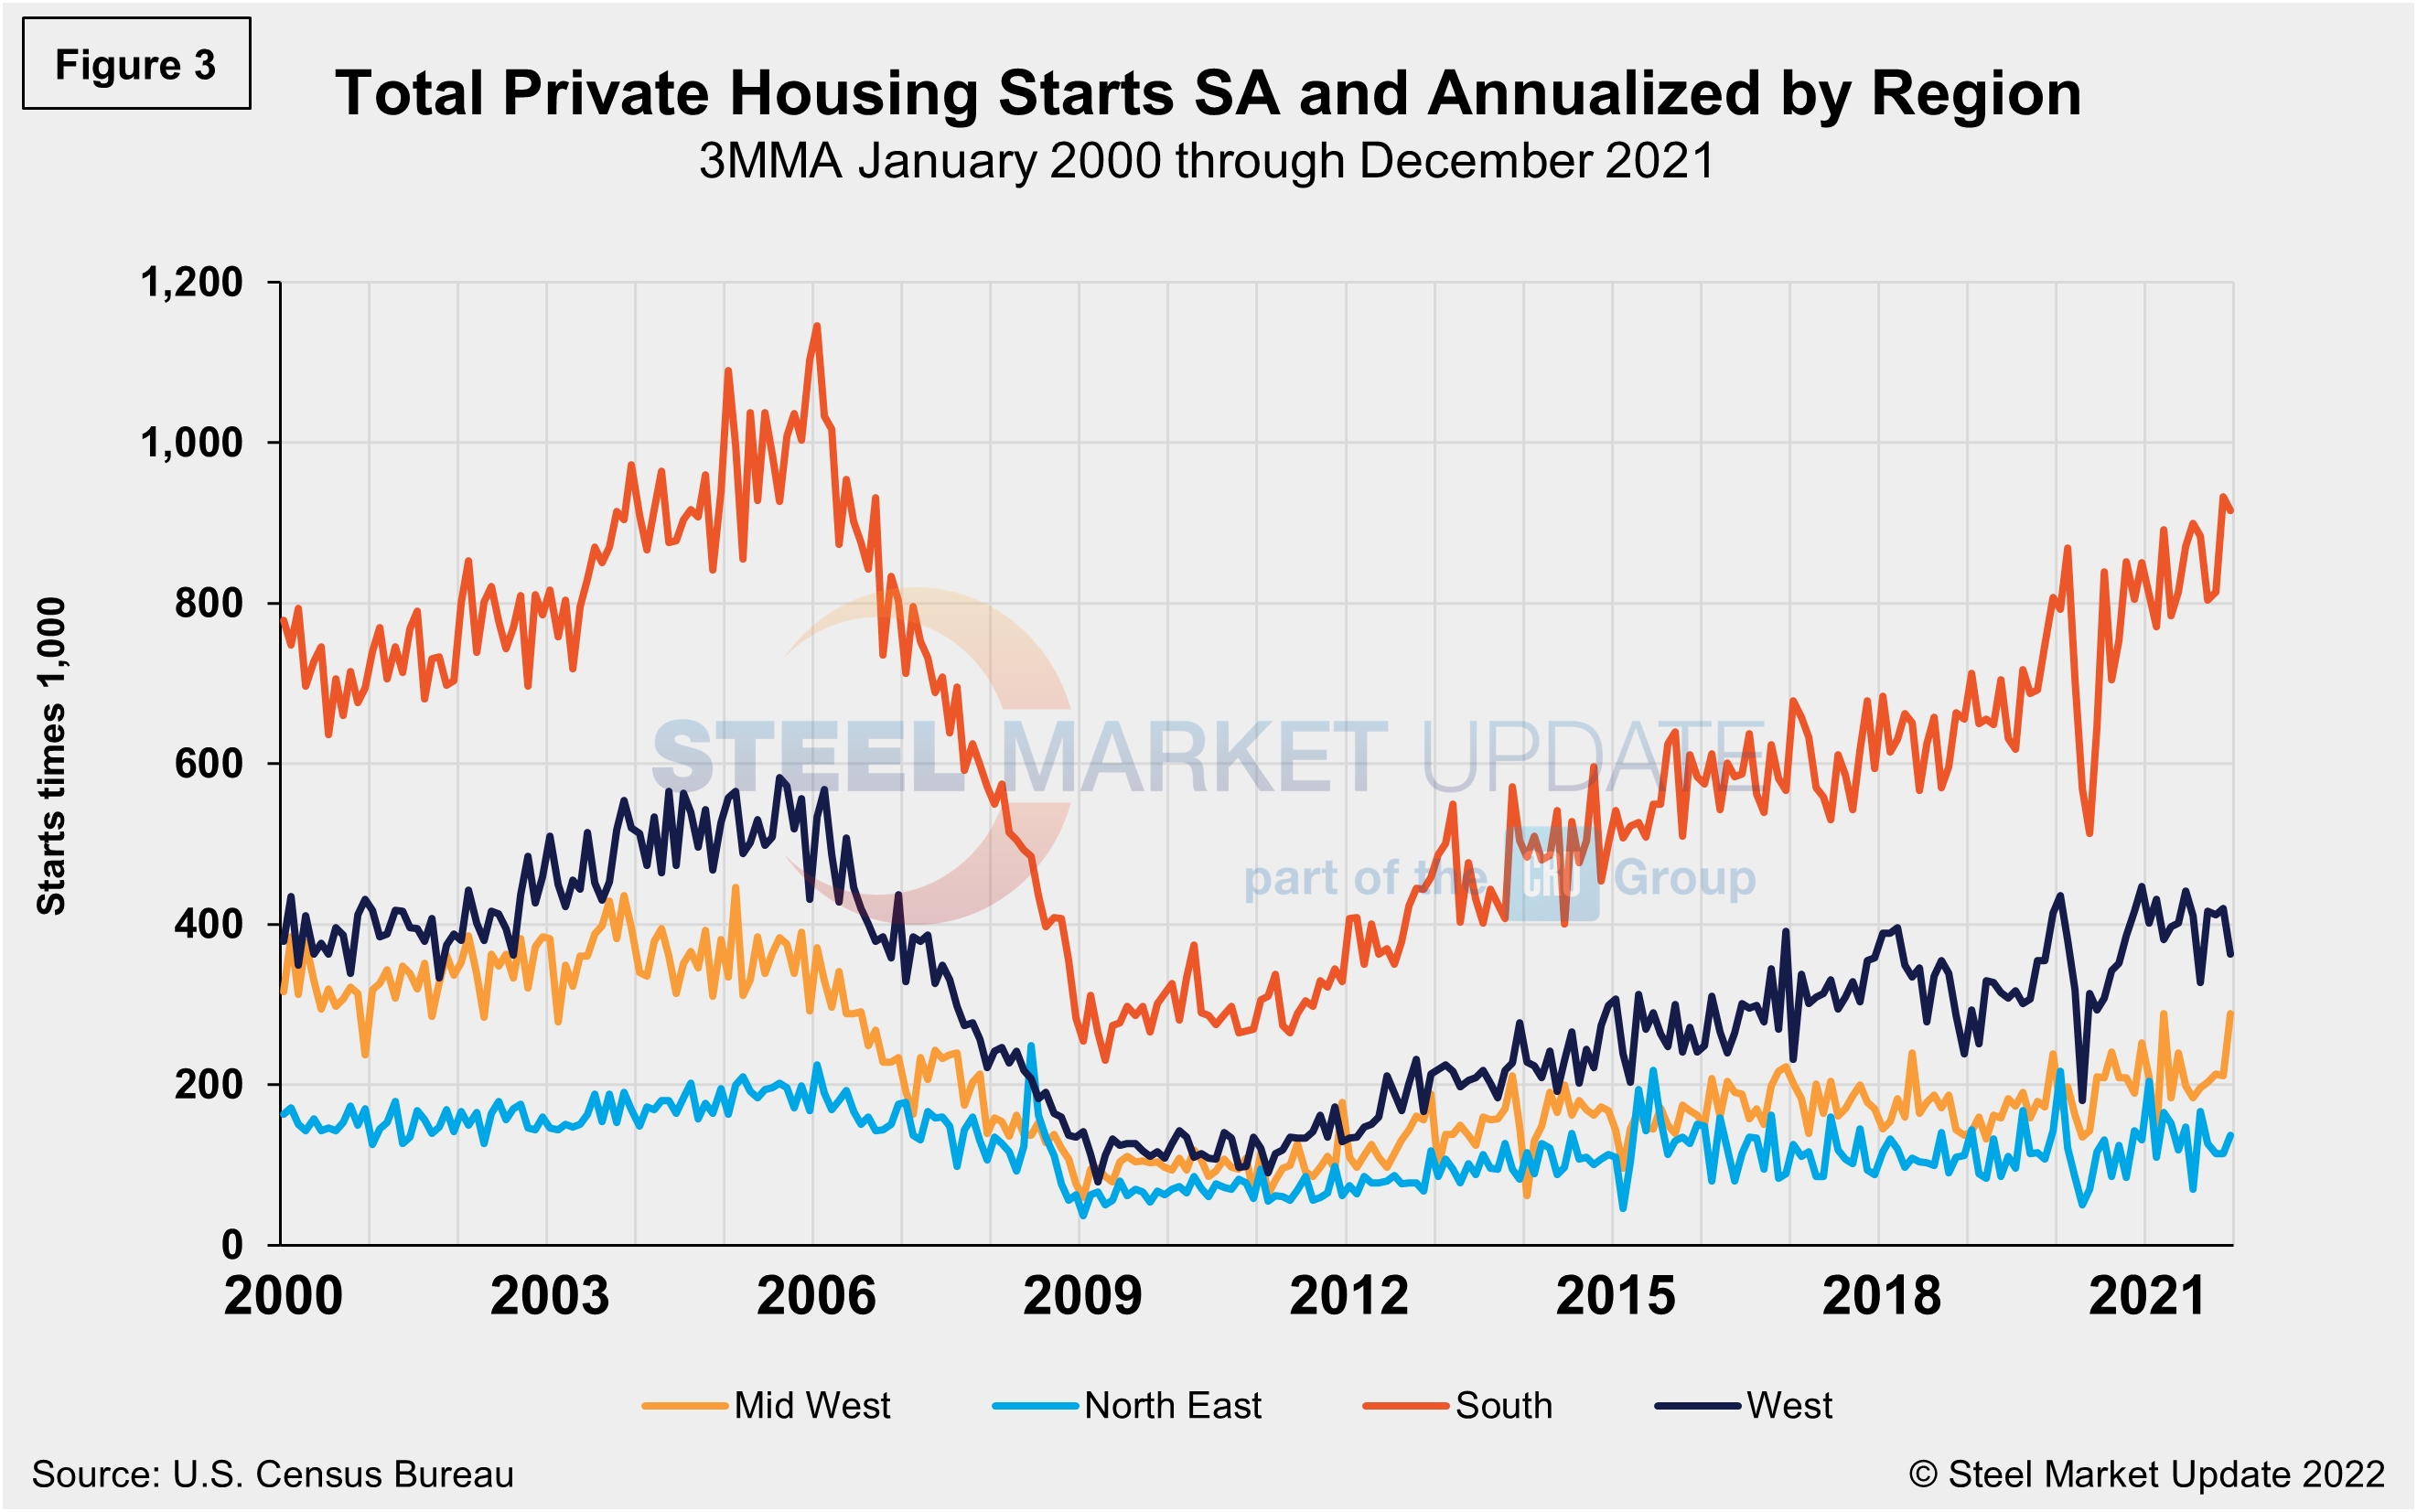
Total housing starts in the four regions are displayed below (Figure 3). Privately‐owned housing starts in December were at a seasonally adjusted annual rate of 1.873 million, up 9.1% from the revised November estimate of 1.717 million. The gain was driven by a single-family uptick at a rate of 1.128 million, up 2.0% from November’s revised figure of 1.106 million. Both single-family and multifamily properties saw a pickup in December despite labor and material shortages.
The South region continues to be the strongest for housing starts at 915,000 in December, besting the West—the second-place region—by more than double. The Northeast continued to trail the other three regions with just 137,000 starts in December, but a 20.2% gain month on month. All four regions were directly impacted by the widespread COVID-19 shutdowns last year, causing housing starts to fall sharply. Since then, they have recovered to pre-pandemic levels, but have been widely inconsistent due to supply-side limitations and rising material costs. Outside of the North East’s expansion, the other three regions all saw declines in December when compared the prior month.
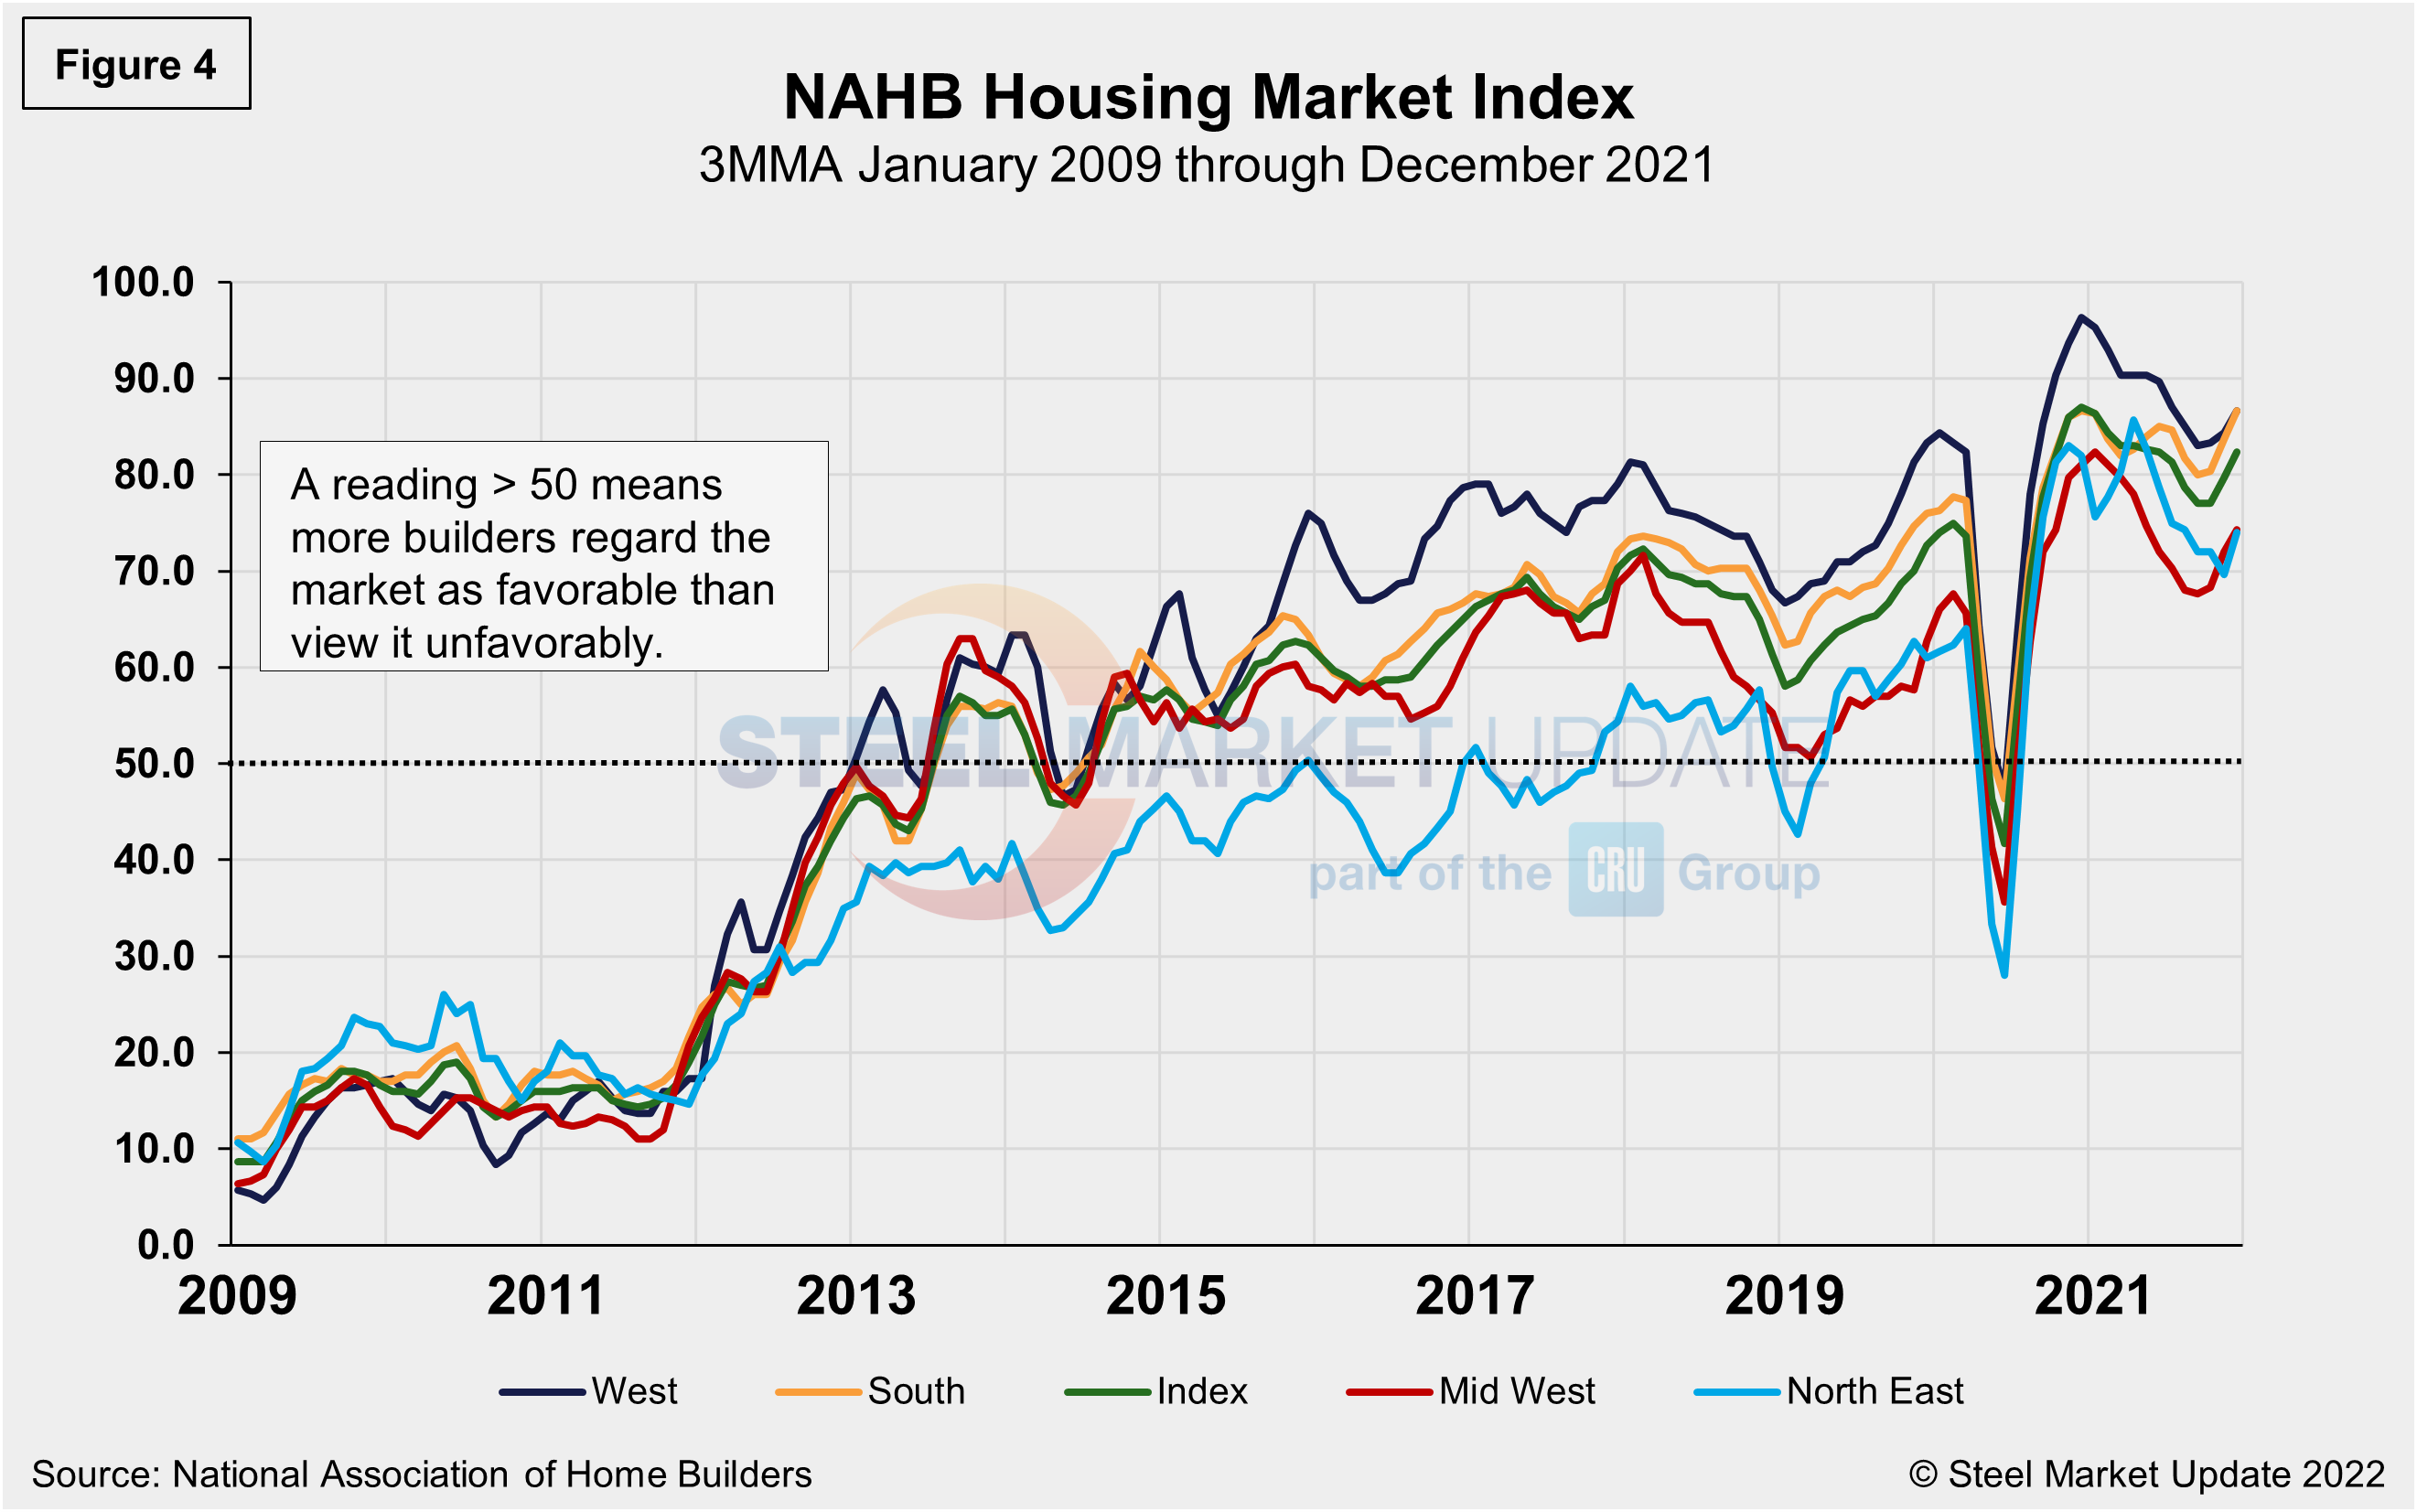
The National Association of Home Builders Optimism Index nearly crashed in April 2020 at the onset of COVID-19, but recovered well through December last year. Since the beginning of 2021, optimism among home builders has been tempered by the high costs of lumber and other building materials and the shortage of skilled labor. The index registered 84 in December, up slightly from 83 the month prior, and rising for the fourth straight month. Advance reports indicate that the index may slip in January, however (Figure 4).
State and Local Construction
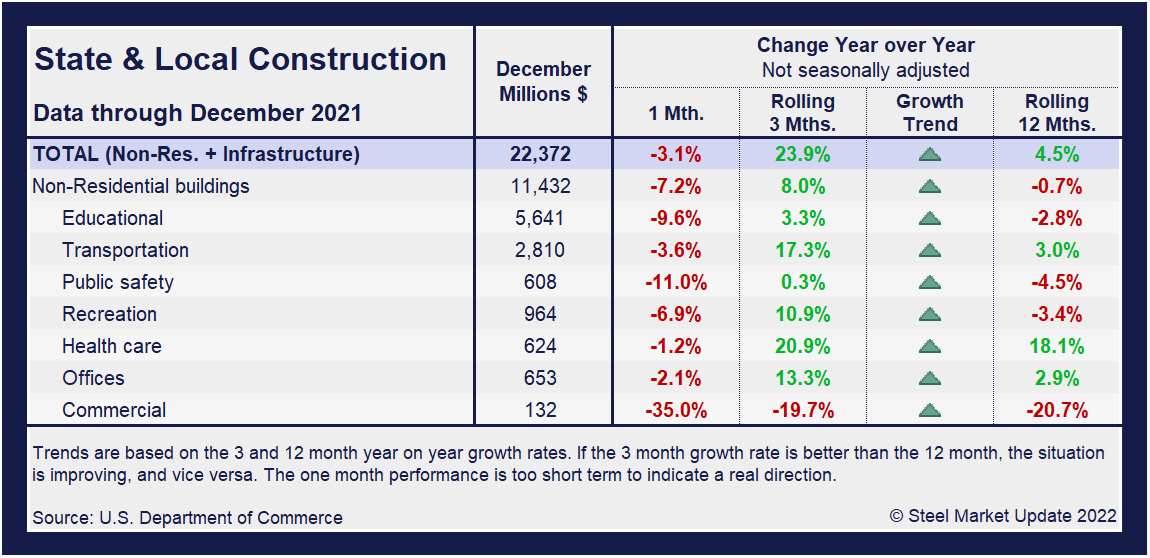
Spending on public construction projects slipped 1.6% in December to $347 billion after rising 0.2% in November. Educational construction was at a seasonally adjusted annual rate of $81 billion, 1.4% below the revised November estimate of $82.2 billion. Highway construction was at a seasonally adjusted annual rate of $103.5 billion, 0.1% above the revised November estimate of $103.4 billion.
The value of public construction in 2021 was $346.2 billion, 4.2% below the $361.2 billion spent in 2020. Educational construction in 2021 was $82.4 billion, 7.6% below the 2020 figure of $89.1 billion, while highway construction was $99.7 billion, 0.2% above the $99.5 billion in 2020.
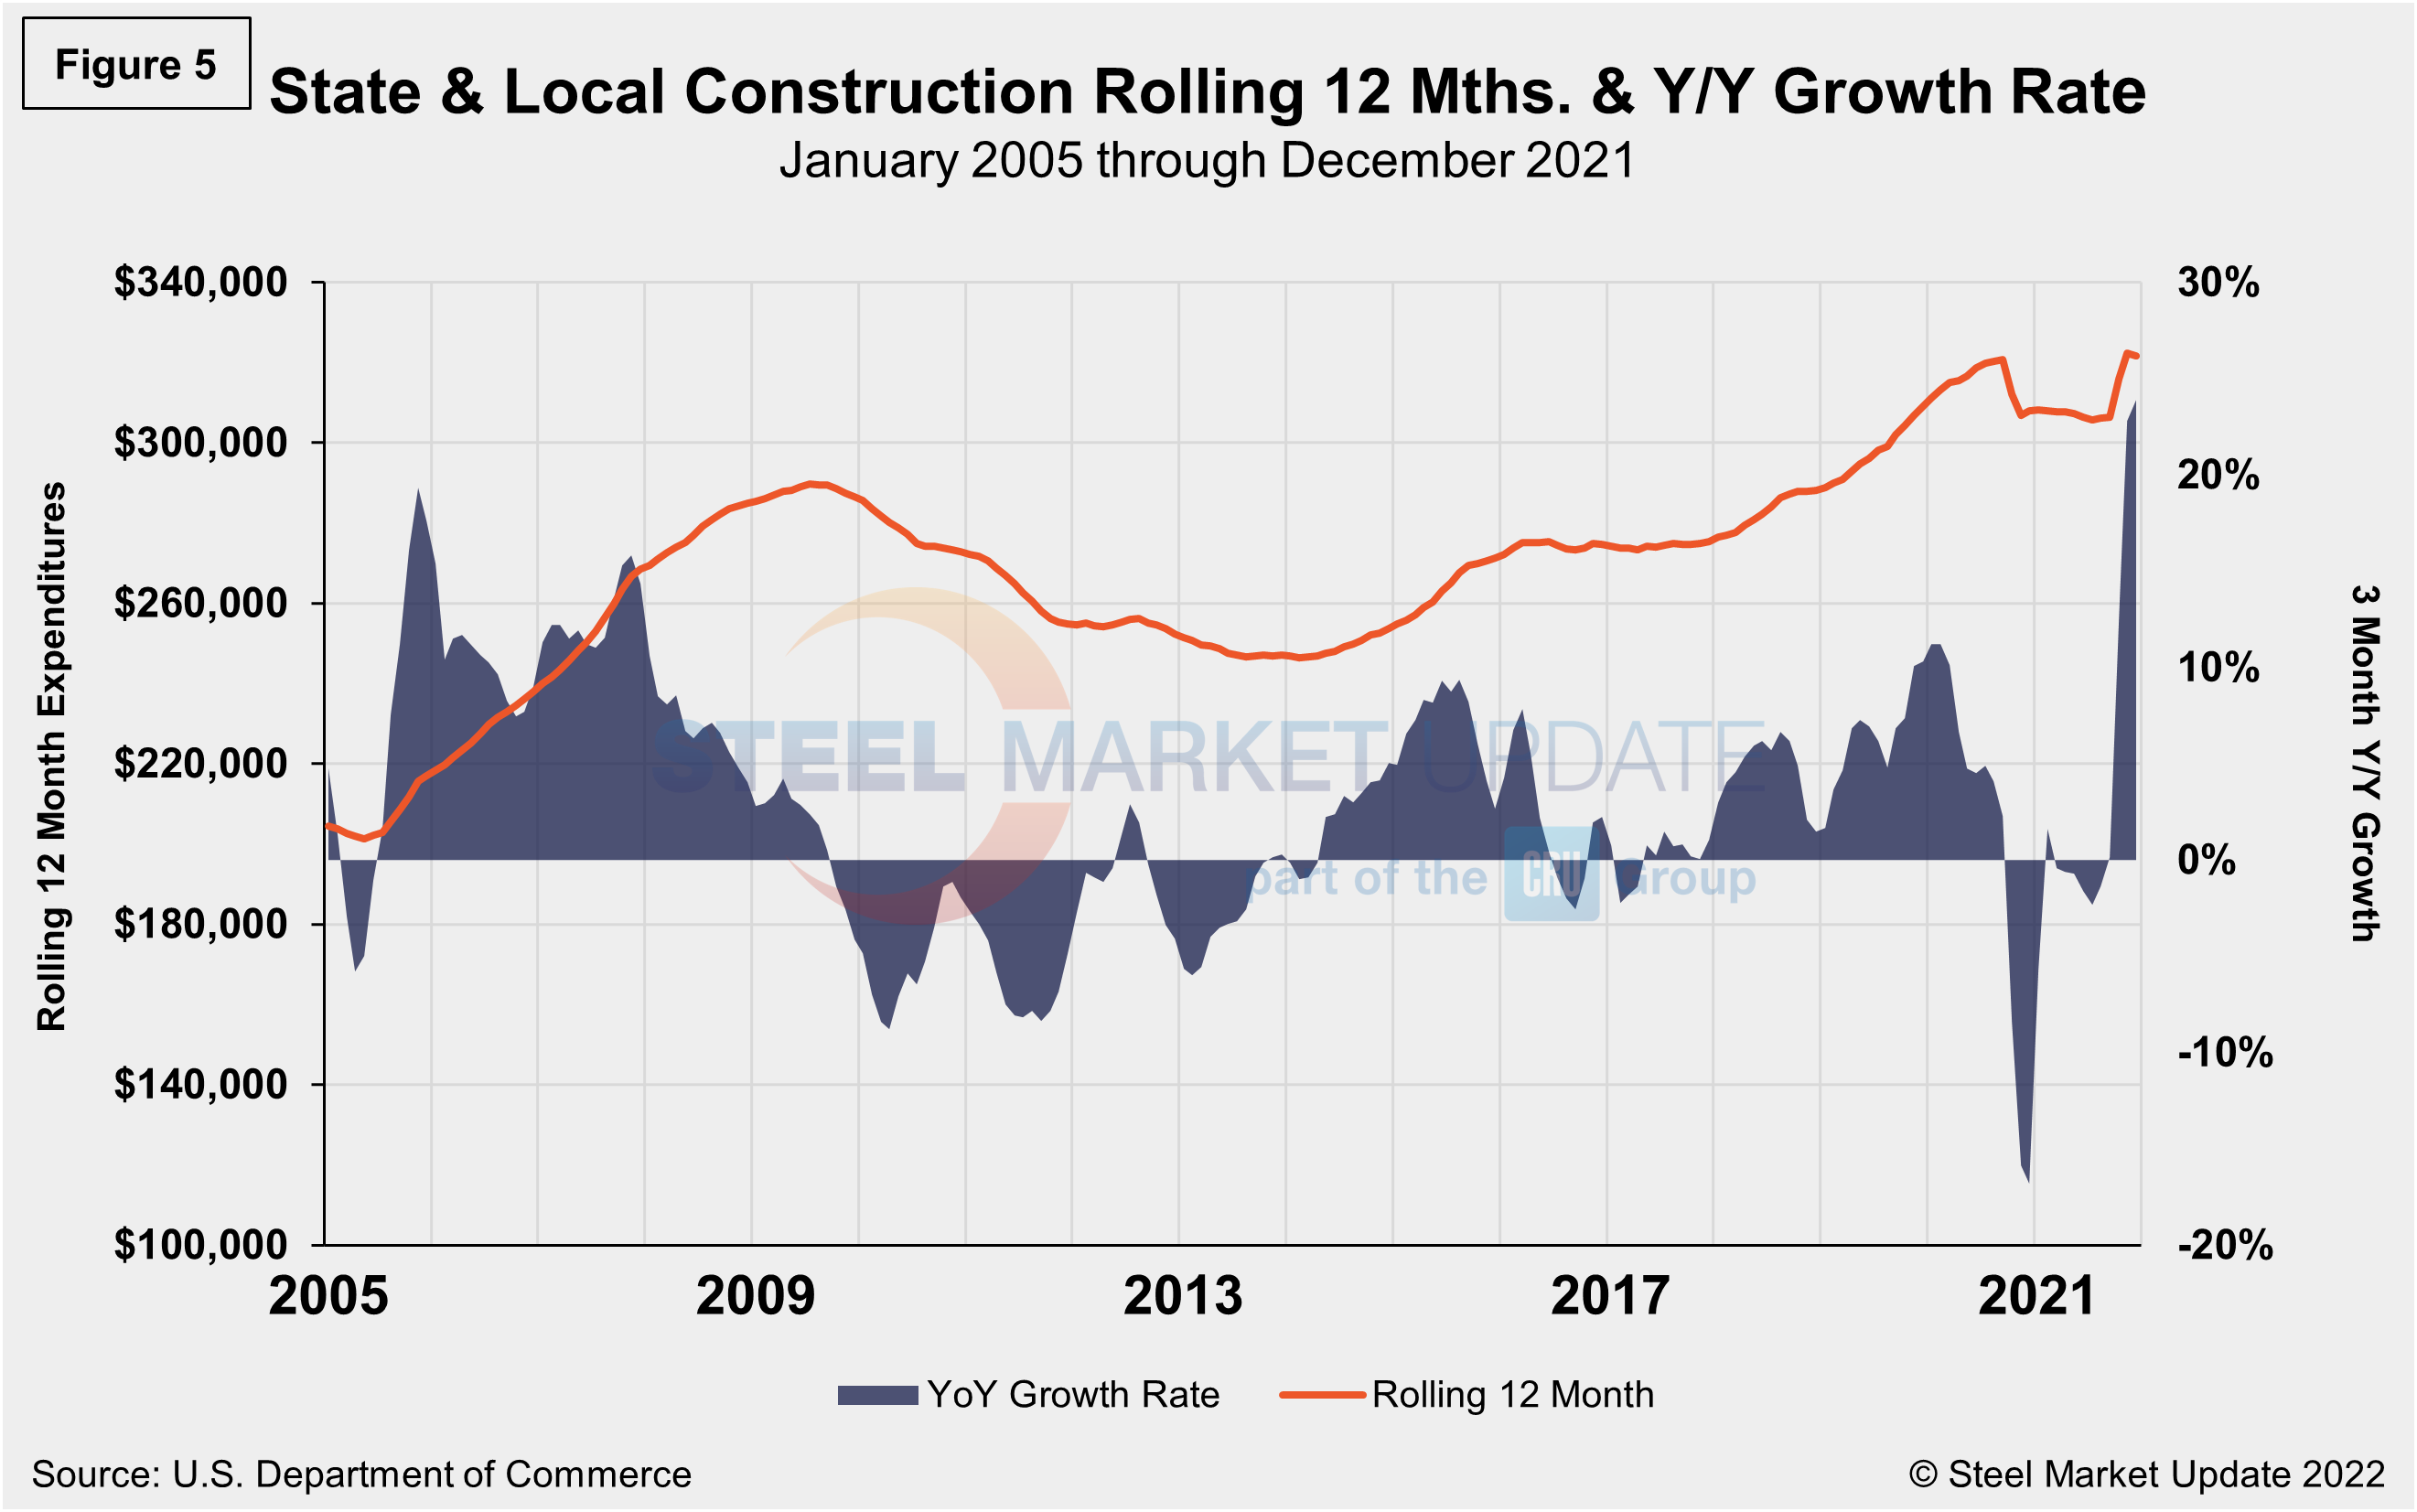
Despite an overall decrease month on month, in the three months through December overall state and local construction was up 23.9%, a steady improvement from the month prior when the sector saw a boost of 22.7%. Only Health Care, Transportation and Offices are no longer lagging pre-pandemic levels. Nearly all subcategories are currently trending up, with the exception of commercial, down 19.7% over the past three months. Figure 5 shows the history of total S&L expenditures.
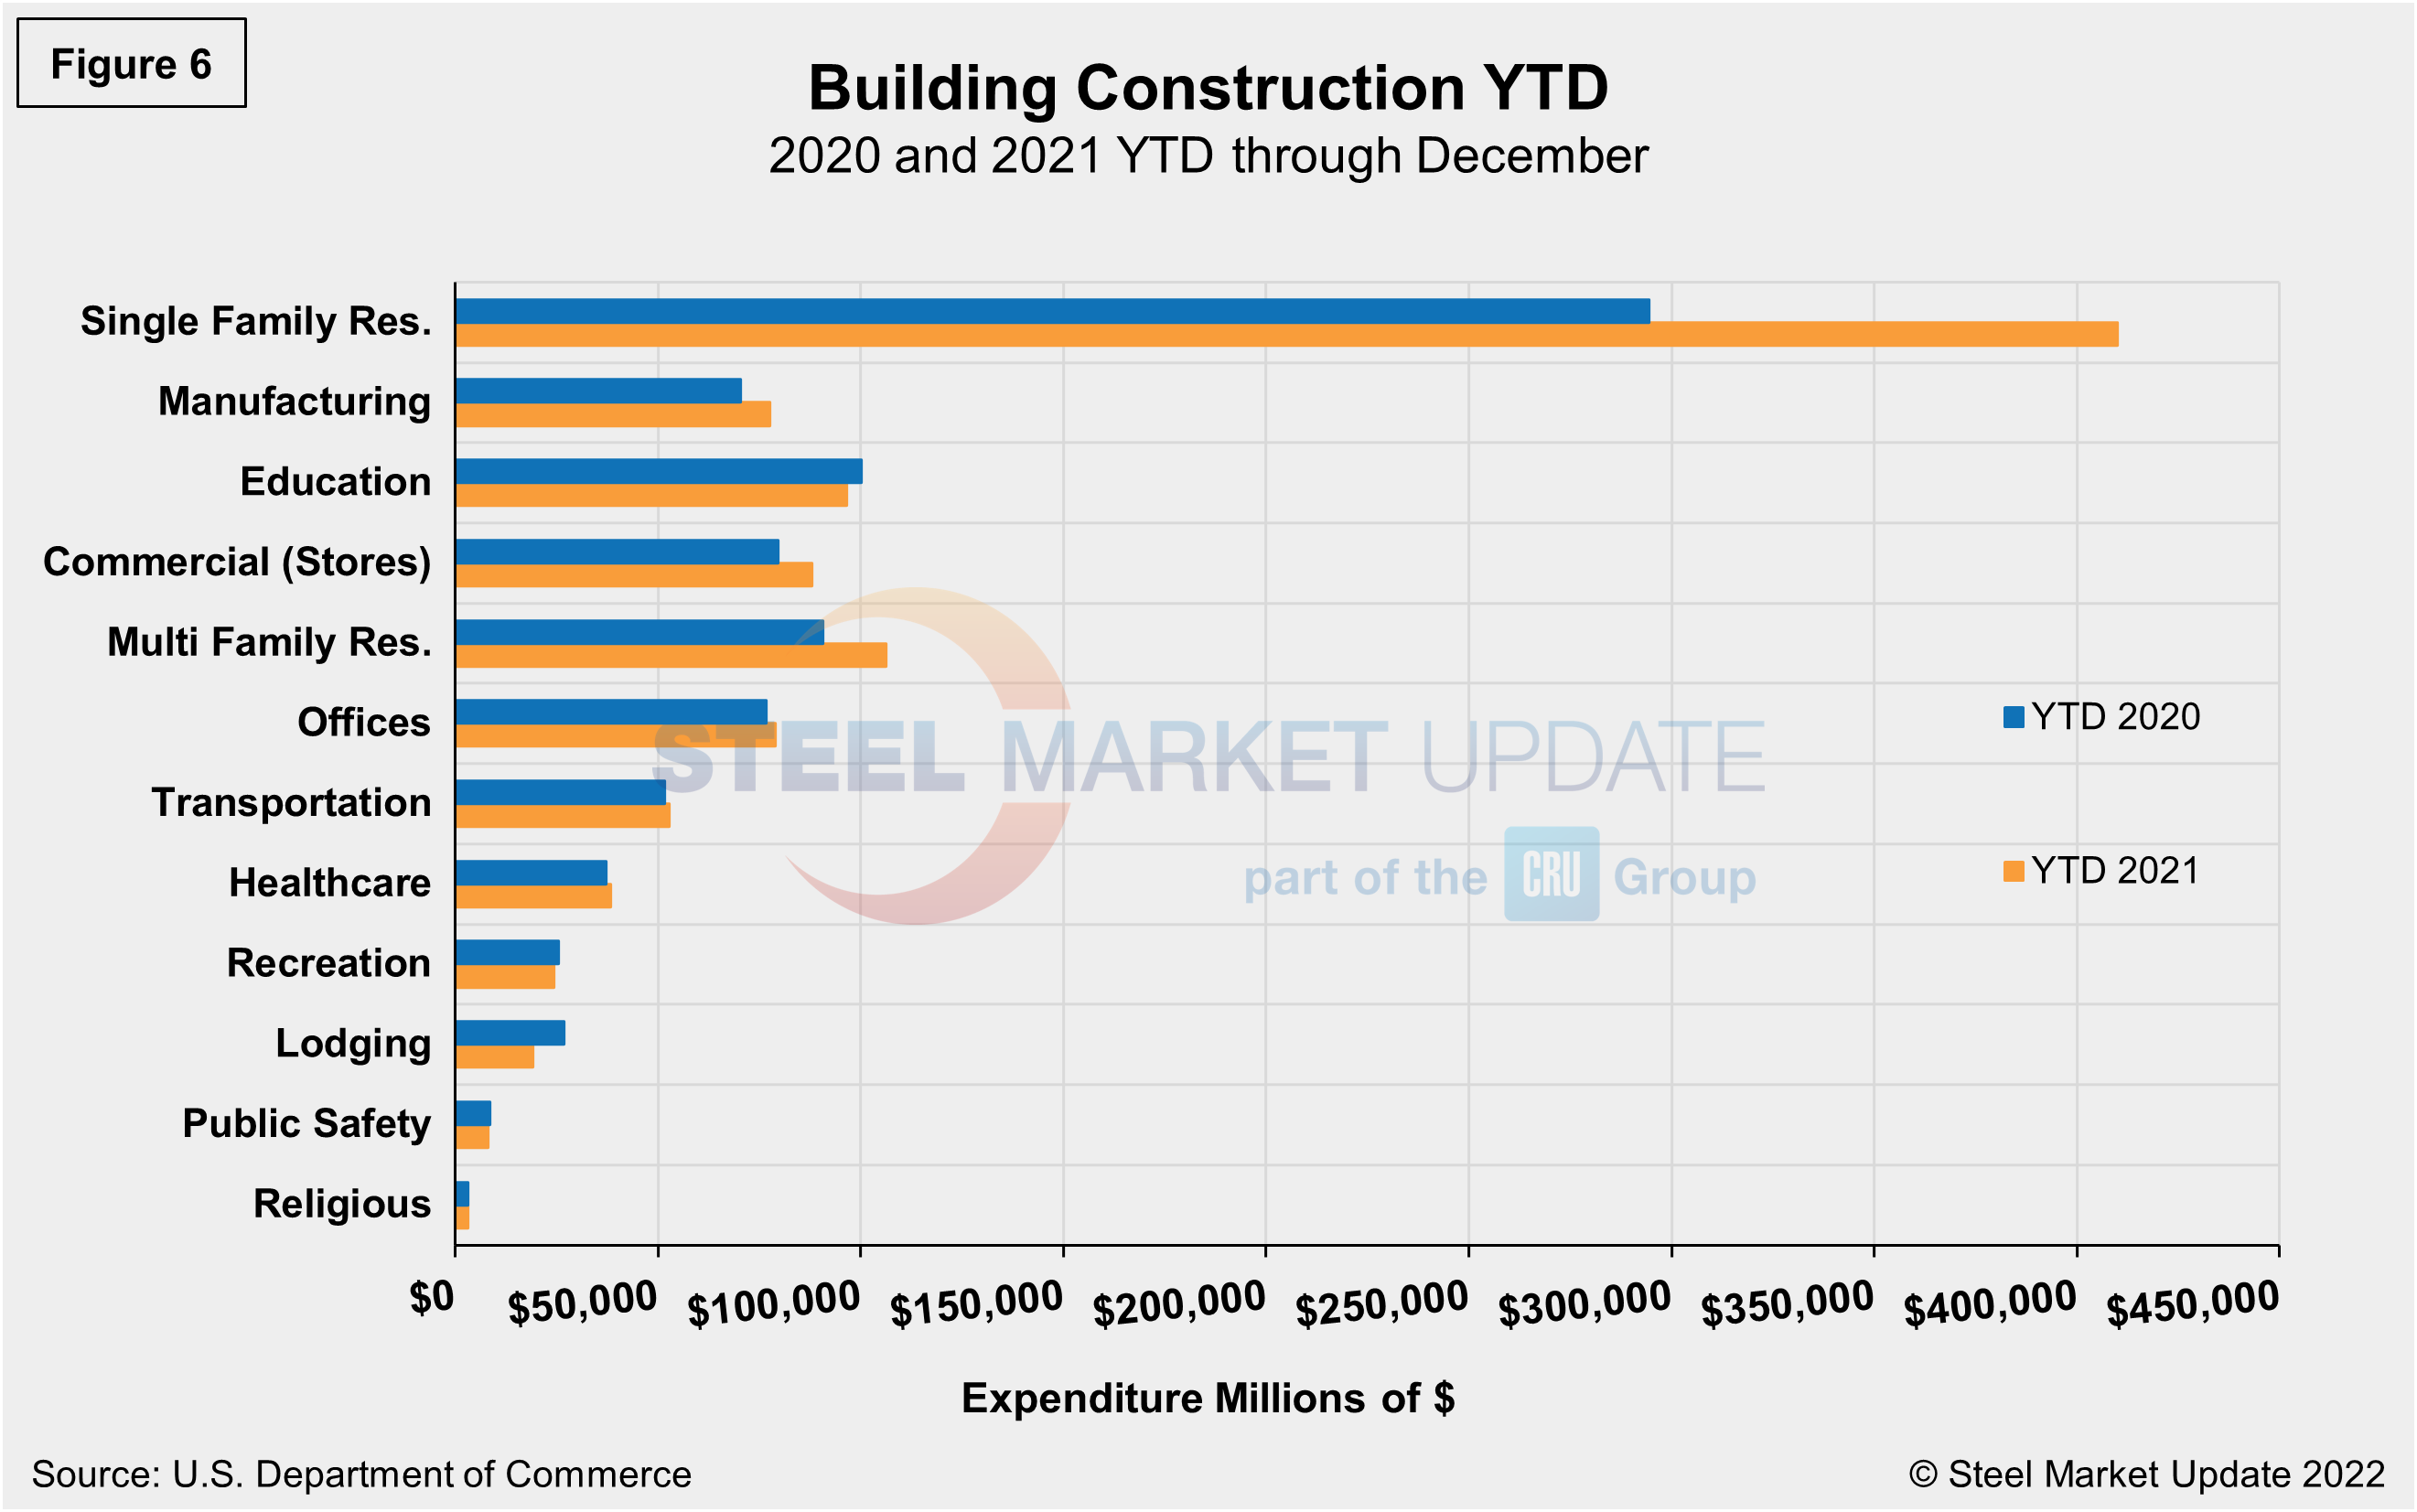
Year-to-date expenditures for construction of the various building sectors for 2020 and 2021 are compared in Figure 6. Single-family residential construction was dominant in 2020 with expenditures totaling an annualized $294.5 billion. The same was seen in 2021. For the full year, expenditures for single-family construction were $409.9 billion, exceeding 2020 by 39.2%. Multifamily residential at 17.2%, commercial at 10.5%, and manufacturing at 10.3% are the subsectors experiencing the strongest year-to-date expansion compared to the same year-ago period. Lodging is behind by double digits at 29.0% year on year, followed by recreation and public safety, down 4.3% and 3.6%, respectively.
Explanation: Each month, the Commerce Department issues its Construction Put in Place (CPIP) data, usually on the first working day covering activity one month and one day earlier. There are three major categories based on funding source: private, state and local, and federal. Within these three groups are about 120 subcategories of construction projects. SMU analyzes the expenditures from the three funding categories to provide a concise summary of the steel-consuming sectors.
By David Schollaert, David@SteelMarketUpdate.com


