

Market Data

February 3, 2022
Employment by Industry: January Outperforms Expectations
Written by David Schollaert
The U.S. labor market performed surprisingly well in January, adding 467,000 new jobs in the New Year, well ahead of the expected 150,000. The payroll boost was met by a marginally higher unemployment rate at 4.0%, up from 3.9% in December.
The latest data from the U.S. Bureau of Labor Statistics showed that U.S. payrolls rose far more than anticipated in January despite surging omicron cases, reversing a downward trend over the past several months.
January’s gain came a week after the Biden administration warned that the numbers could be low due to the pandemic, matching most economists’ forecasts for a tepid January, though many expect stronger gains ahead.
The positive news didn’t end there. Along with the big upside surprise for January, massive revisions sent previous months considerably higher. December was revised up to 510,000 from 199,000, while November surged to 647,000 from the previously reported 249,000. For those two months alone, the initial counts were revised up by 709,000 jobs.
The revisions came as part of the annual adjustments from the BLS that saw sizeable changes for many of the months in 2021, as some seasonal factors that were dragging results down were moved out. Those changes brought the 2021 total to 6.665 million, easily the biggest single-year jobs gain in U.S. history.
The biggest employment gains in January came in leisure and hospitality, which saw 151,000 new hires, 108,000 of which came from bars and restaurants. Professional and business services contributed 86,000, while retail was up 61,000. The job gains were broad-based, with transportation and warehousing adding 54,000, local government education rising by 29,000 and health care moving higher by 18,000.
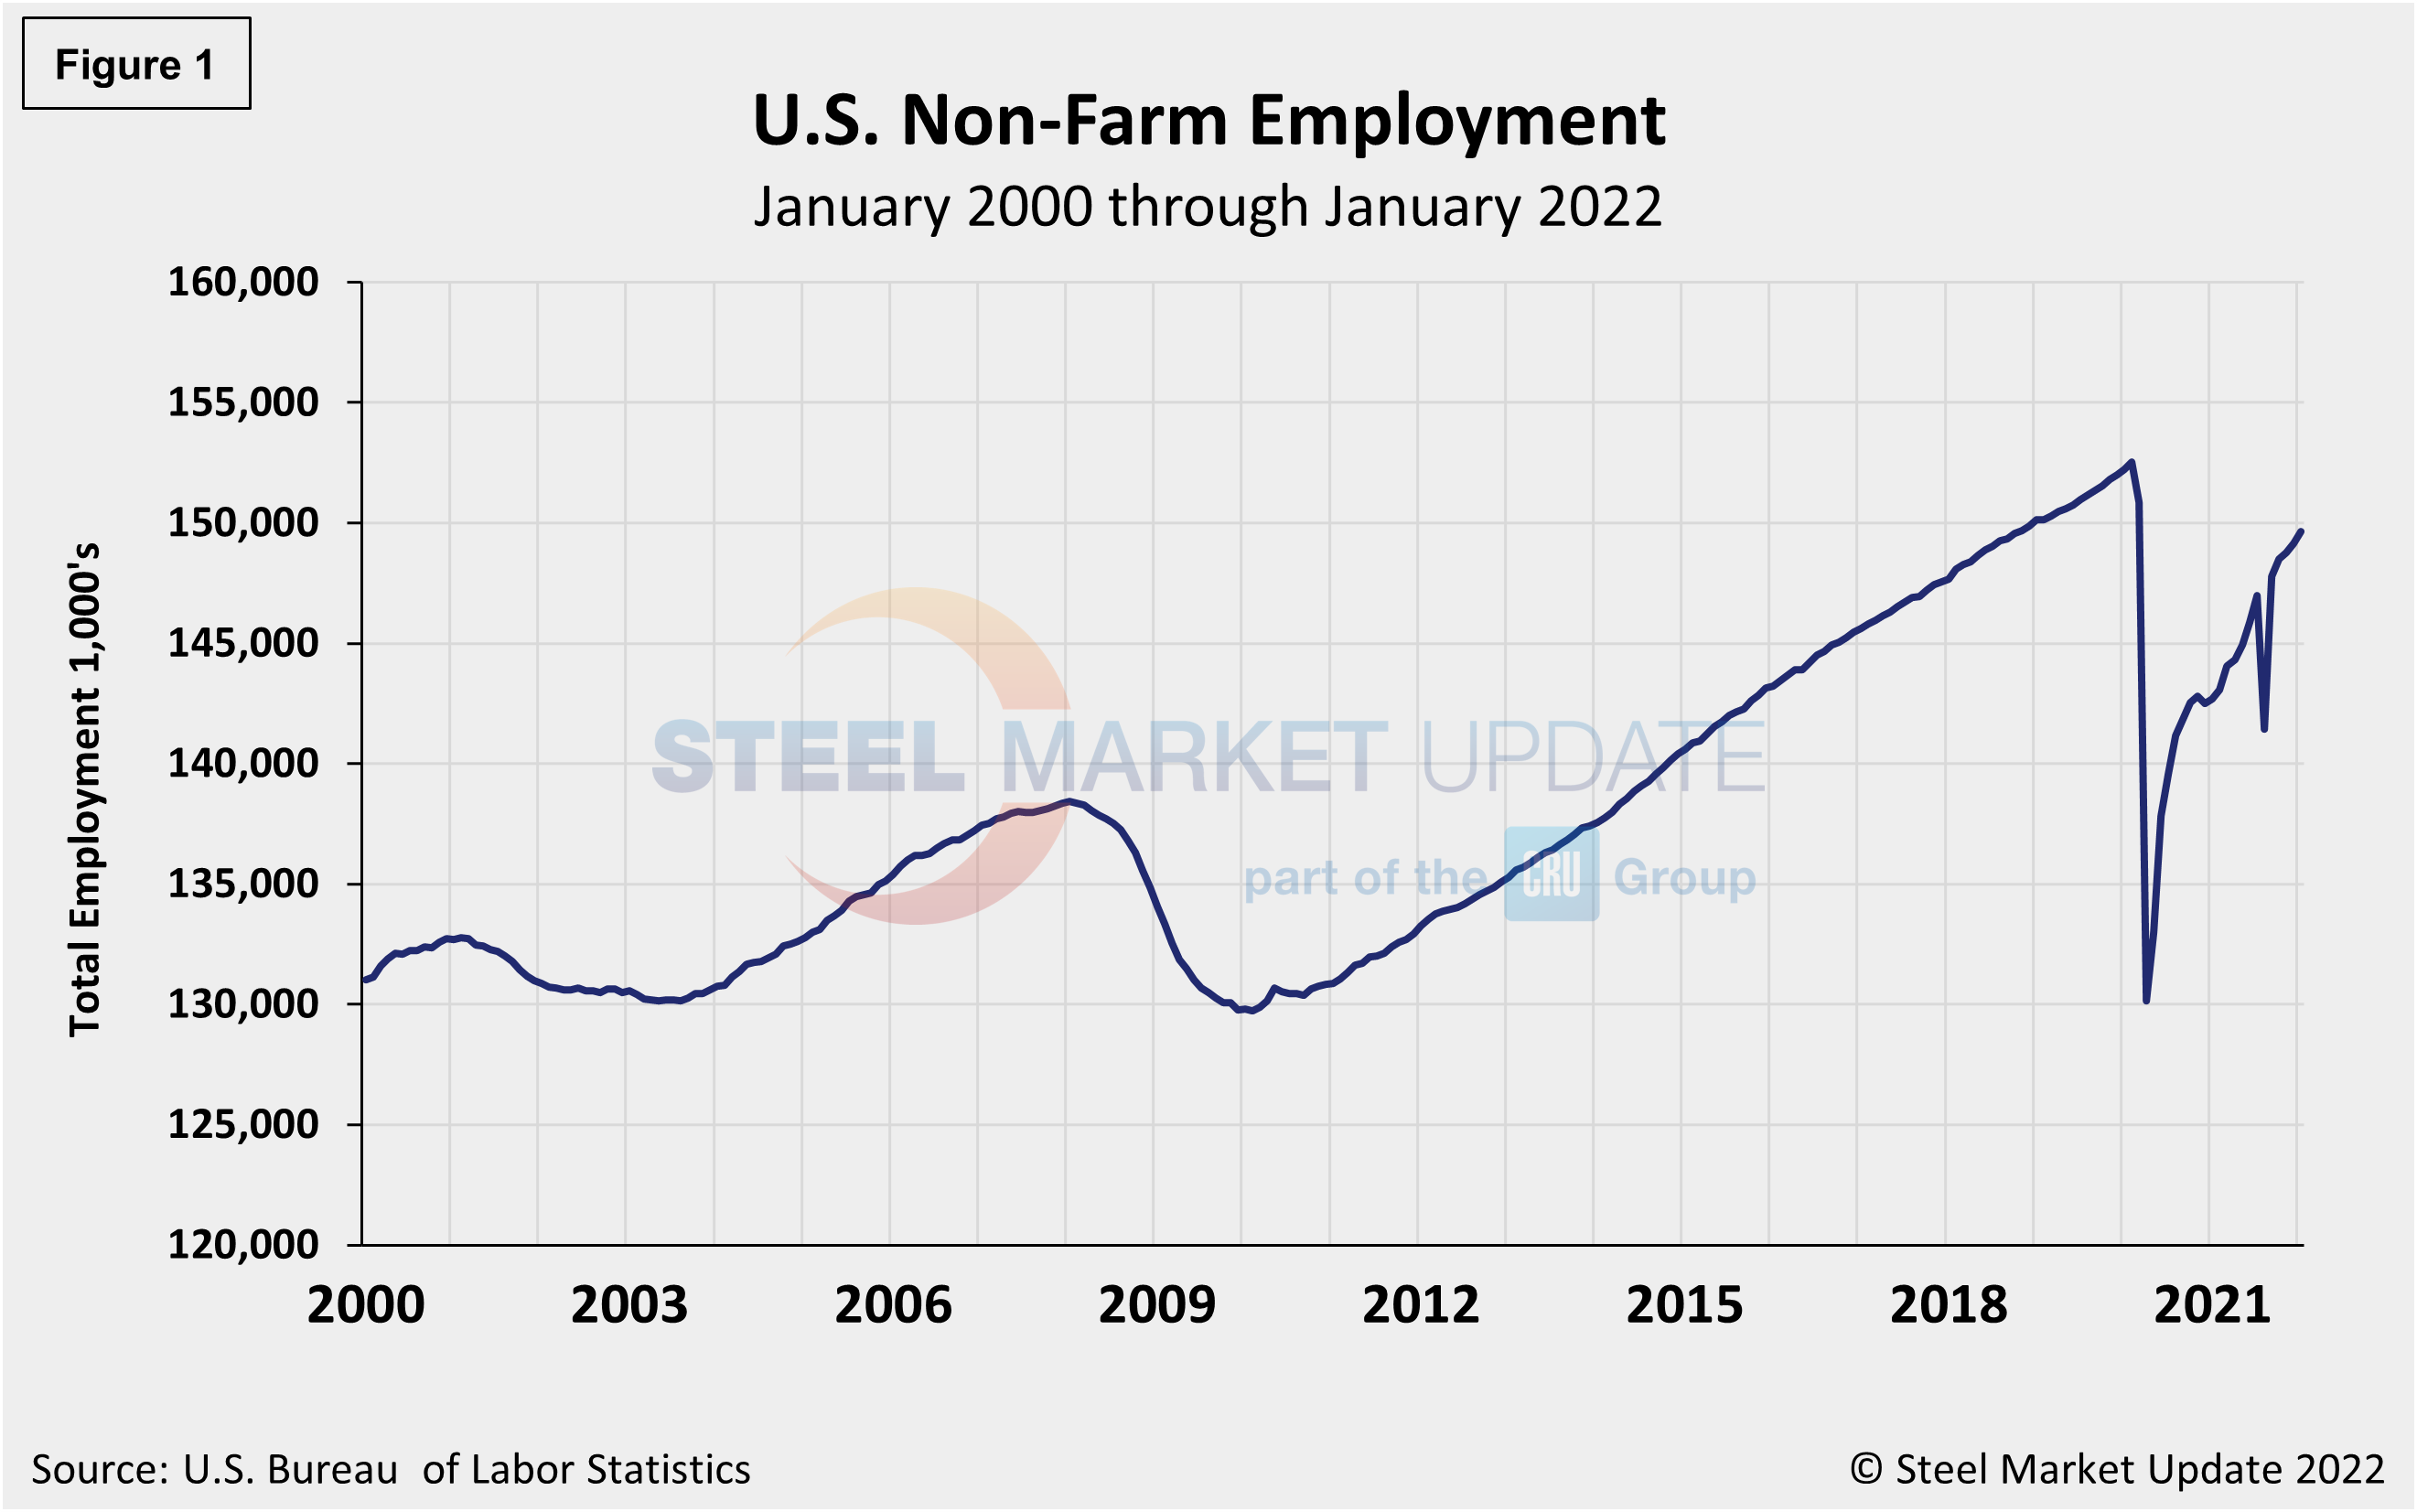
In total, the number of unemployed persons rose by 694,000 to 6.5 million last month. Figure 1 shows the total number of people employed in the nonfarm economy.
Designed on rolling time periods of 1 month, 3 months, 1 year and 2 years, the table below breaks total employment into service industries and goods-producing industries, and then into private and government employees. Most of the goods-producing employees work in manufacturing and construction. Comparing service and goods-producing industries in January shows service jobs have increased by just 0.4%, while goods-producing jobs were flat against December’s result. Despite steady month-on-month gains, both industries remain behind pre-pandemic levels. Note, the subcomponents of both manufacturing and construction shown in this table don’t add up to the total because we have only included those with the most relevance to the steel industry.
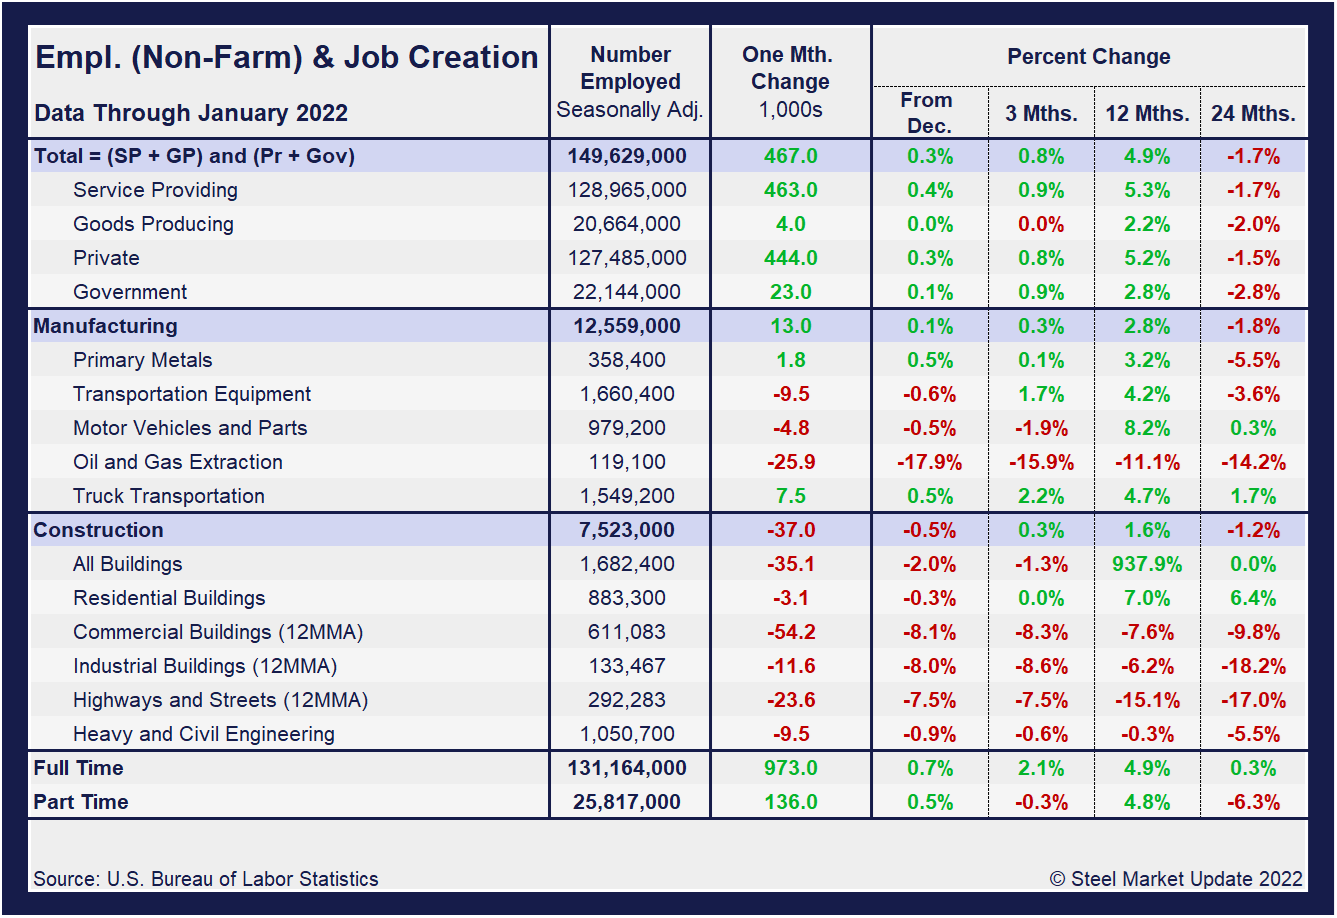
Comparing January to December, manufacturing employment was up 0.1%, a slightly slower pace than the two previous months. Construction was down 0.5% monthly compared to a 0.3% and a 0.4% increase in November and December, respectively. The construction sector, which has been driven by the residential market, saw its first decrease in months, down 0.3% in January. Gains have been held back even further by struggling commercial and industrial building sectors. Despite the overall improvement, the inconsistencies in some of the subcomponents reflect the obstacles still facing the U.S. economy and domestic job creation. The three-month and 12-month comparisons show a good recovery, but still lag the 24-month pre-pandemic comparisons. In the year-over-year contrast, manufacturing is up 2.8% and construction is up just 1.6%. Further growth is still expected as the marketplace advances from the freefall-driven pandemic in Q2 2020.
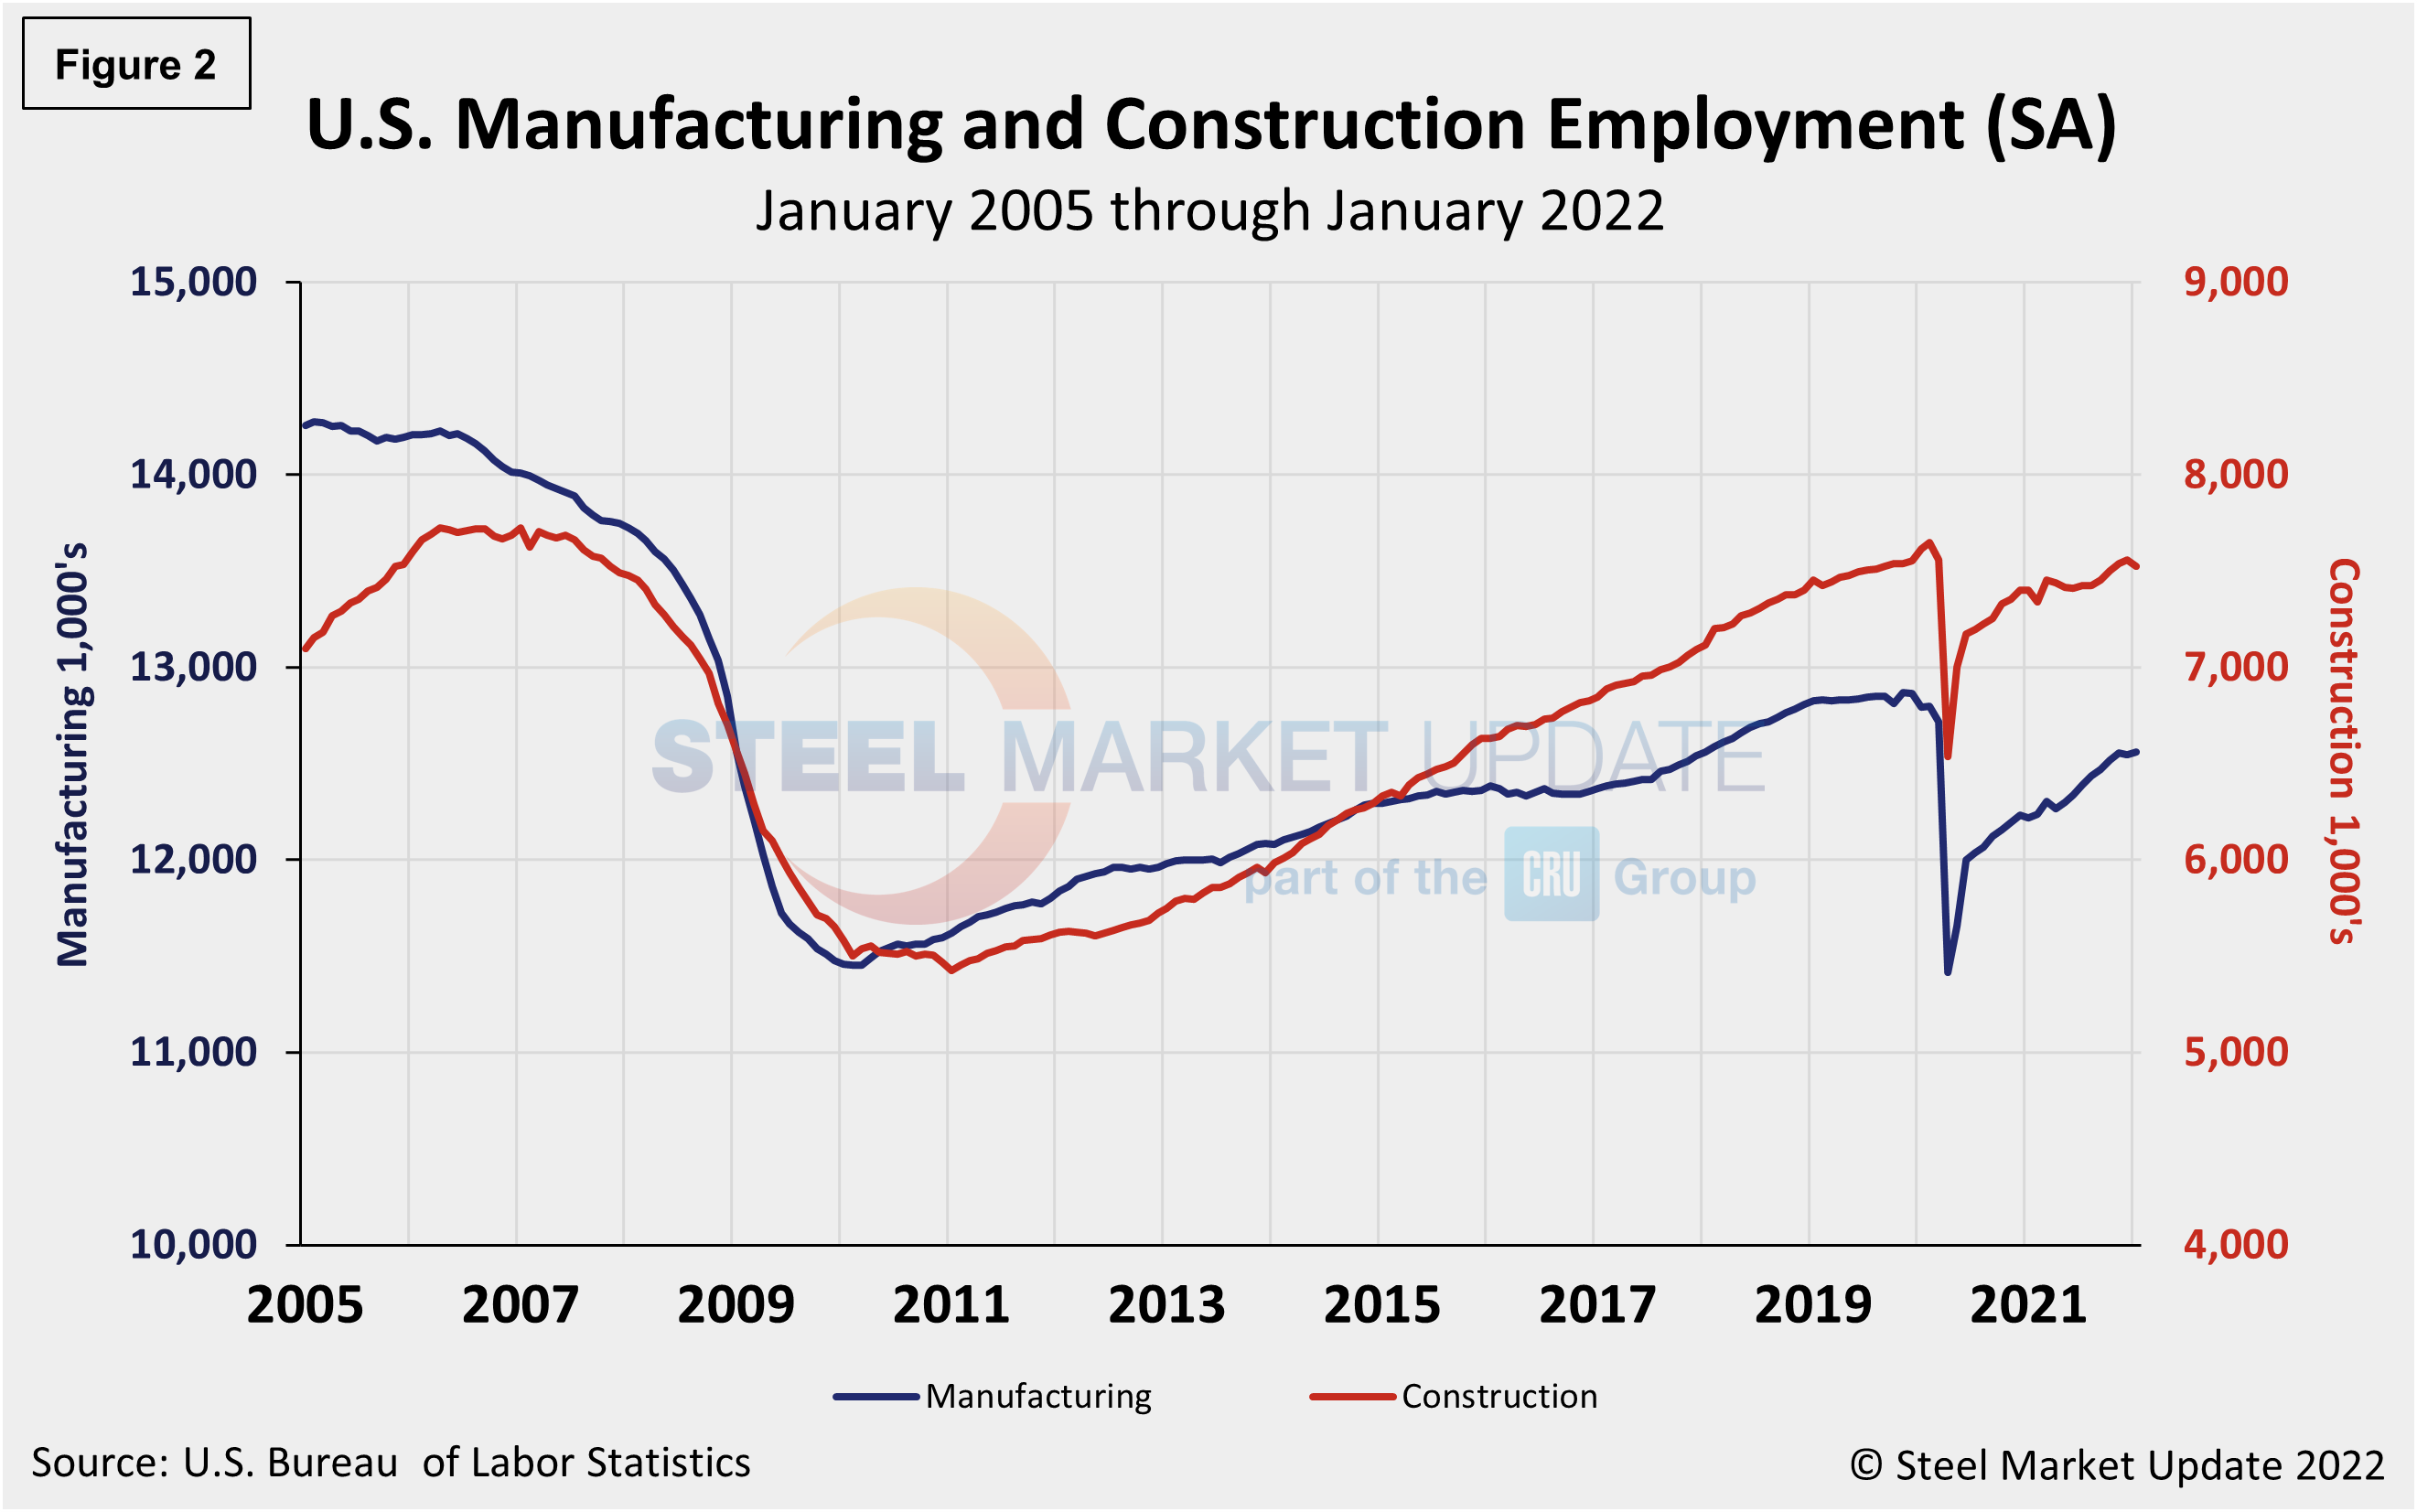
Manufacturing employment increased by just 13,000 jobs in January, while construction employment fell by 37,000. The history of employment in manufacturing and construction since January 2005 is show below in Figure 2, seasonally adjusted.
According to human resources consulting firm Challenger, Gray and Christmas, Inc., companies in Health Care announced the most job cuts in January with 5,053, followed by Warehousing with 3,051. The Services sector announced 1,786 cuts last month, while Entertainment/Leisure firms cut 1,691. Consumer Products manufacturers announced 1,432 job cuts last month.
Other reasons for job cuts in January included vaccine refusal, which accounted for the most job cuts last month. Another 4,442 occurred because of store, plant or unit closings. Companies reported that challenging market conditions caused another 3,932 cuts.
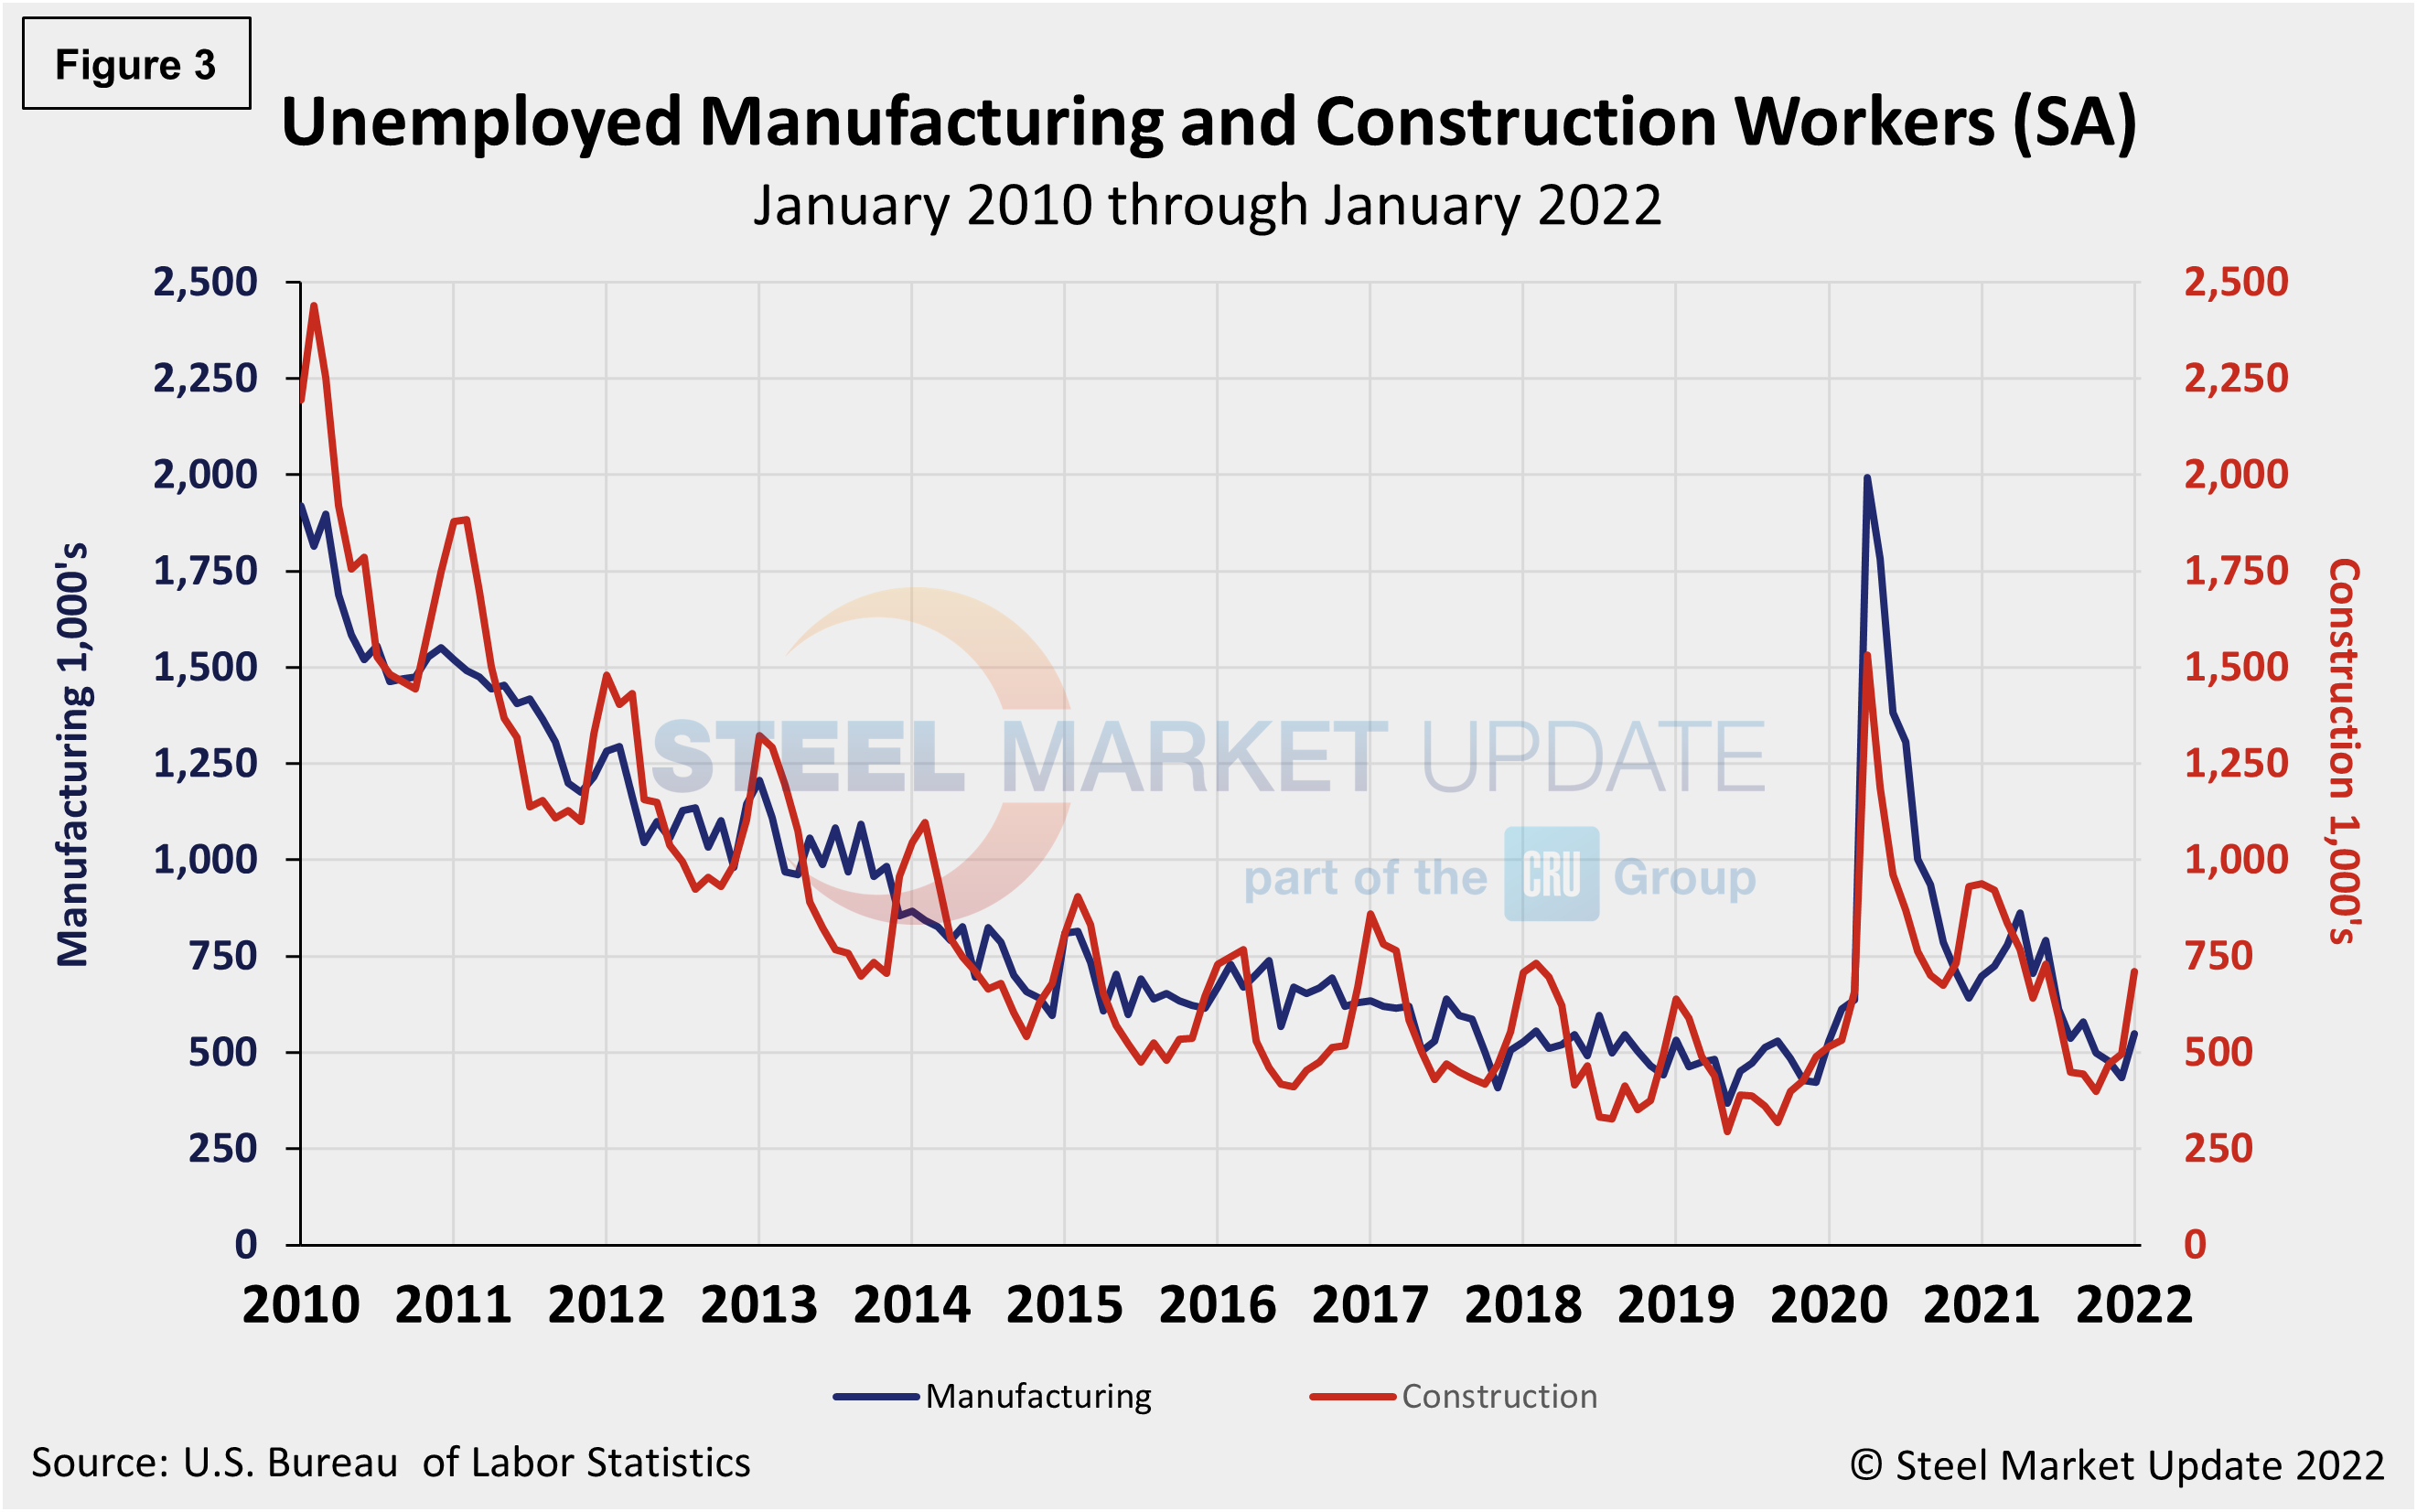
The reported number of unemployed manufacturing and construction workers is shown in Figure 3. Construction and manufacturing unemployment continued to diverge in December. Construction unemployment surged a whopping 42.7% month on month, from 497,000 in December to 709,000 in January. Manufacturing’s unemployed jumped from 435,000 in December to 549,000 last month, a 26.2% rise month on month. Both sectors have been heavily impacted by supply-chain disruptions and labor force constraints, on top of seasonality. Withdrawal of the vaccine mandate by the White House late last month is expected to boost employment in these sectors moving forward.
Explanation: On the first or second Friday of each month, the Bureau of Labor Statistics releases the employment data for the previous month. Data is available at www.bls.gov. The BLS employment database is a reality check for other economic data streams such as manufacturing and construction. It is easy to drill down into the BLS database to obtain employment data for many subsectors of the economy. The important point about all these data streams is not necessarily the nominal numbers, but the direction in which they are headed.
By David Schollaert, David@SteelMarketUpdate.com


