

Market Data

February 3, 2022
U.S. Job Creation: Fast Out of the Gate in January
Written by David Schollaert
U.S. job growth saw an unexpectedly rapid expansion in January, outperforming expectations and nearly tripling early estimates. January payrolls rose by 467,000, well above the 150,000 anticipated by economists and a strong start to 2022 despite a new COVID-19 variant.
Strong hiring aside, the unemployment rate rose slightly to 4.0%, a 0.1 percentage point increase despite rising labor force participation, the Labor Department reported.
The Labor Department also revised the December employment gain up from an initially reported 199,000 to 510,000 and November’s job gain from 249,000 to 647,000 – painting a much stronger picture of the labor market than expected.
The U.S. added 86,000 jobs in professional and business services, 61,000 jobs in retail trade, 54,000 jobs in transportation, and 29,000 jobs in local government and education last month.
Workers also saw their wages climb as employers sought to fill millions of job openings from a smaller labor force than before the pandemic. Average hourly earnings rose $0.23 in January and 5.7% annually, though the average workweek for employees fell by 0.2 hour.
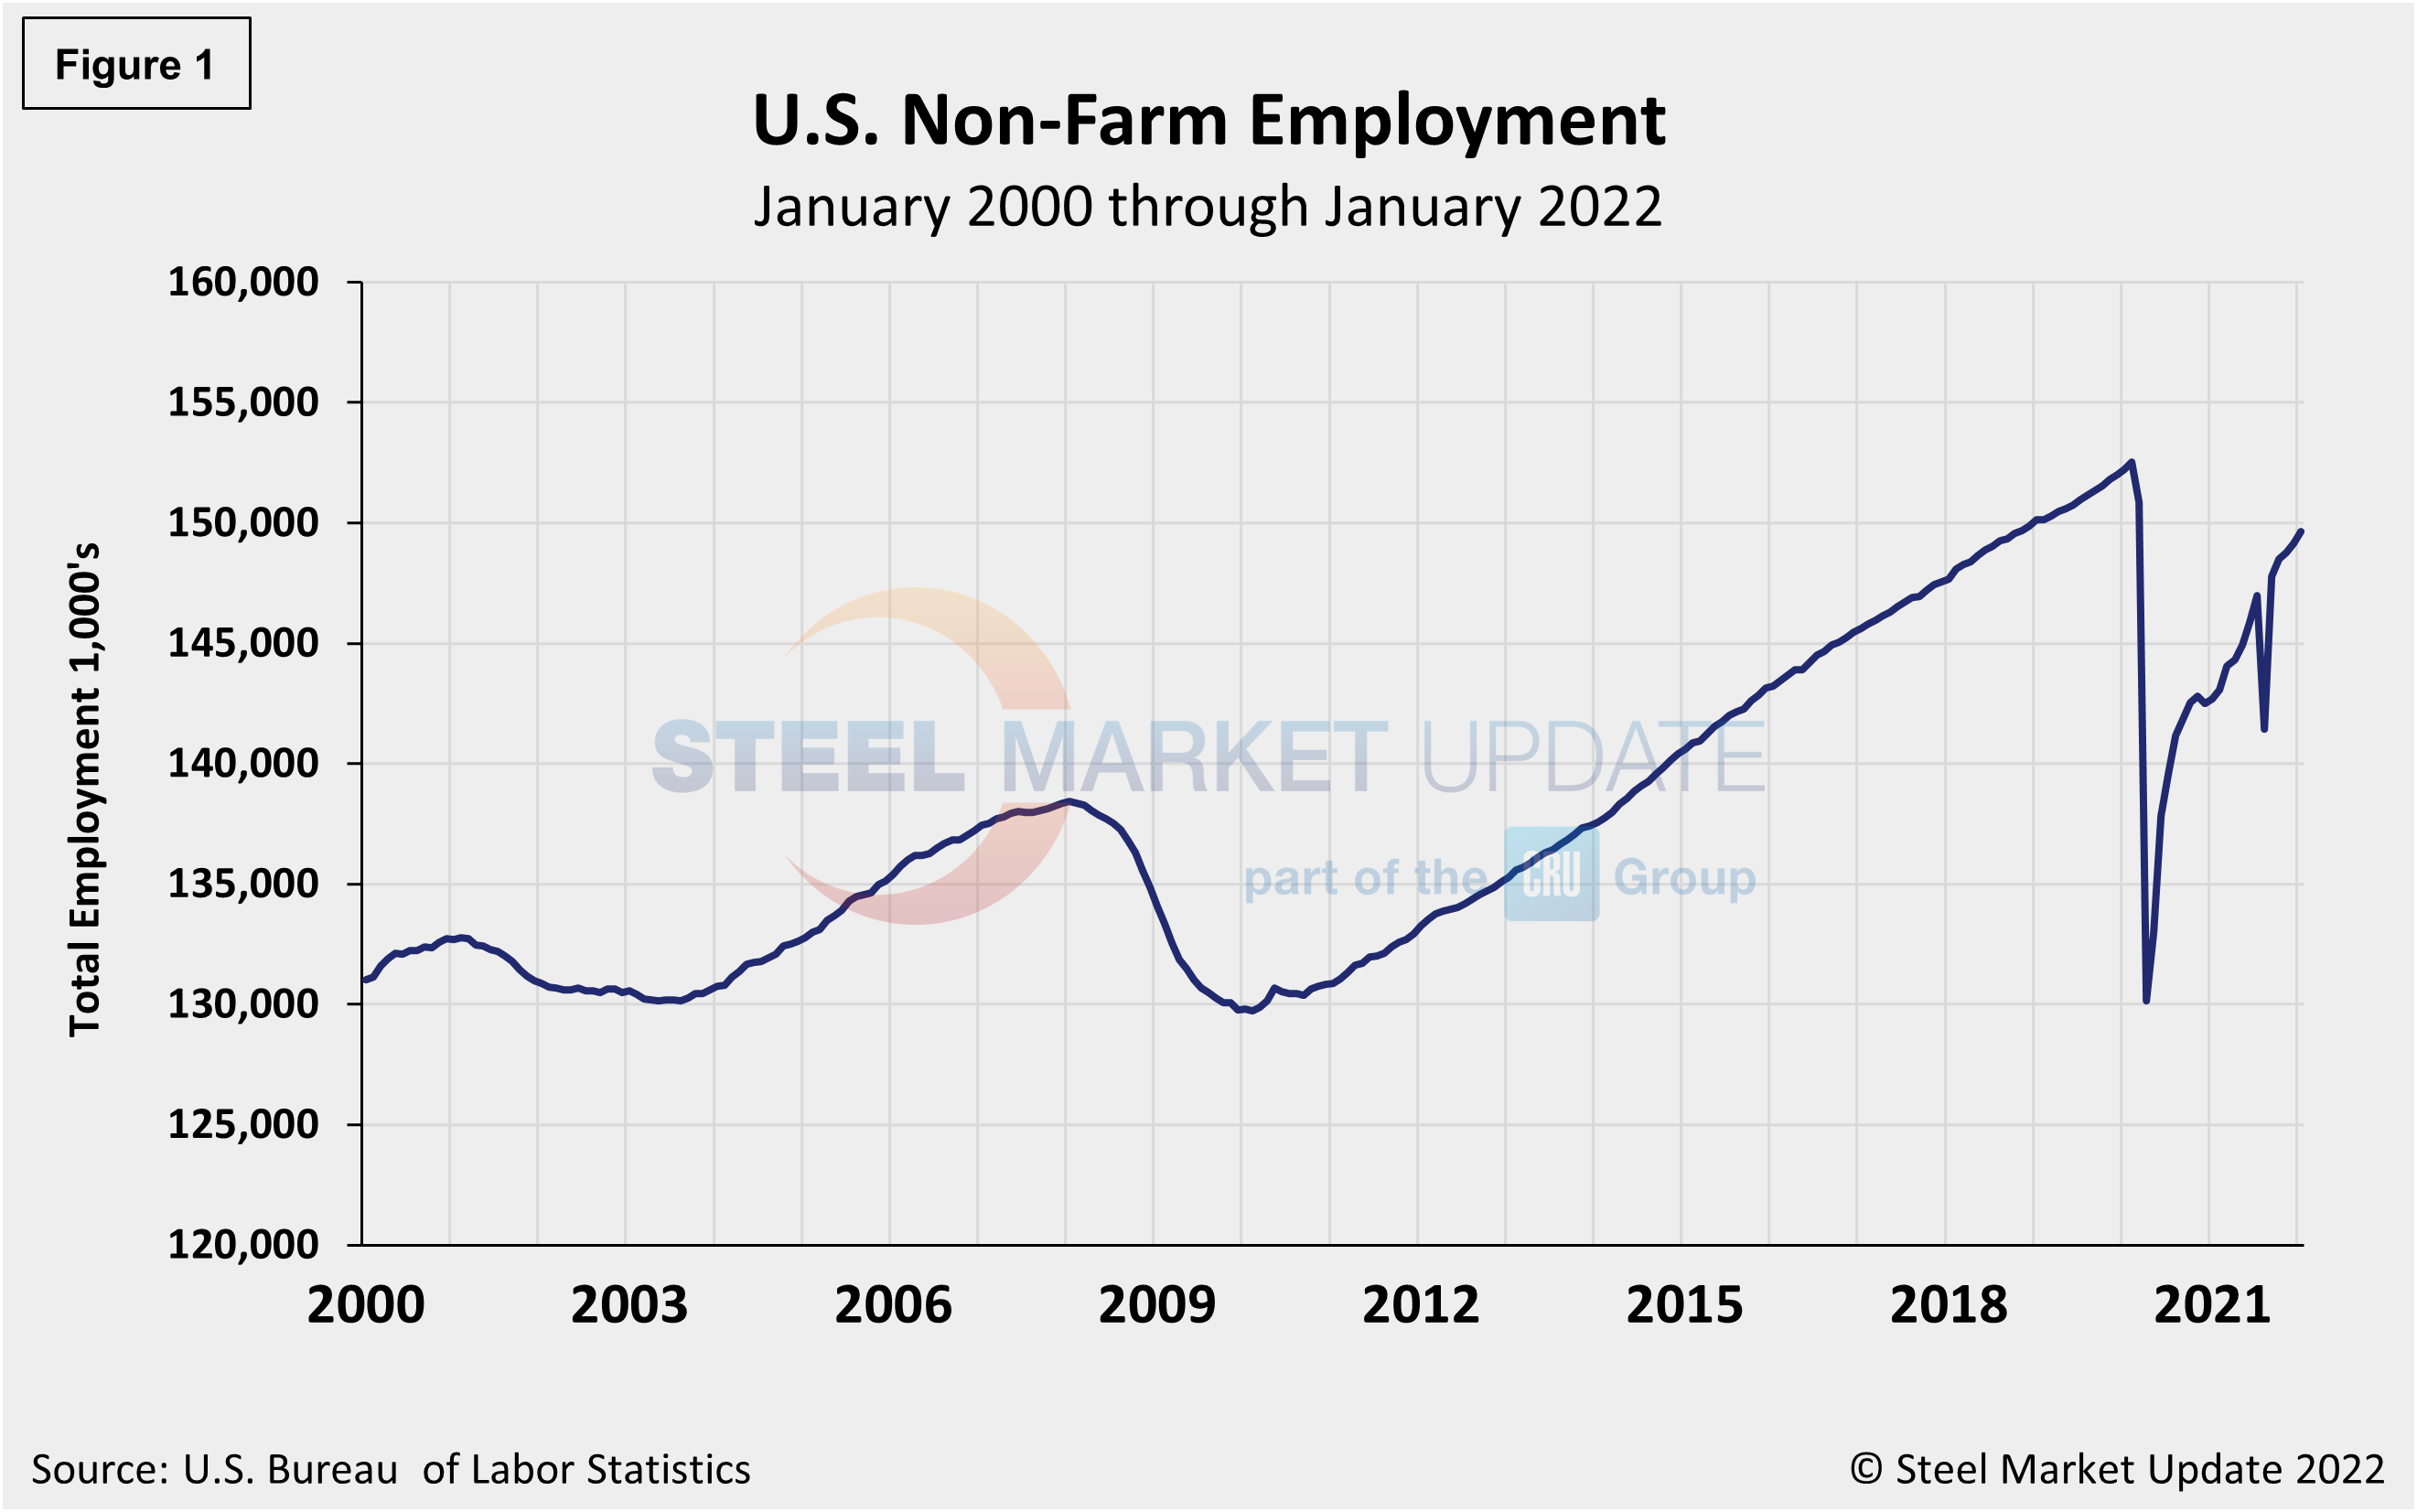
The labor force participation rate reached 62.2%, the highest pandemic-era total and the top measure since March 2020. Figure 1 shows the total number of nonfarm workers employed in the U.S. since 2000.
The number of long-term unemployed (out of work for at least 27 consecutive weeks) declined to 1.7 million in January from 2.0 million the month prior, and accounted for 25.9% of the total unemployed in the month. This measure is down from 4.0 million a year earlier, but is 570,000 higher than in February 2020.
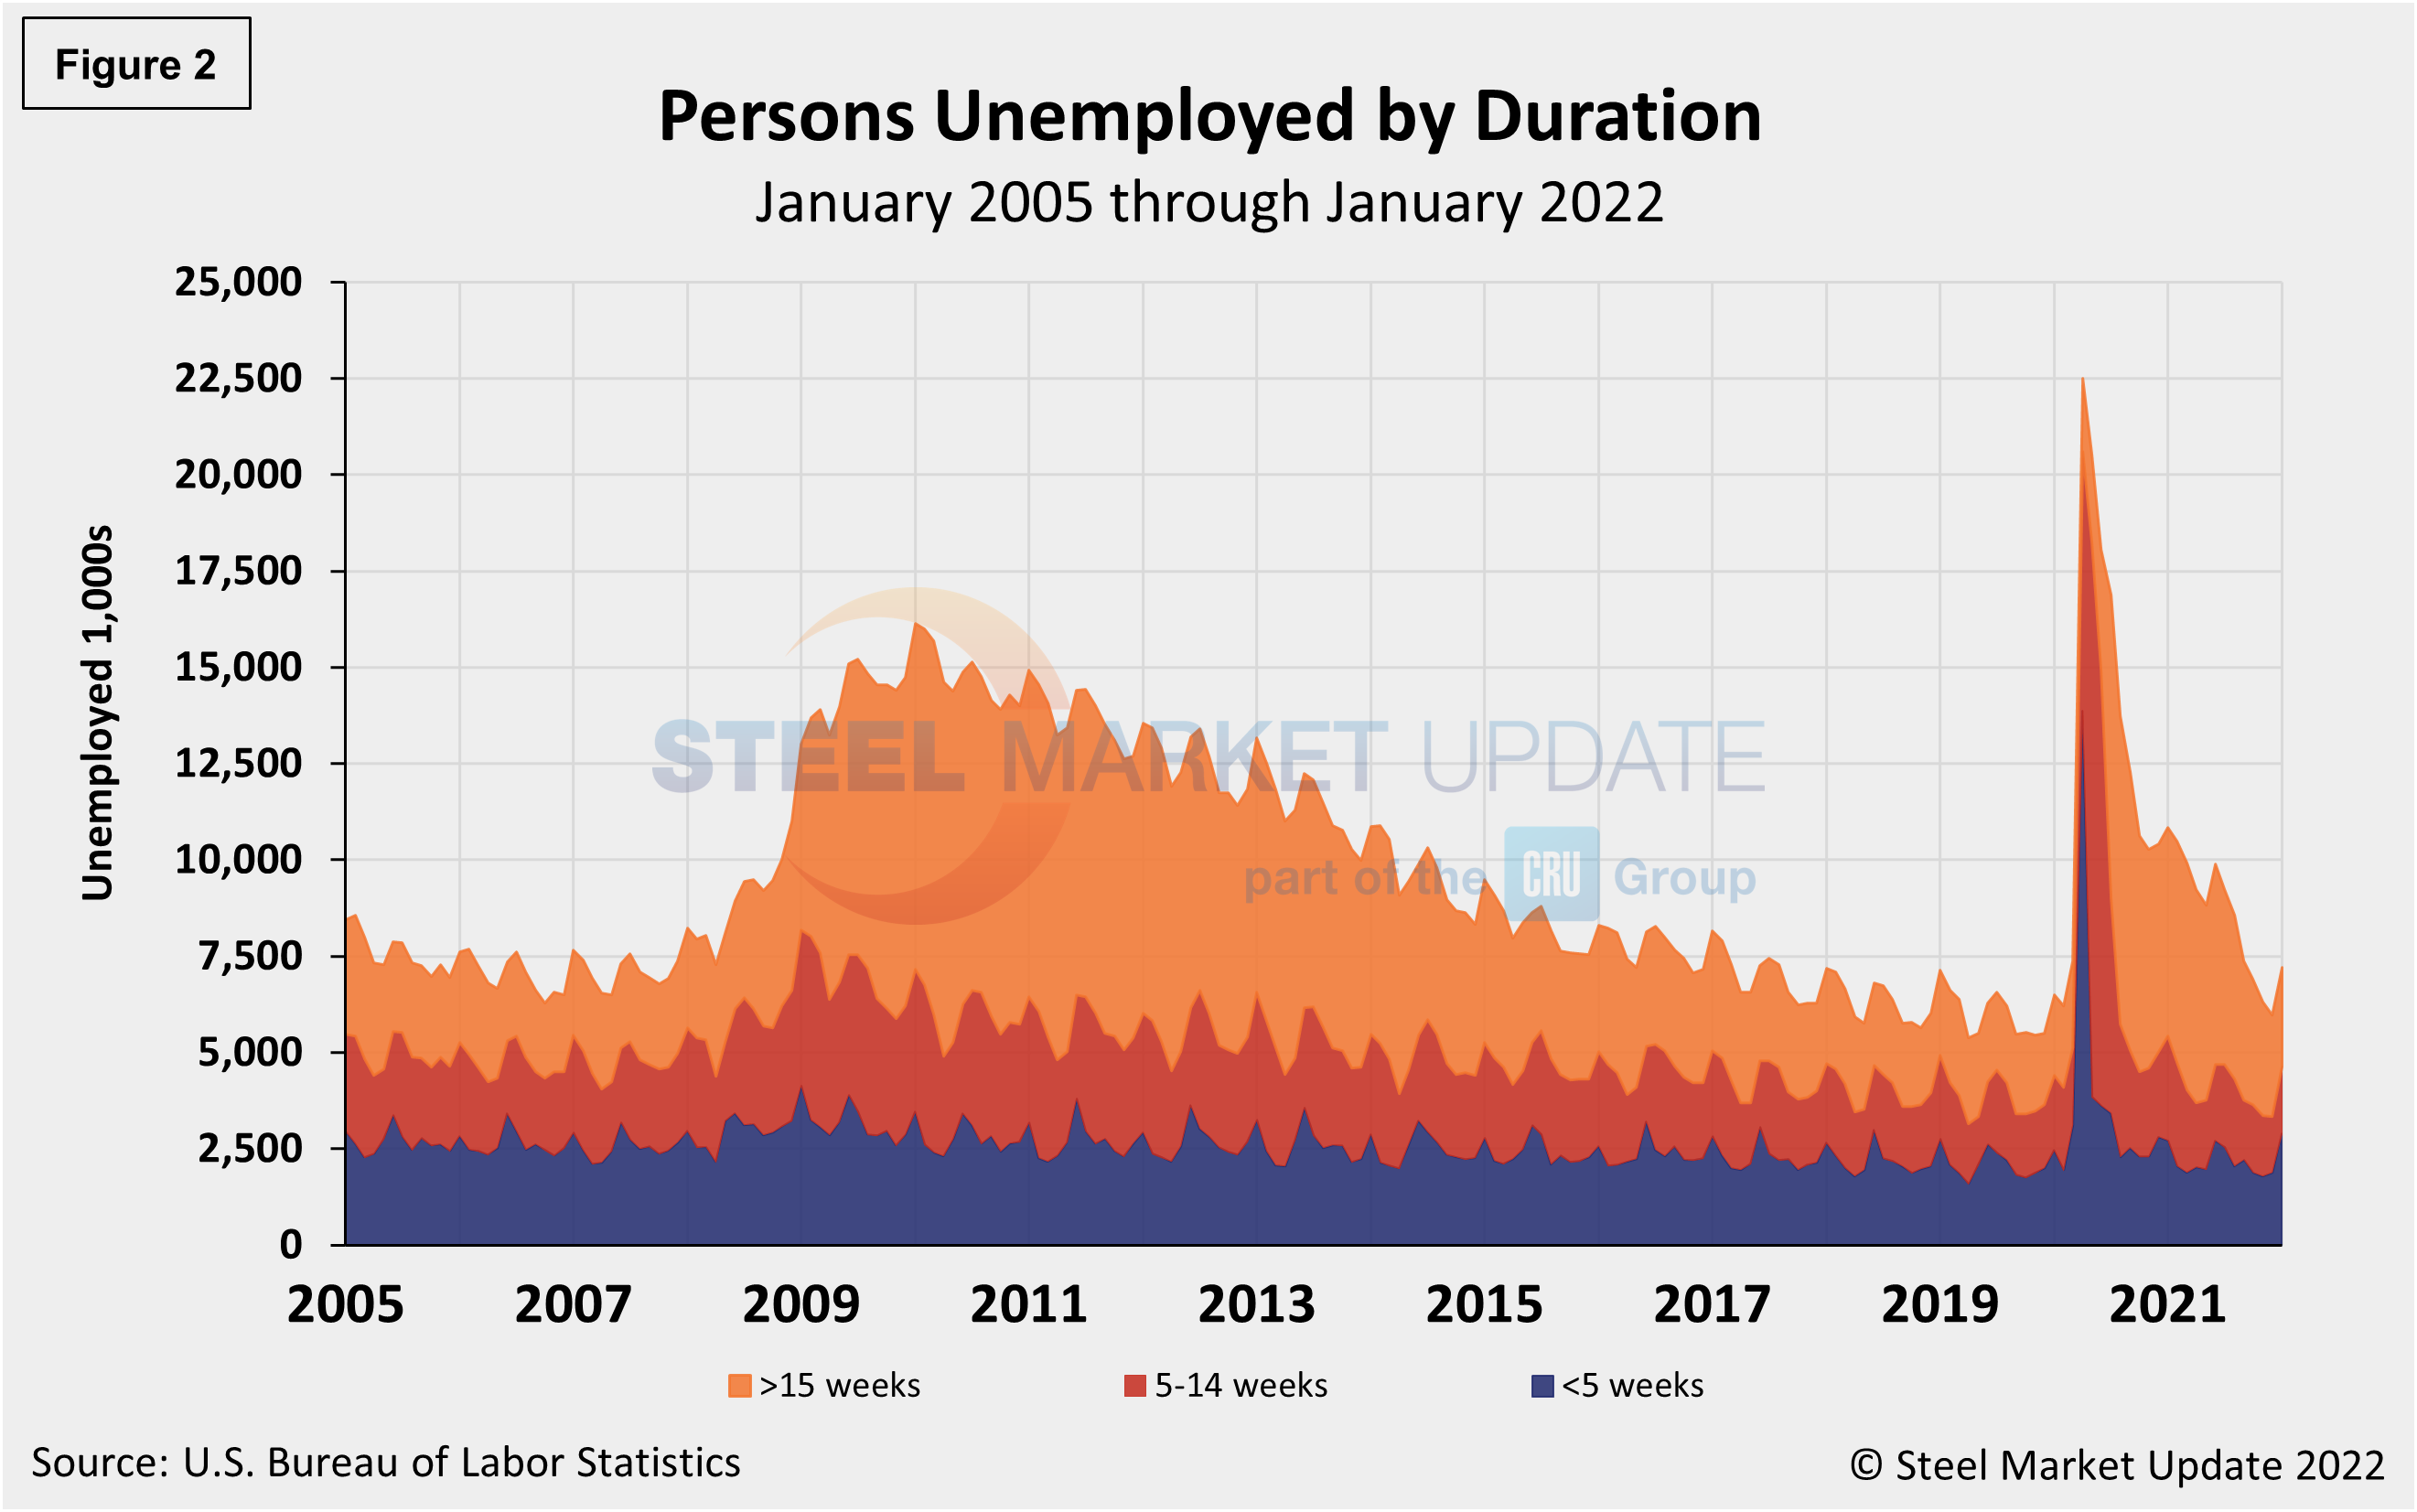
The historical picture for the duration of unemployment since January 2000 is broken down into <5 weeks, 5 to 14 weeks, and >15 weeks in Figure 2. The total number unemployed was 7.207 million at the end of January, a surge of 1.243 million compared to December. The result pushed the unemployment total above pre-pandemic levels by about 1.203 million people, while roughly 15.297 million more now have jobs compared to the 22.5 million thrown out of work during the worst of the pandemic in April of 2020. As of Feb. 4, 35.4% had been unemployed for more than 15 weeks, 24.5% for 5 to 14 weeks, and 40.1% for less than 5 weeks.
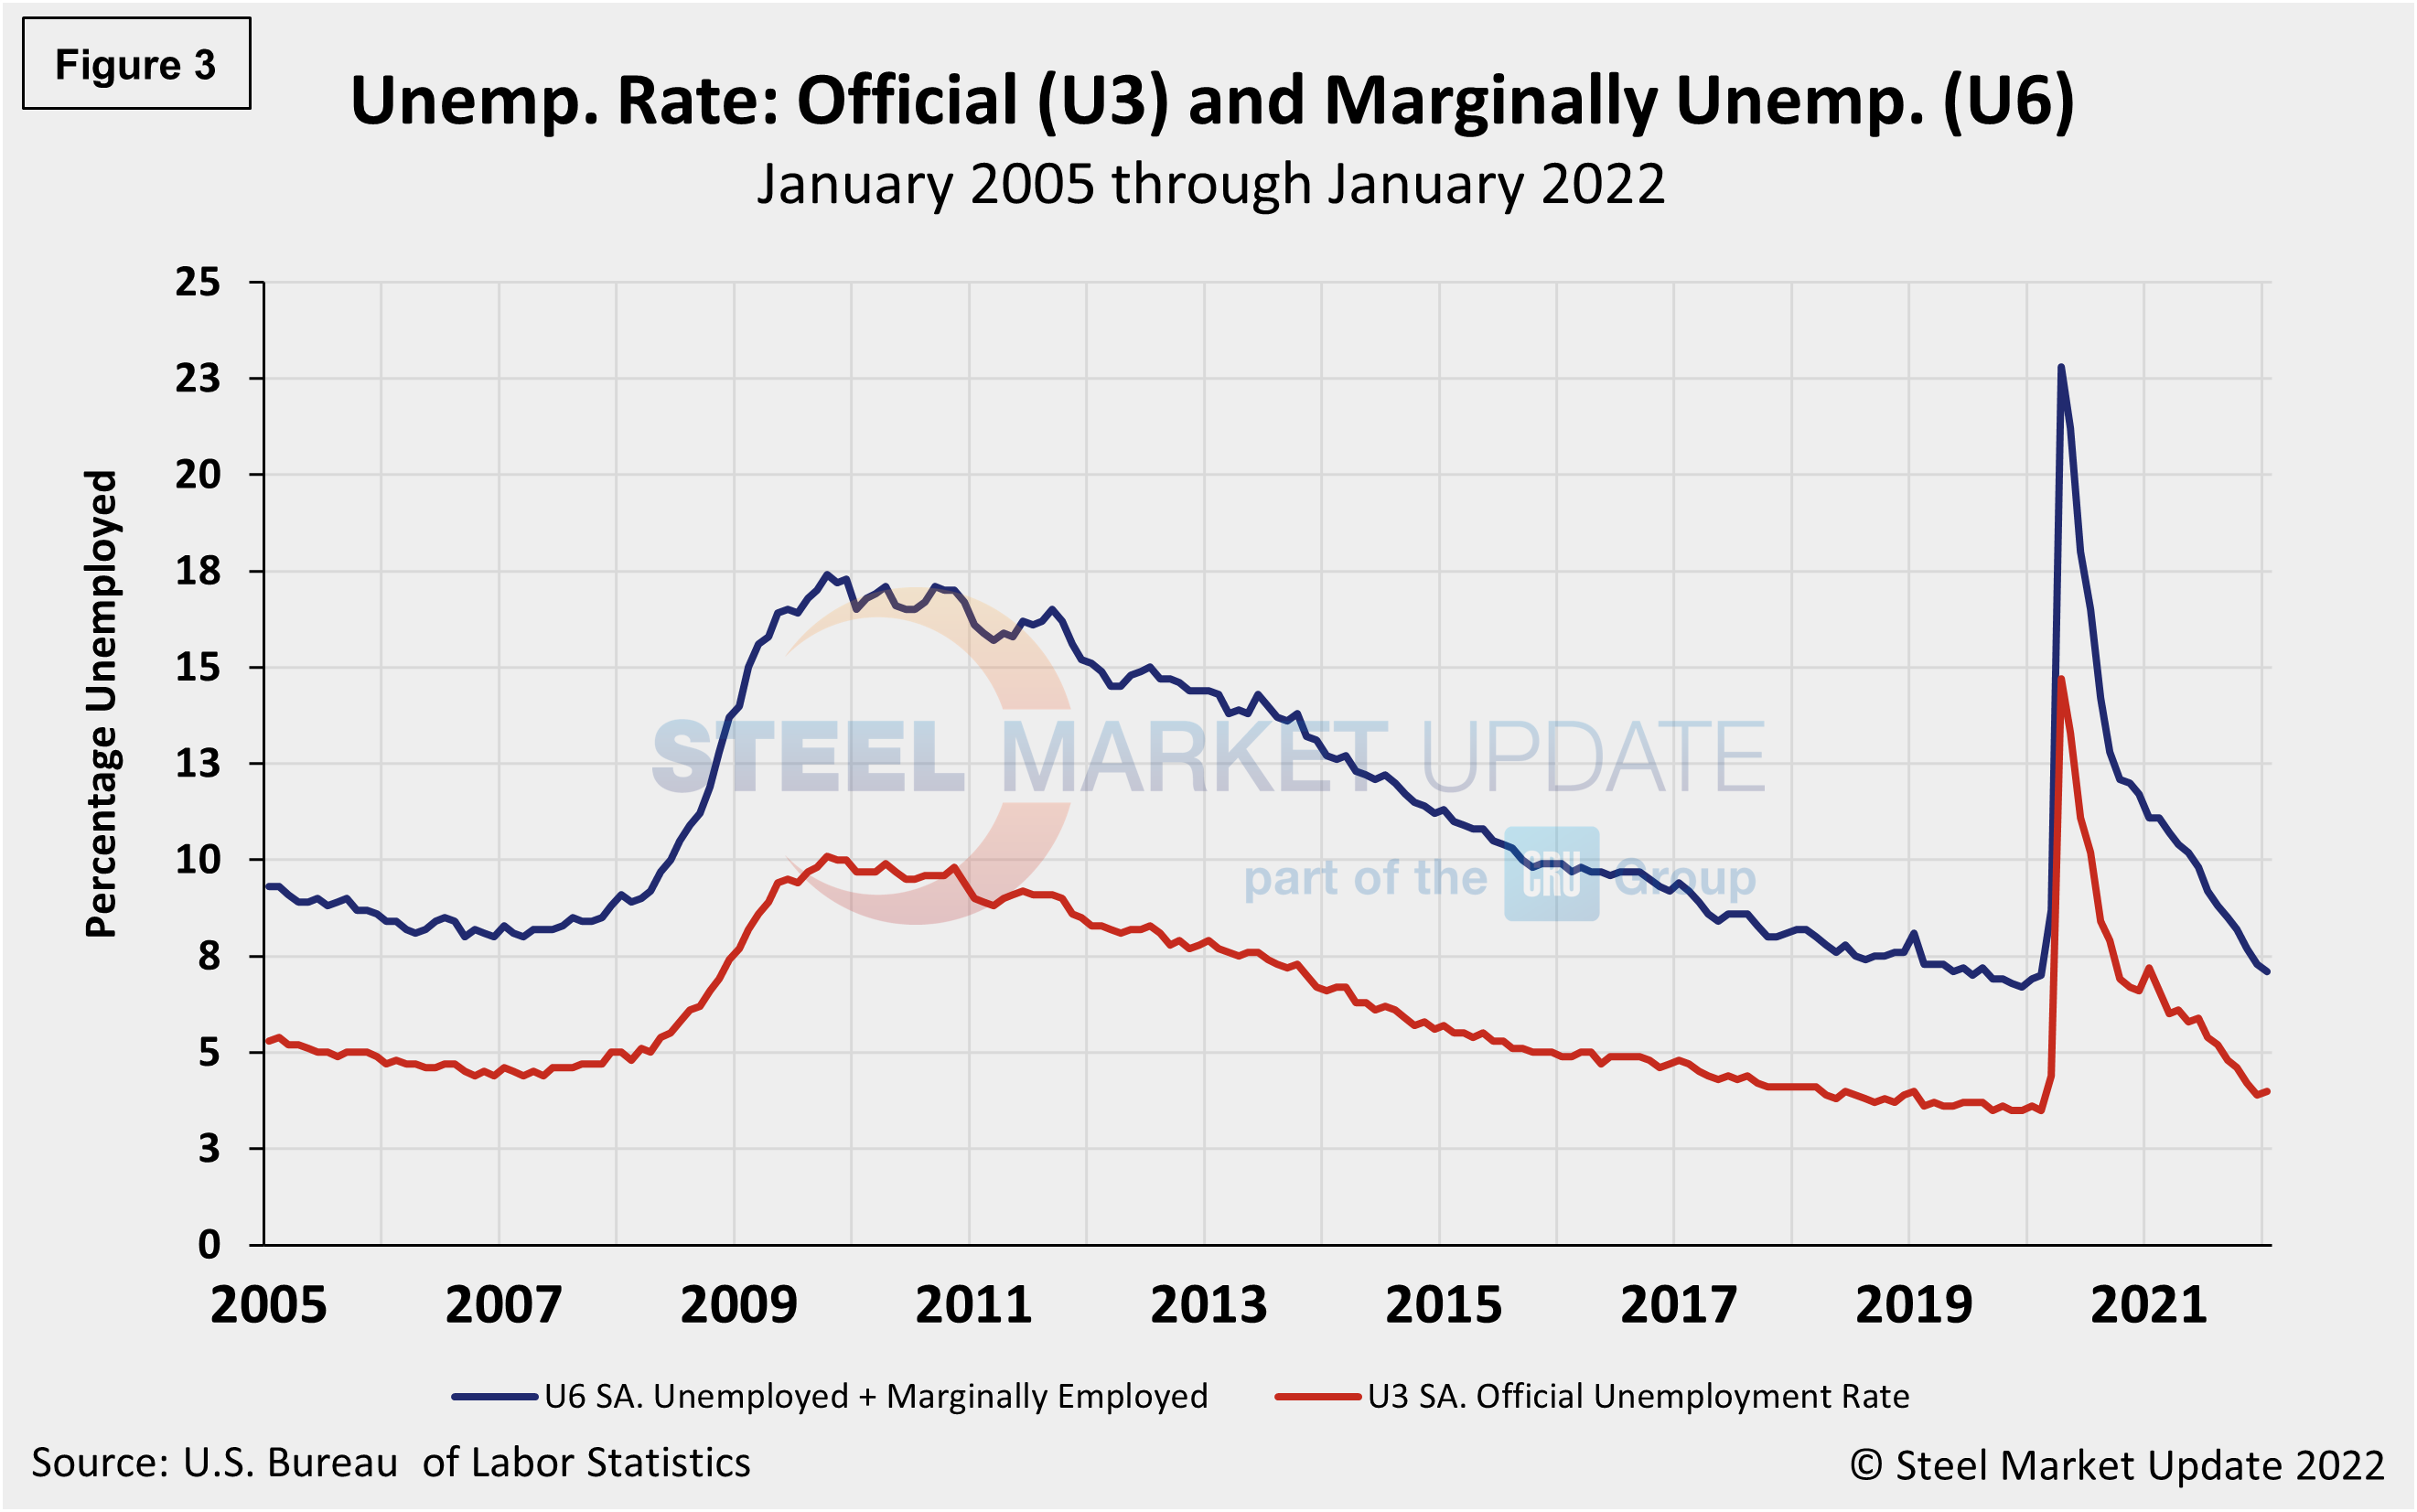
The official unemployment rate, U3, reported in the BLS Household survey (see explanation below) increased from 3.5% in February 2020 to 14.7% in April 2020. Since then, it had trended down at a slow pace, bottoming out at 3.9% in December. January’s increase to 4.0% marked the first gain in 21 months. U6, a more encompassing measure of unemployment that includes discouraged workers and those holding part-time jobs for economic reasons, dropped in January to 7.1% from 7.3% (Figure 3).
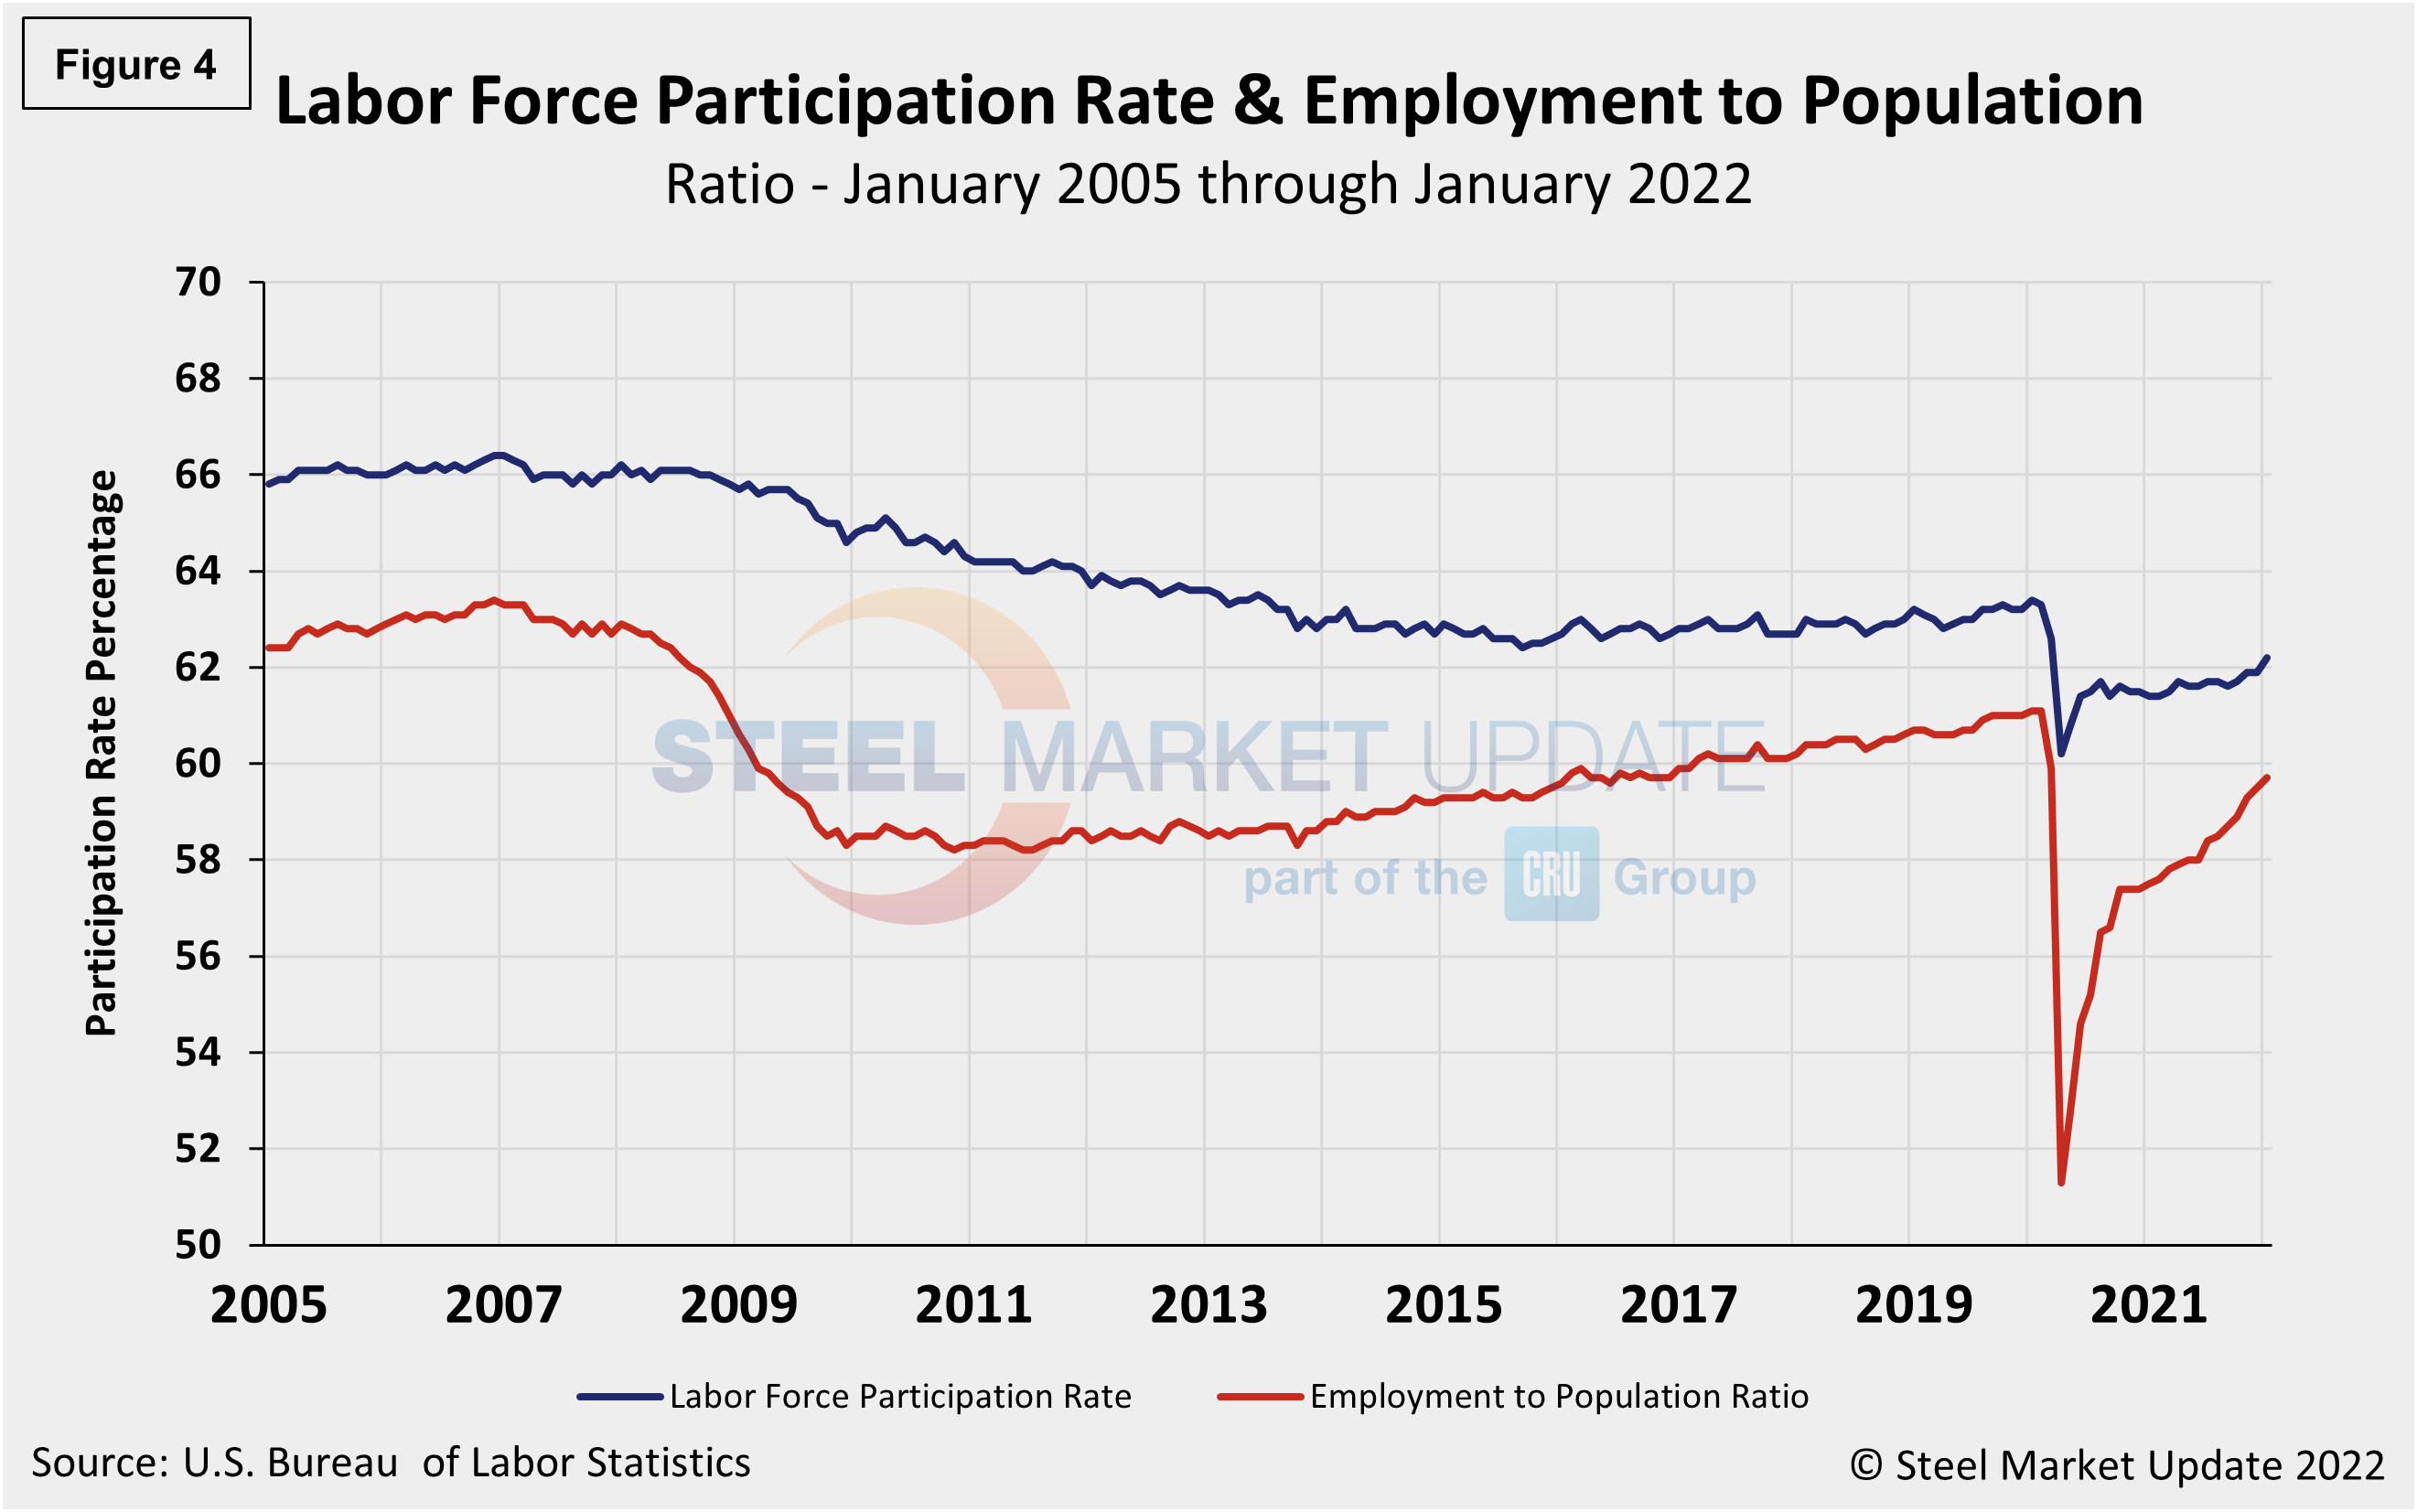
Another gauge, and more definitive view, are the number employed as a percentage of the population. Last month, the employment-to-population ratio was 59.7%, a marginal increase from December when the ratio was 59.5%, highlighting the challenges many companies continue to report in filling openings. Figure 4 shows both measures on one graph.
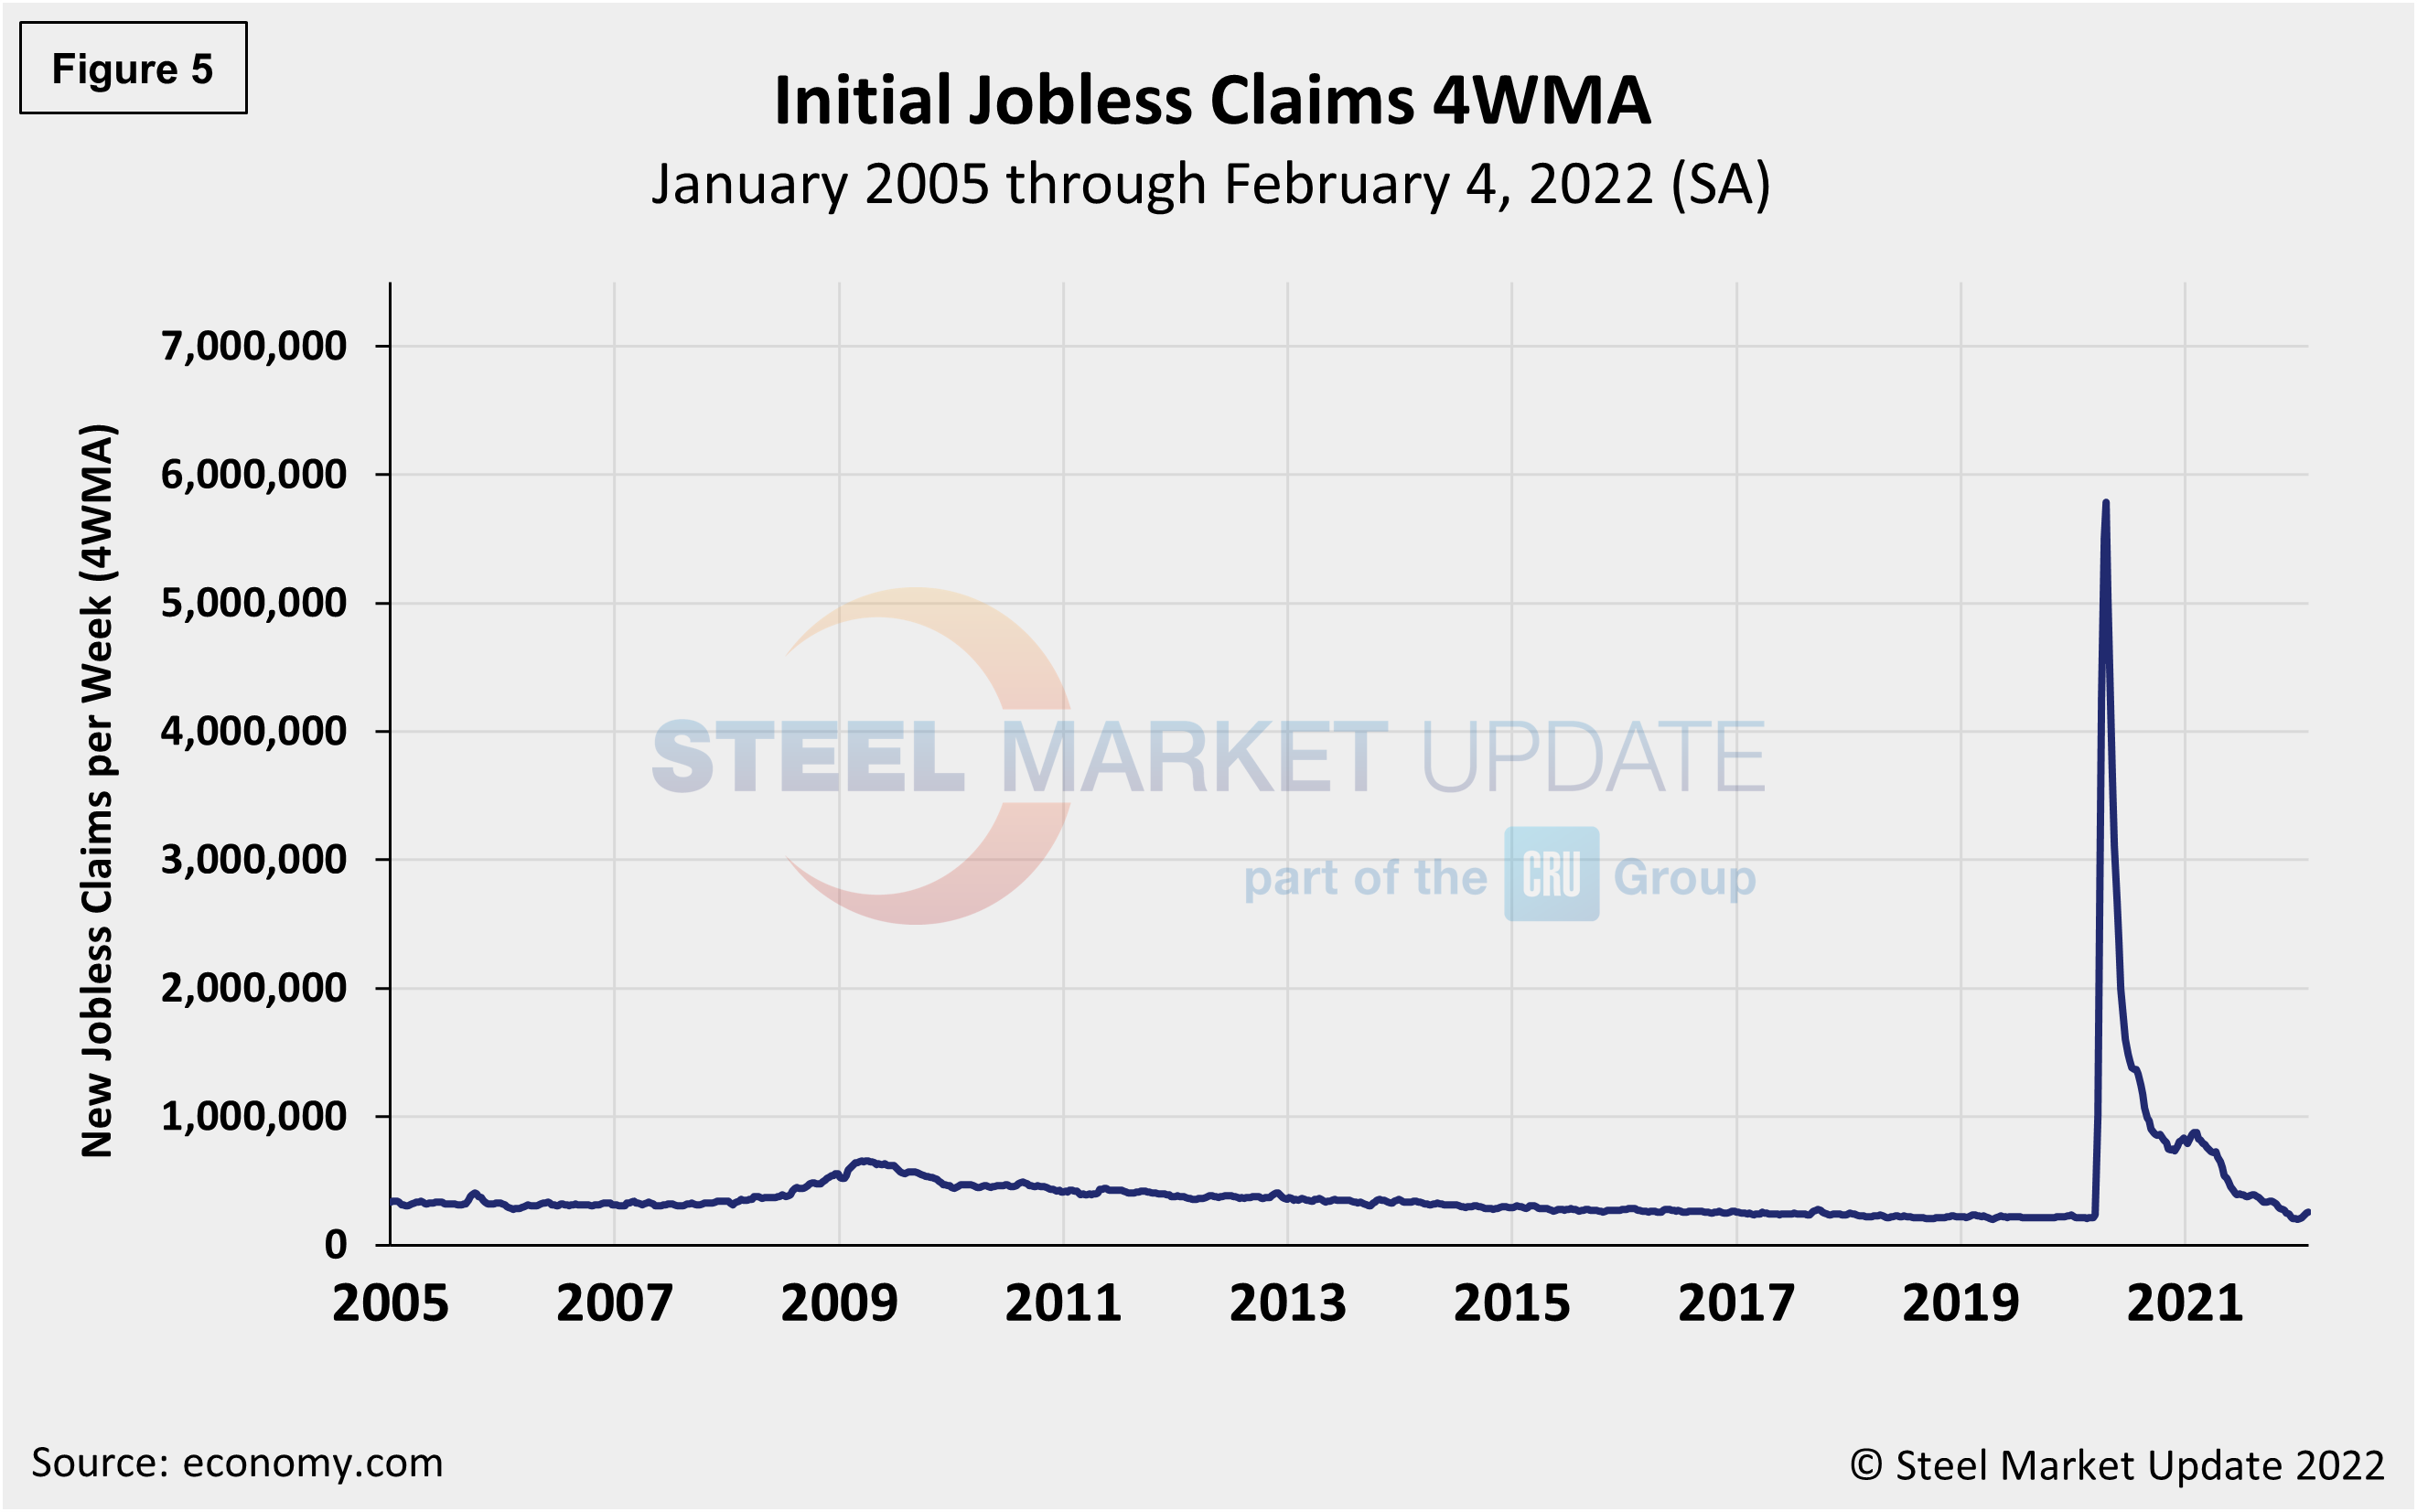
Initial claims for unemployment insurance, which are reported weekly by the Department of Labor, fell by 22,000 to 238,000 in the week ended Feb. 4, following a 26,000 decrease the week prior. Unemployment claims expanded by 88,000 for the first three weeks of January as the country grappled with the Omicron virus.
“The Omicron variant’s grip on the U.S. labor market is loosening, and job growth should reaccelerate. Initial claims for unemployment insurance benefits dropped by 23,000 to 238,000 in the week ended Jan. 29,” reported Economy.com. “The improvement beat our forecast for new filings to fall to 245,000. The four-week moving average edged higher, from 247,250 to 255,000, in the week ended Jan. 29. Continuing claims for unemployment insurance benefits fell 44,000 to 1.628 million in the week ended Jan. 22. The insured unemployment rate remained at 1.2% for the third consecutive week.”
The recent change in initial claims continues to underscore the struggles and inconsistencies facing the labor market. Figure 5 shows the four-week moving average of new claims since January 2005, seasonally adjusted.
Human resources consulting firm Challenger, Gray and Christmas, Inc., produces a monthly employment update for the U.S. It reported that job cuts in January were virtually the same as in December with 19,064, up slightly from the 19,052 announced the prior month. January’s total is 76% lower than the same year-ago period when 79,552 cuts were announced. Figure 6 shows the monthly job cuts reported by Challenger on a 3MMA basis since January 2007.
According to Challenger, COVID continues to influence numbers. Of cuts announced in January, 5,757 cuts were due to companies shedding workers who refused to get vaccinated against the coronavirus. That brings the total number of cuts due to vaccine refusal to 13,391 since June 2021, when Challenger first recorded job cuts for this reason.
“Many employers who implemented vaccine policies last year gave workers until early January to comply,” said Challenger. “Job cuts remain low, and companies are still hard-pressed to fill open positions. This is a lot of people to cut, particularly in Health Care, where workers are increasingly leaving while those who remain battle intensifying burnout.”
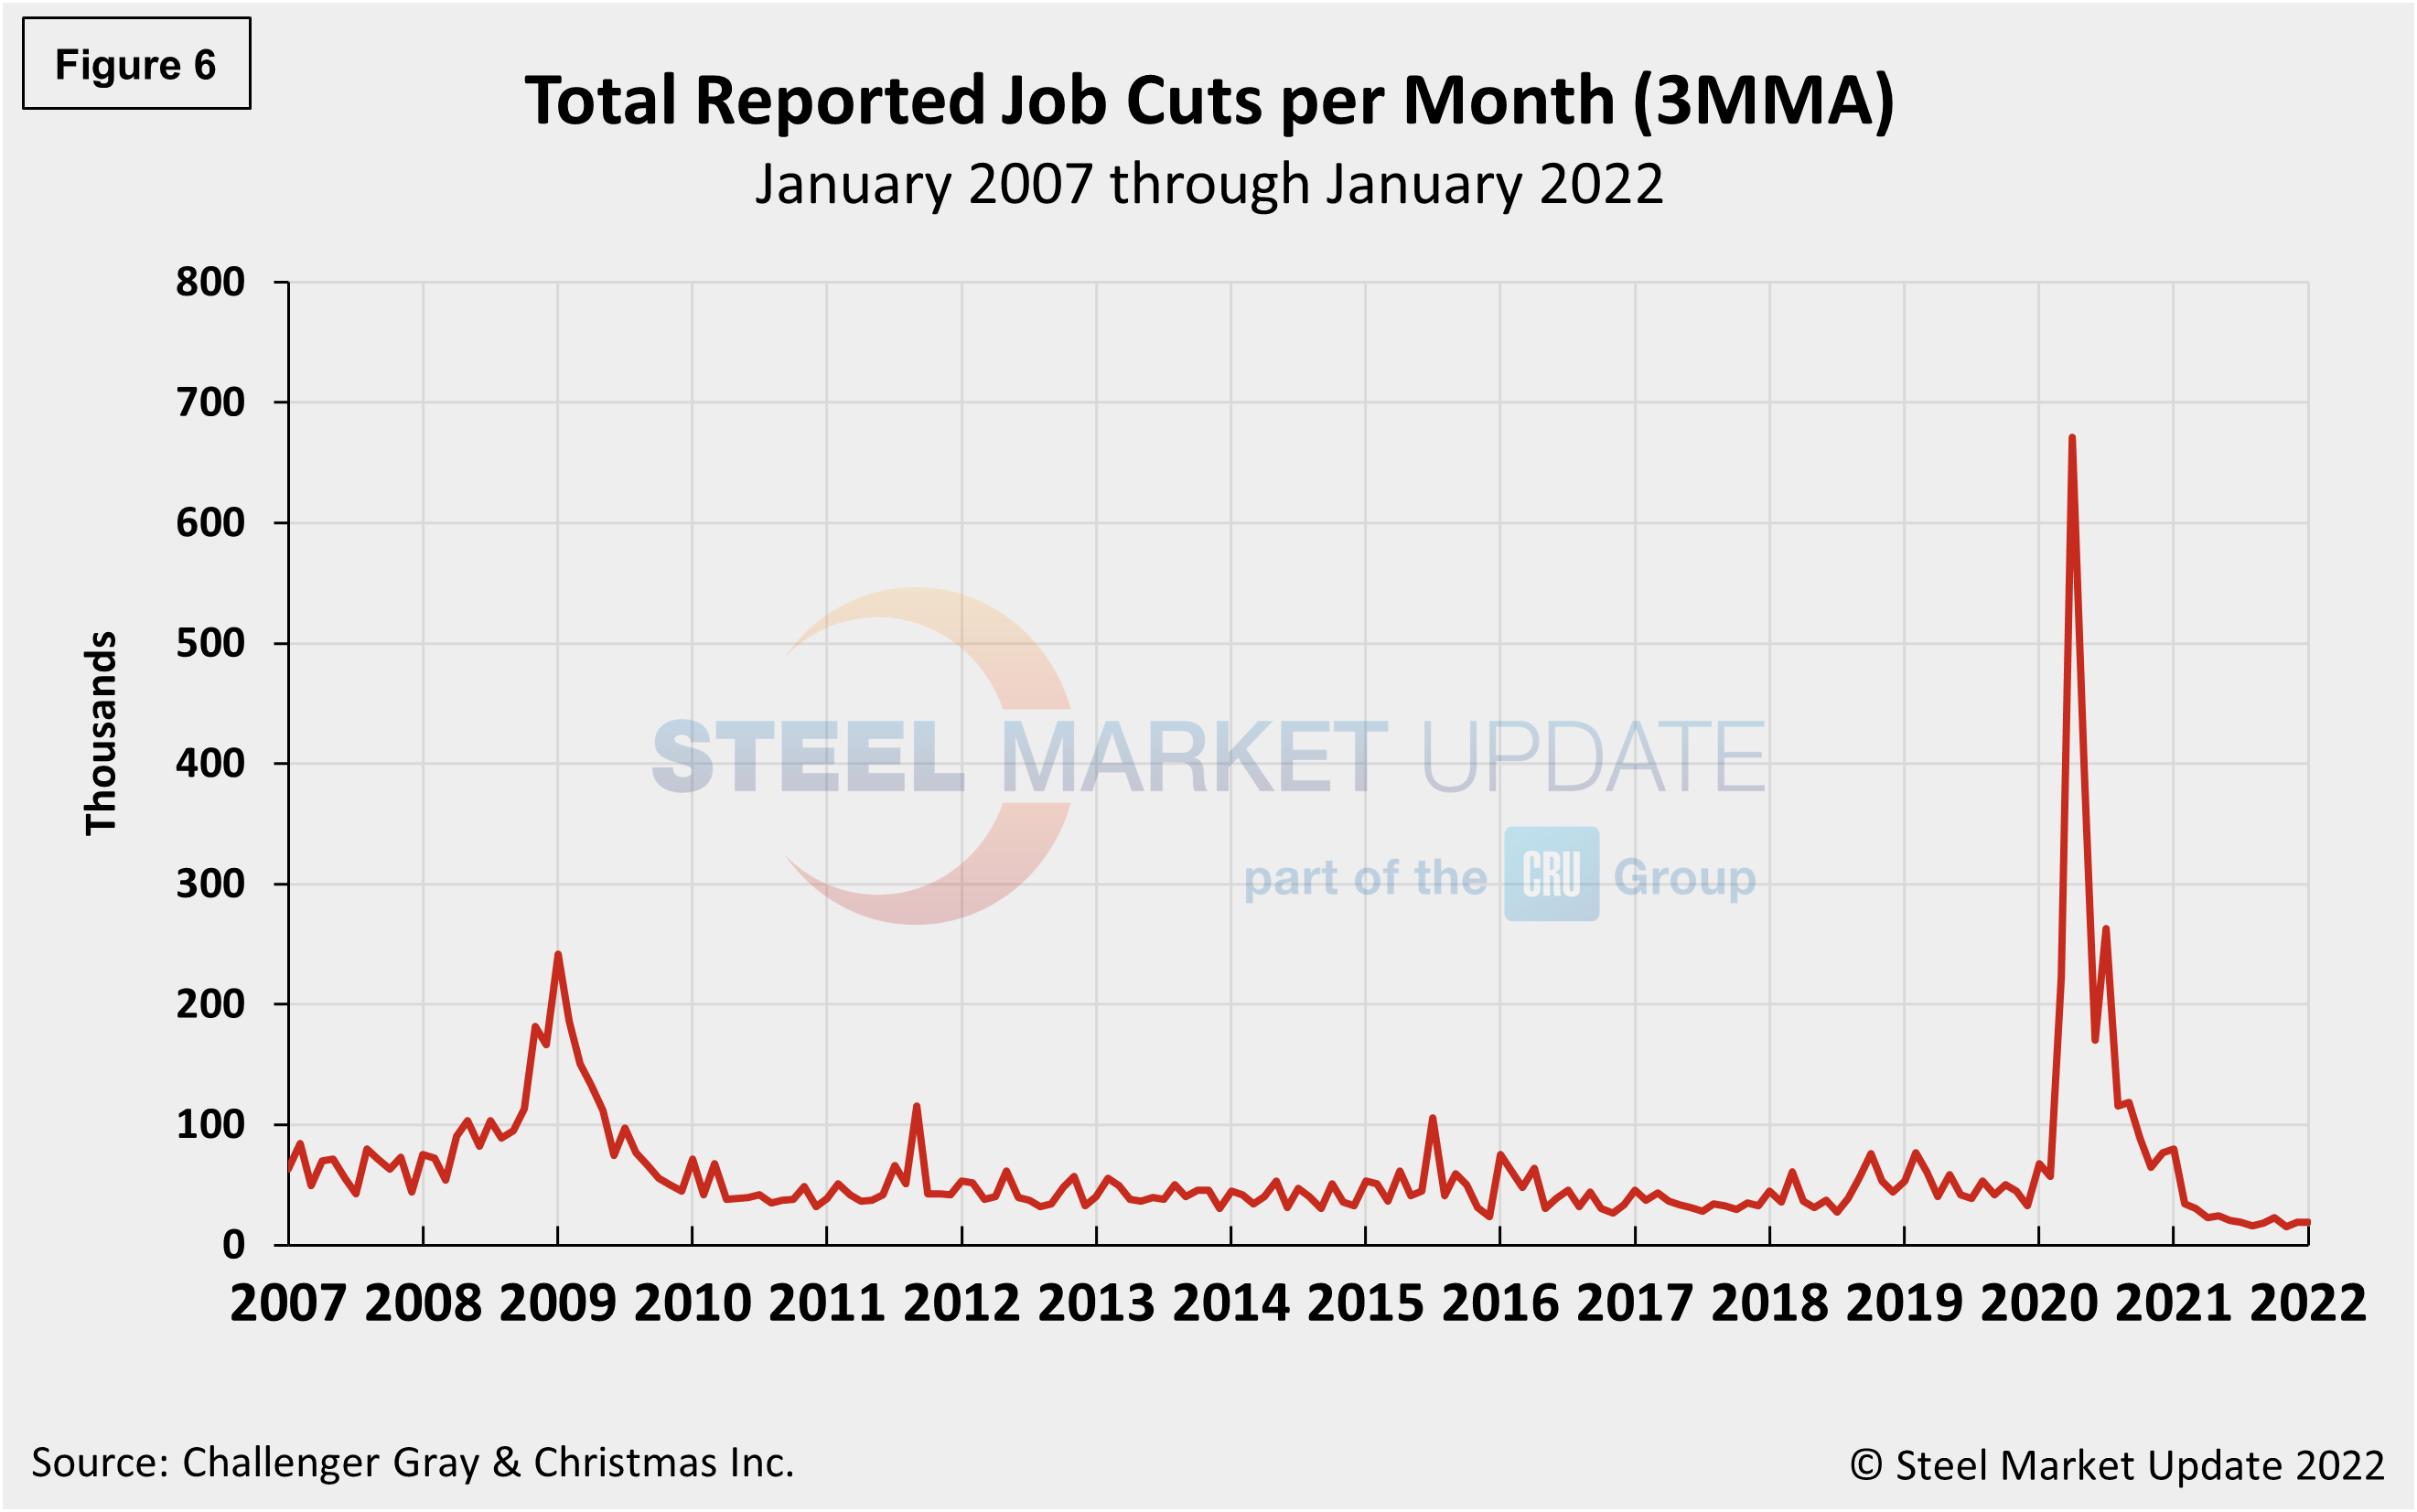
“While the country undergoes this COVID wave spurred by Omicron, employers are attempting to keep their workers, and in fact, hire more,” added Challenger.
In January, companies announced plans to hire 77,630 workers, the highest January total since 2017, when 136,501 hiring plans were recorded, the report noted.
“Omicron likely slowed the numbers of jobs added in January. Though the Supreme Court decision on the OSHA rule potentially removed a hurdle to hiring, the amount of work companies, particularly Human Resources and Talent Acquisition departments, are undergoing to create and implement their own policies; attract, retain, and onboard workers; comply with the patchwork of COVID guidelines; and grapple with illnesses, will slow hiring processes,” said Challenger.
Explanation: On the first Friday of each month, the Bureau of Labor Statistics releases the employment data for the previous month. Data is available at www.bls.gov. The BLS reports on the results of two surveys. The Establishment survey reports the actual number employed by industry. The Household survey reports on the unemployment rate, participation rate, earnings, average workweek, the breakout into full-time and part-time workers and lots more details describing the age breakdown of the unemployed, reasons for and duration of unemployment.
By David Schollaert, David@SteelMarketUpdate.com


