

Analysis

February 9, 2022
North American Auto Assemblies Rebound in January
Written by David Schollaert
North American auto assemblies expanded in January after falling to 2021’s second lowest monthly total in December. January’s production total was up 12.6% sequentially, but down 4.1% from the same month last year.
Supply-chain and microchip limitations continue to impact the automotive sector despite broad production improvements across North American automakers. As a result, assembly totals are still well behind pre-pandemic totals.
North American vehicle production, including personal and commercial vehicles, totaled 1.101 million units in January, up from 977,654 units in December, but down from 1.146 million in January 2021.
Though much of what crippled automakers in 2021 has passed, semiconductor availability and supply-chain disruptions are expected to delay carmaking for much of the first half of 2022. February’s totals should also be impacted by the border protests over the vaccine mandate that halted traffic at North America’s busiest international crossing, the Ambassador Bridge, for nearly a week.
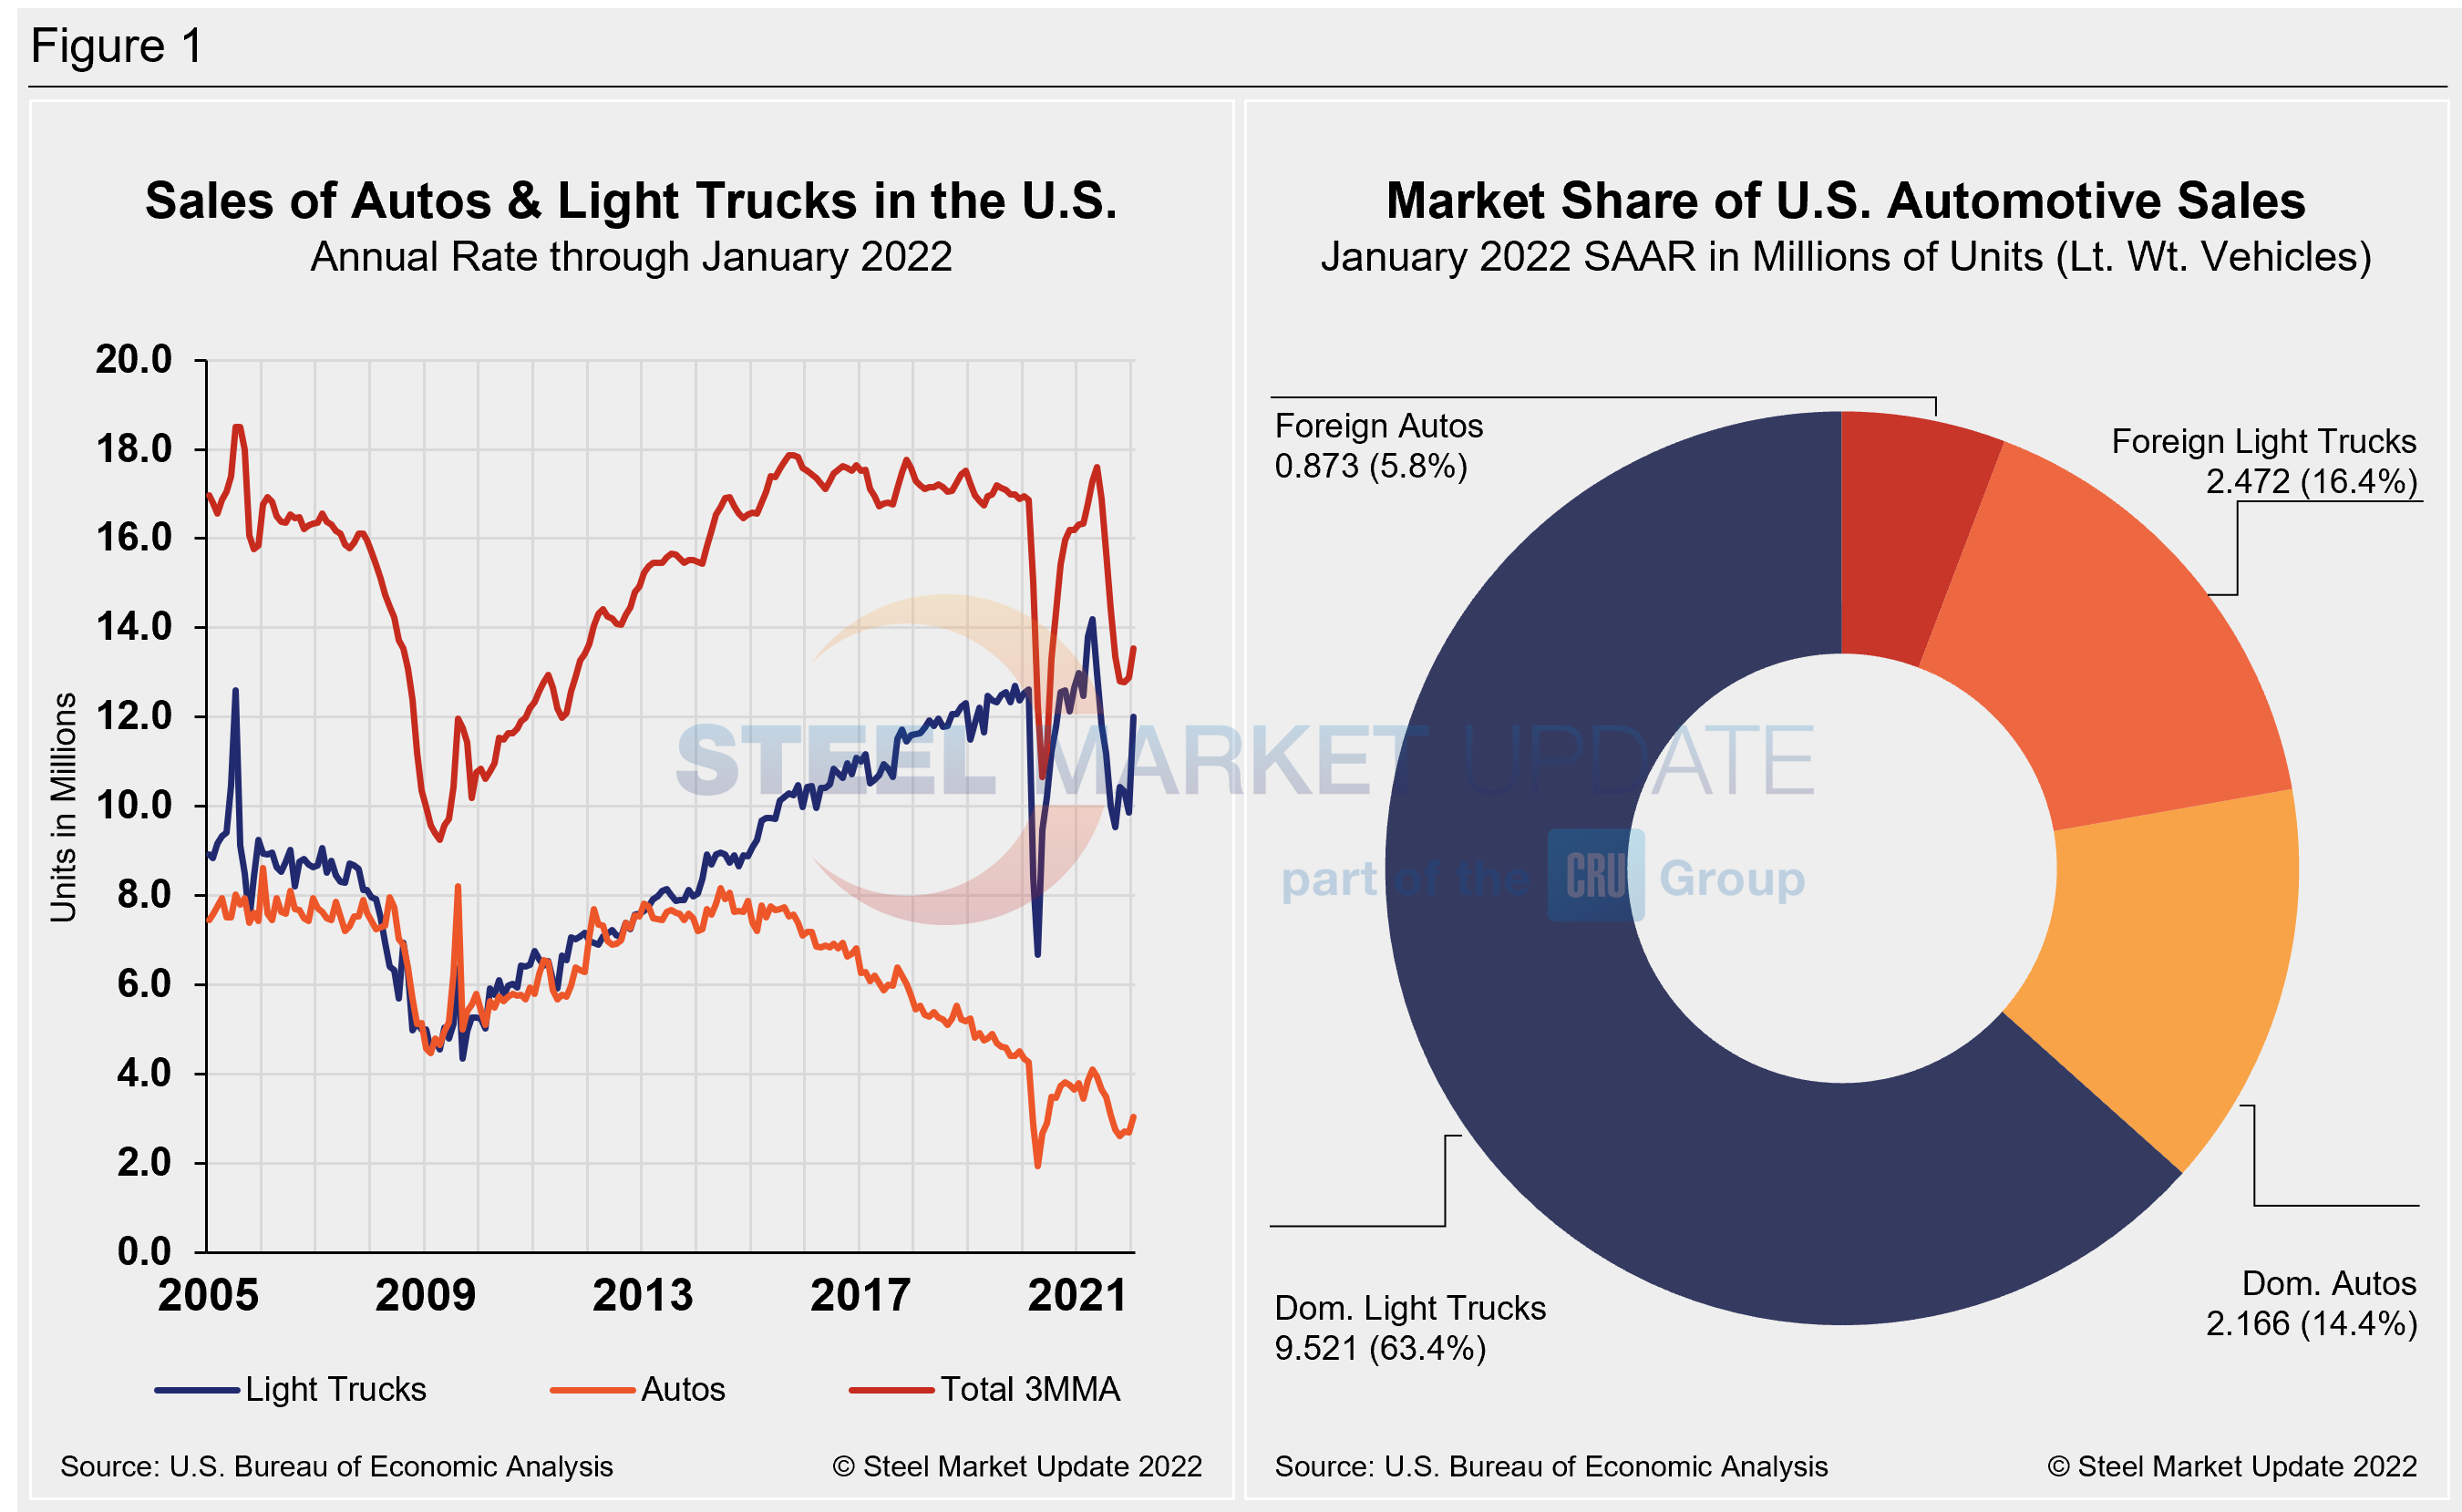
The result, vehicle inventories should remain at historically low levels, further impacting sales and suppressing light vehicle demand in North America, according to LMC Automotive (LMCA). Although sales were held back chiefly by supply-side issues, rising transaction prices – now topping an average of $47,000 per vehicle – are scaring away potential buyers. Incentives were at a five-year low in January, below $1,500 on average.
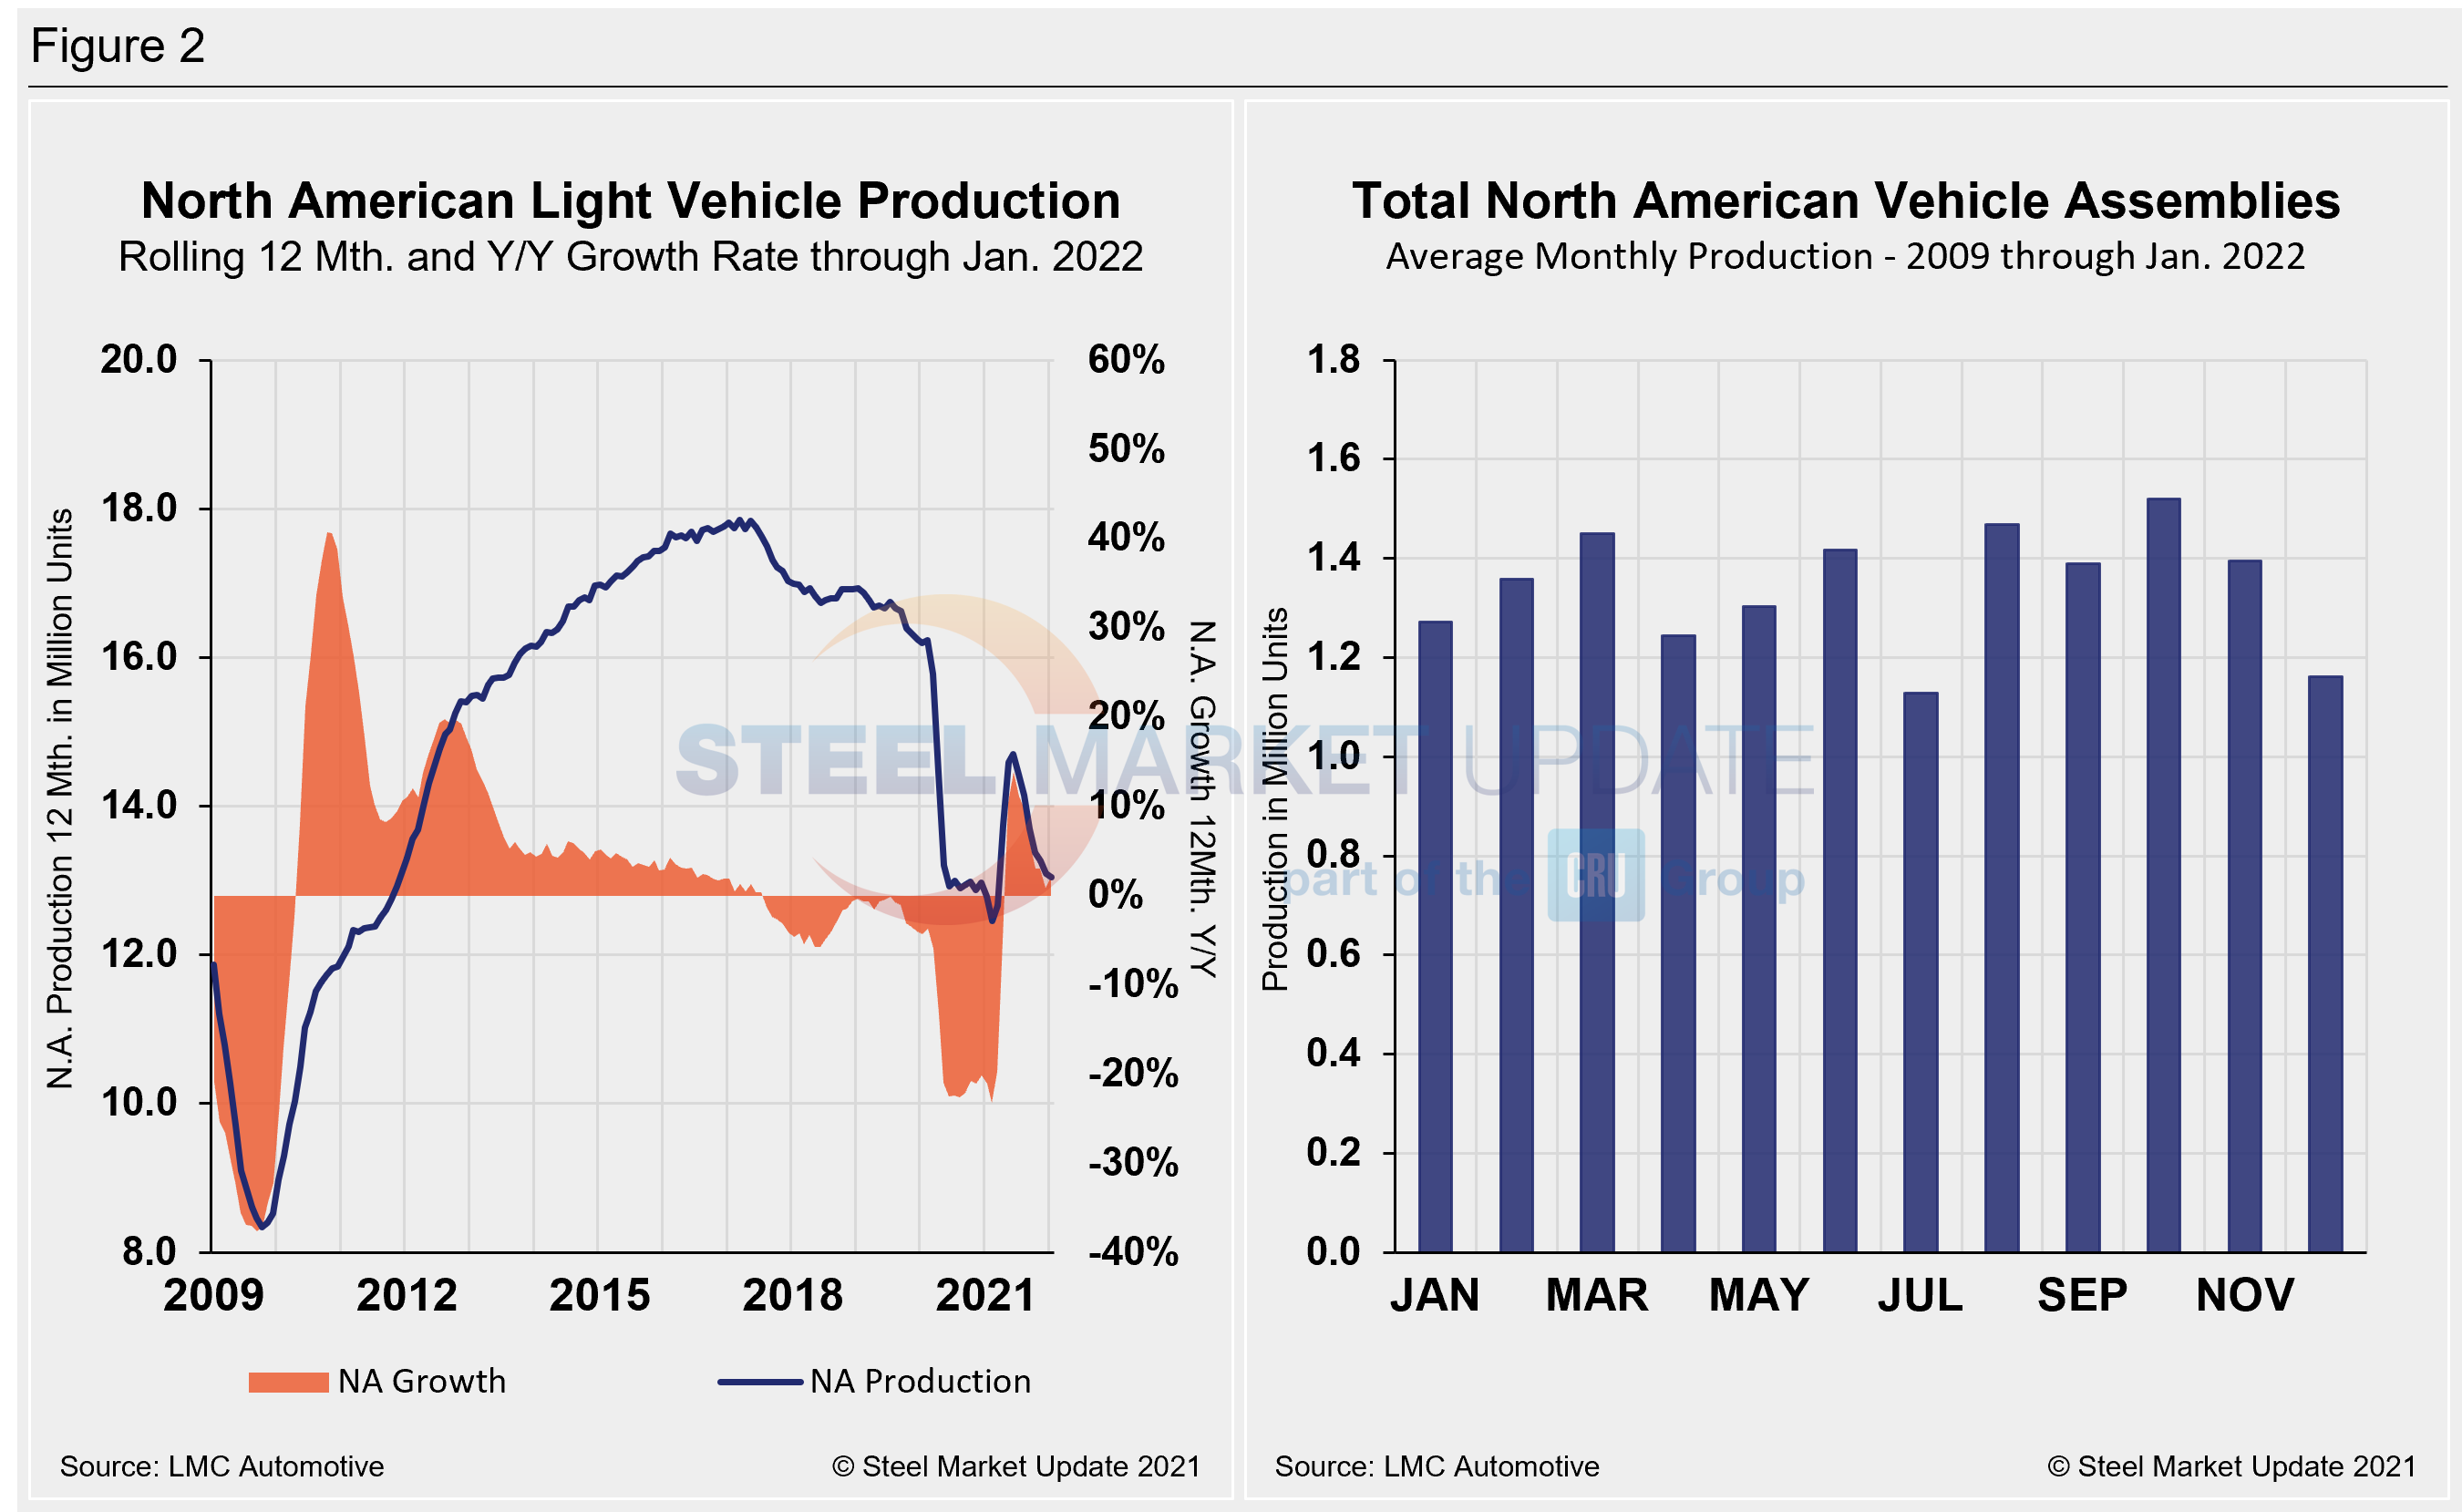
Below in Figure 1 is the long-term picture of sales of autos and lightweight trucks in the U.S. from 2005 through January 2022, as well as the market share breakdown of sales last month, which hit a seasonally adjusted annual rate of 15.042 million units. Figure 2 details the North American light vehicle production since 2009 on rolling 12-month and year-over-year growth rate, as well as the average monthly production, including seasonality, over the same period.
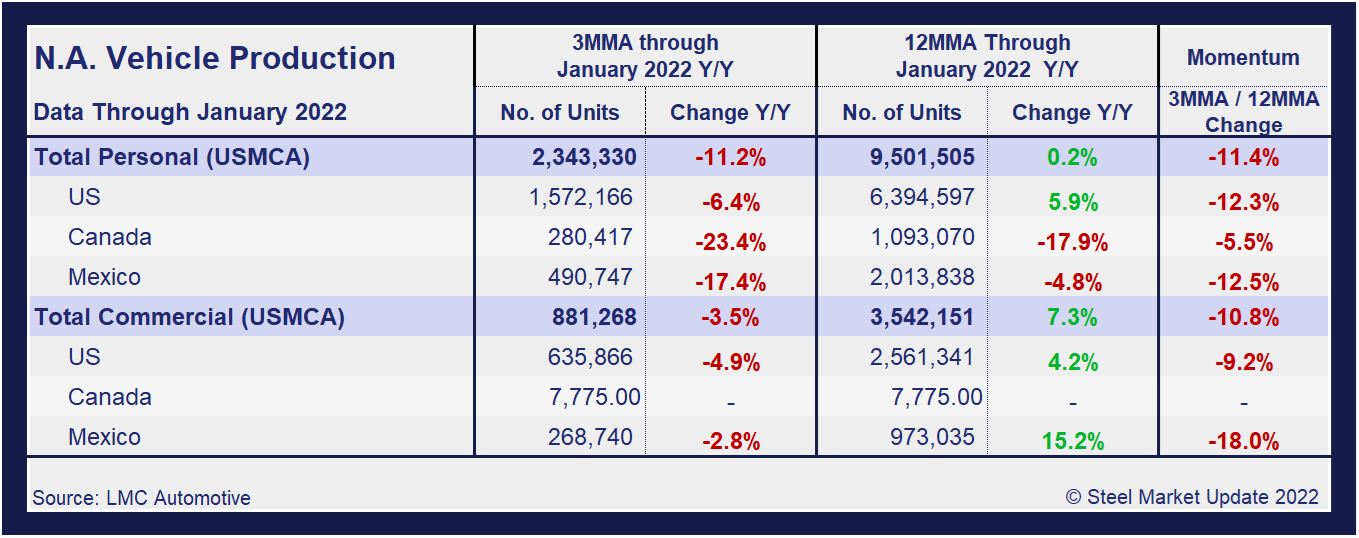
A short-term snapshot of assembly by nation and vehicle type is shown in the table below. It breaks down total North American personal and commercial vehicle production into the U.S, Canadian and Mexican components, along with the three- and 12-month growth rate for each. At the far right it shows the momentum for the total and for each of the three nations.
Although the initial rebound from the COVID-19 doldrums was impressive, the effect of the chip shortage has been even more damaging due to its prolonged nature. Through June, growth rates for personal and commercial light vehicles soared by 156.8% and 127.4%, respectively, but have since seen a nosedive as the chip shortage and supply-chain disruptions have continued.
In three months through January, the growth rate for total personal vehicle assemblies in the USMCA was -11.2% year over year, but a noticeable improvement from -20.0% month on month. Commercial light vehicle assemblies were -3.5% and -2.9% over the same period. The impact of the global semiconductor chip shortage on automotive production across North America has been devastating.
Personal Vehicle Production
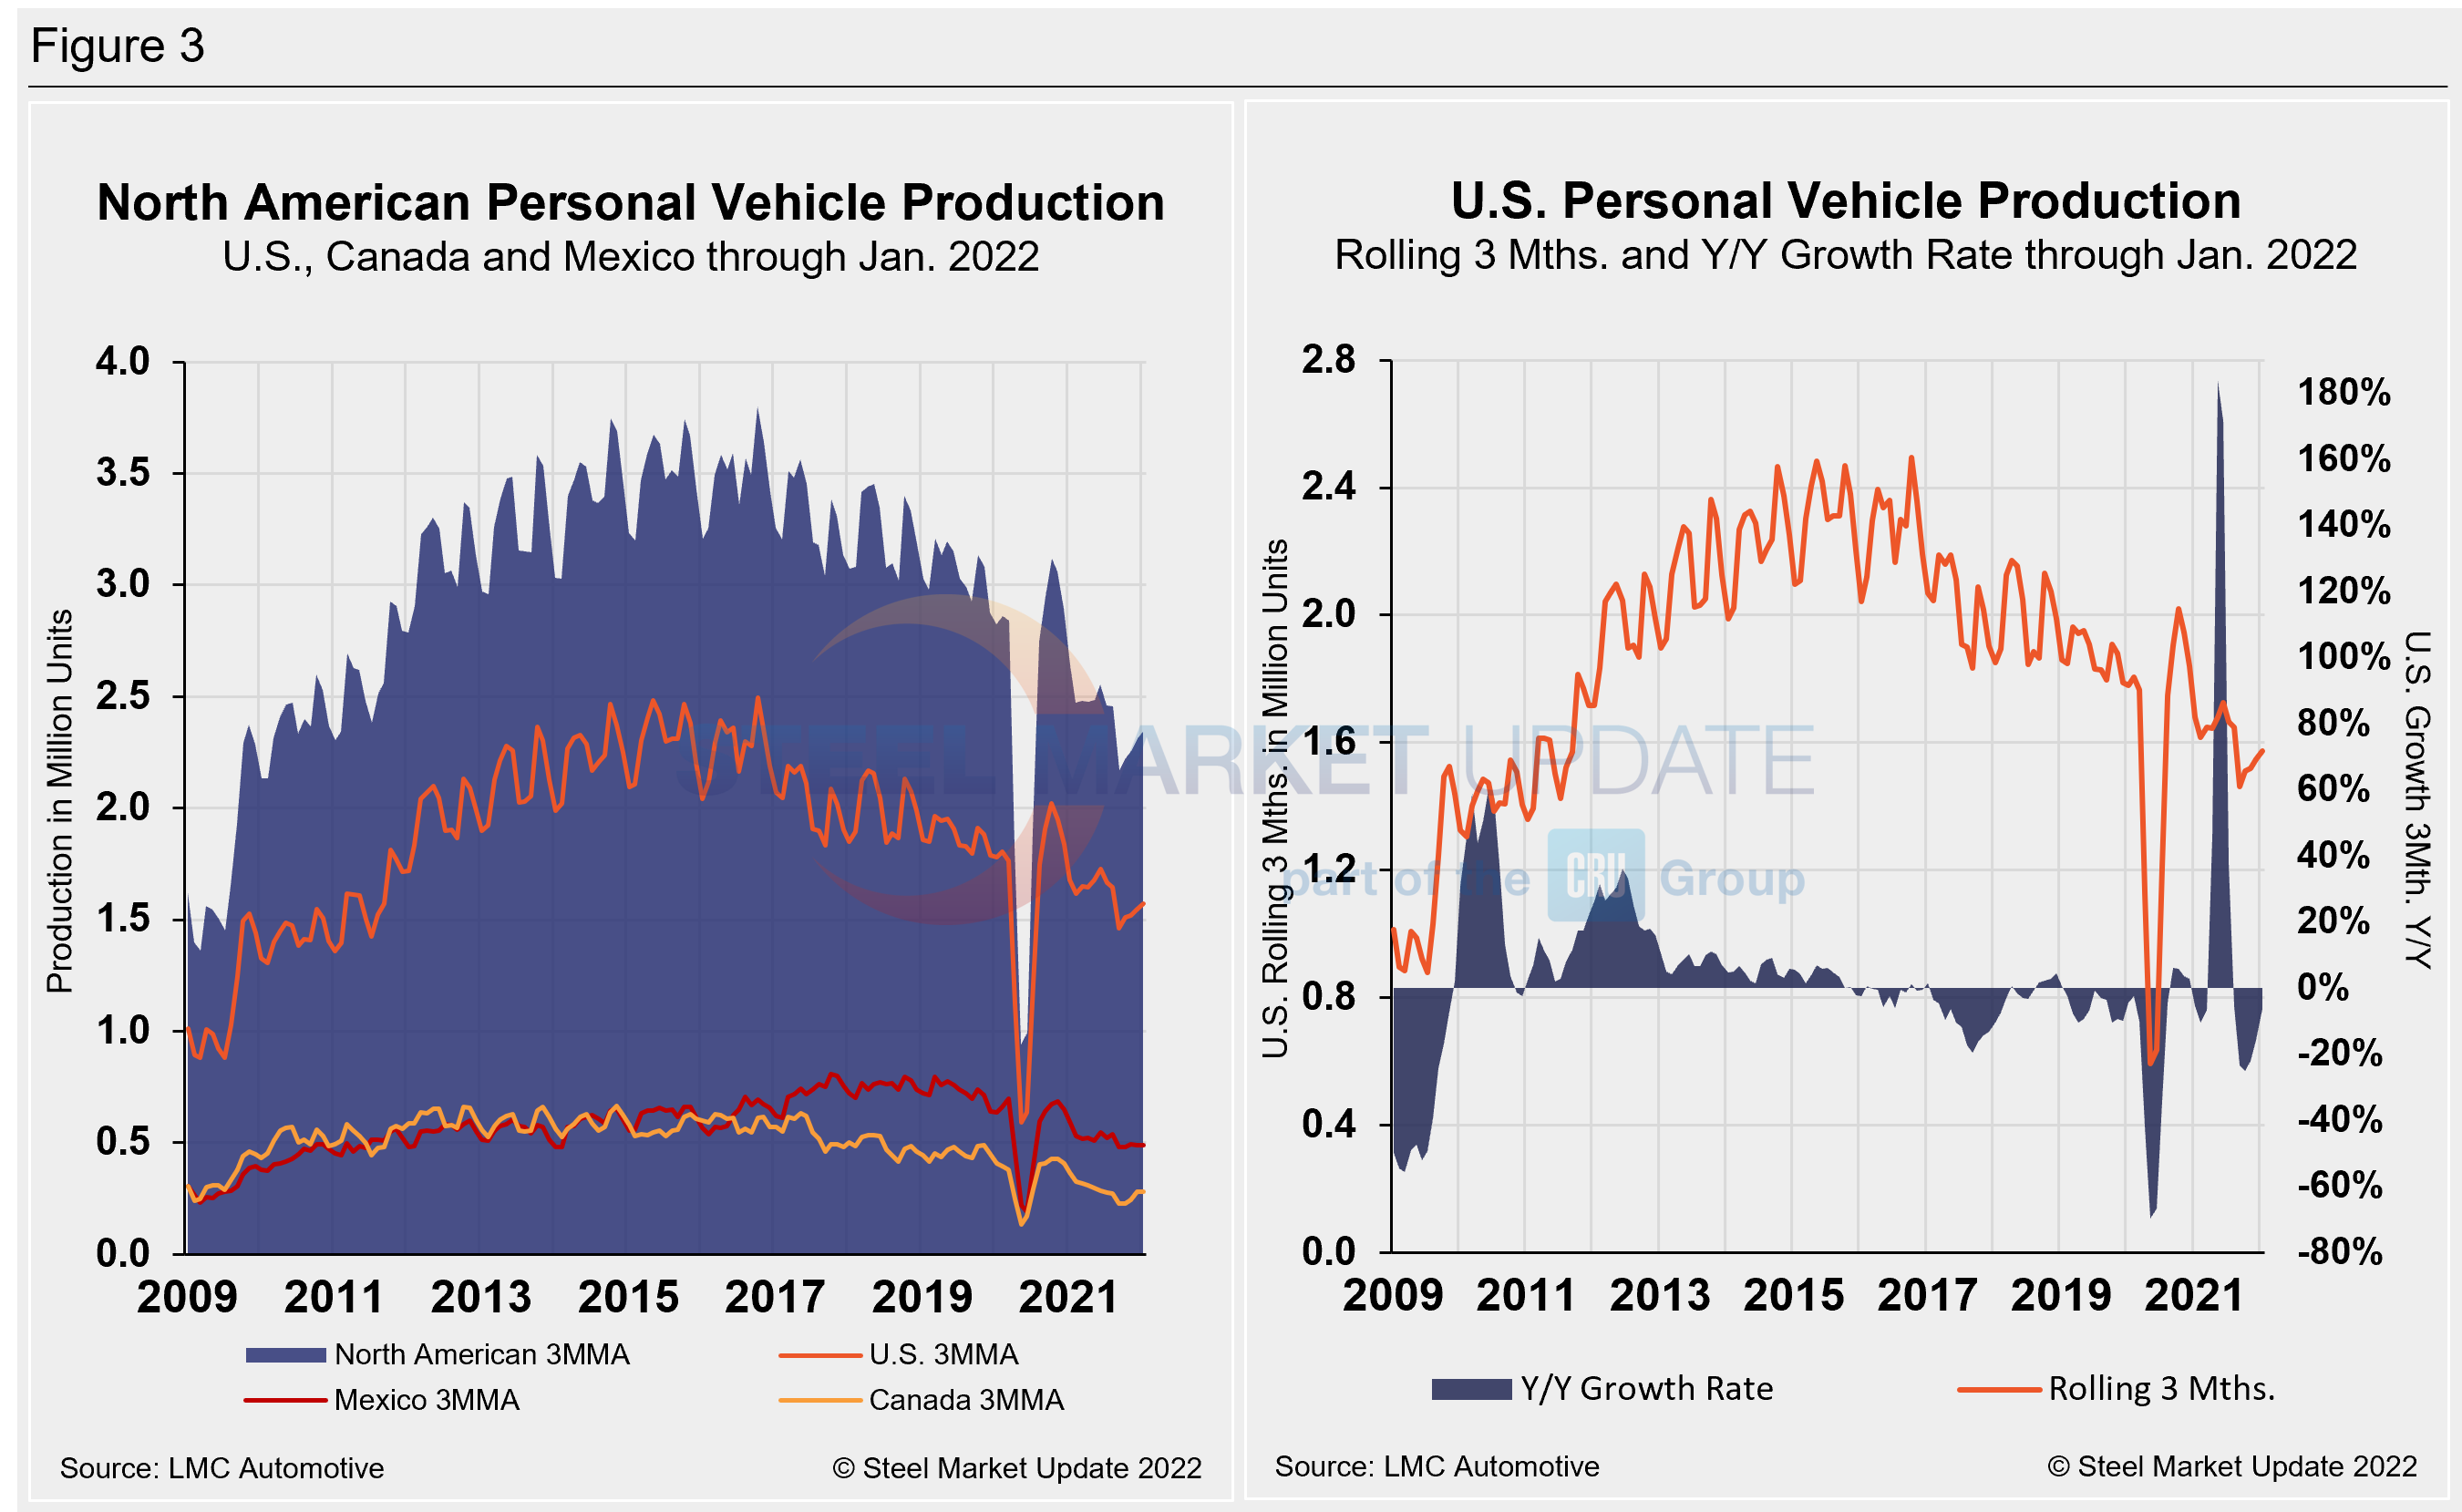
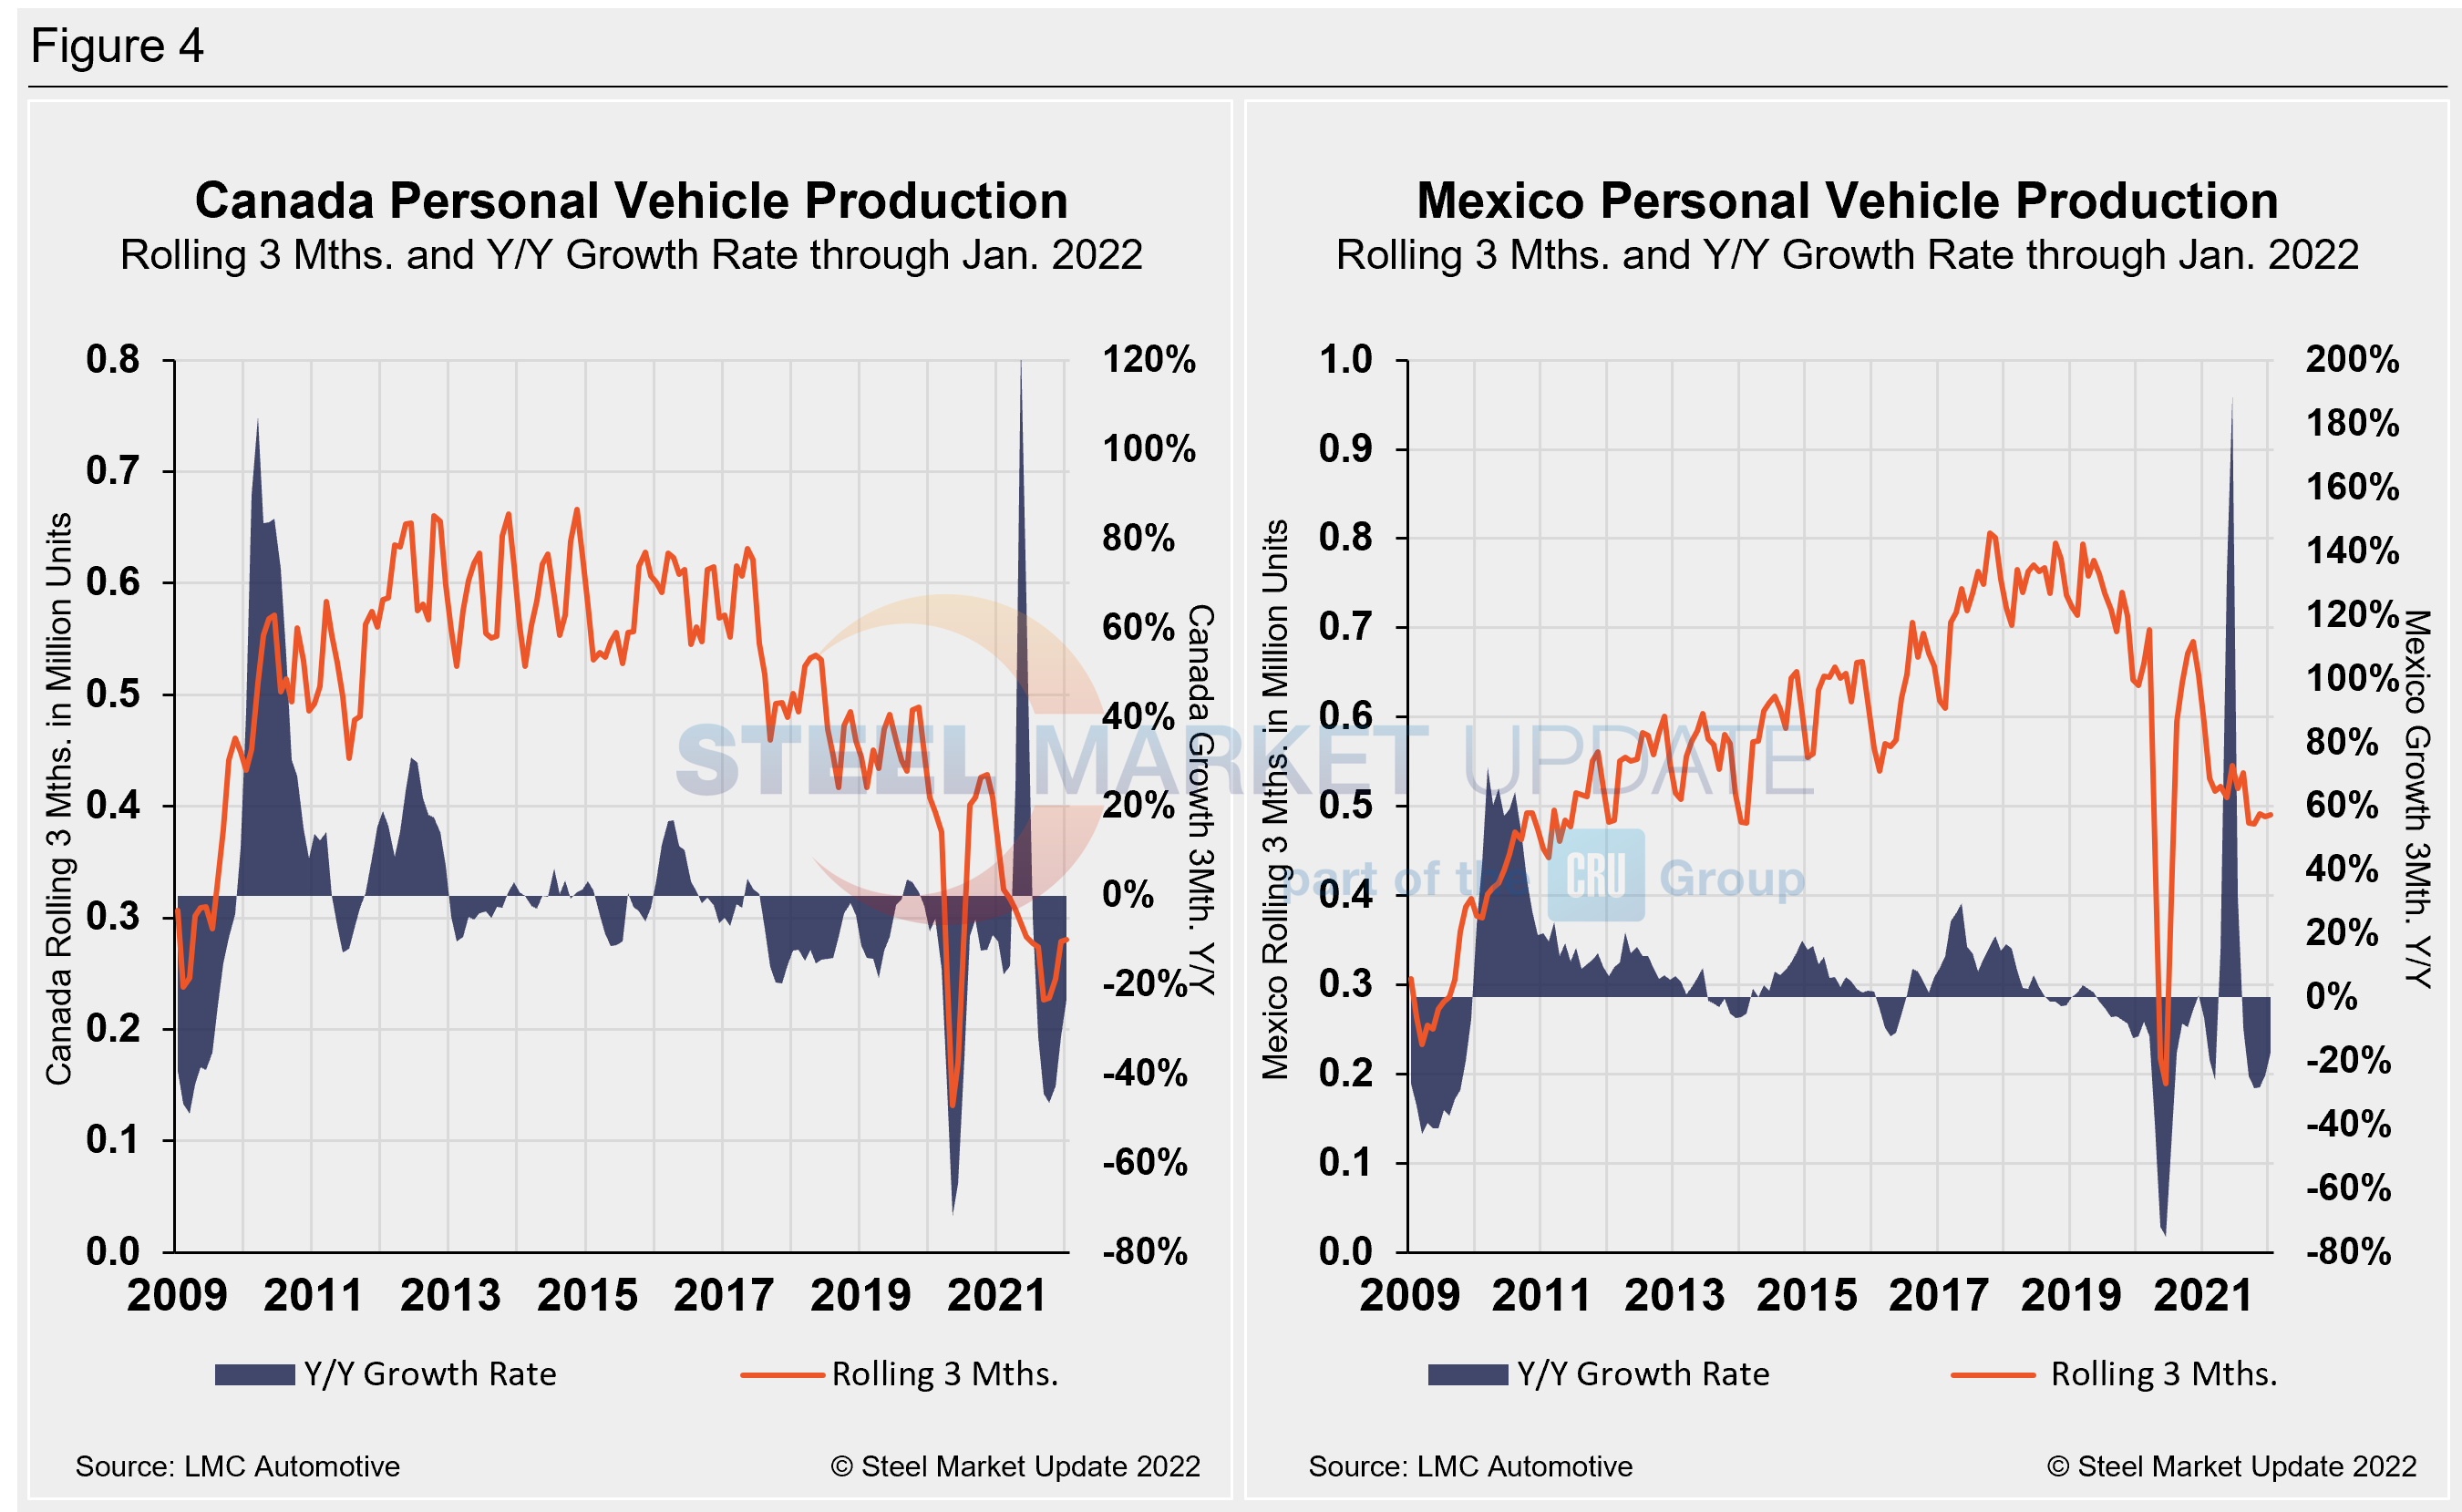
The longer-term picture on personal vehicle production across North America is shown below. The first chart in Figure 3 shows the total personal vehicle production for North America and the total for each nation. The production of personal vehicles in the U.S. and the year-over-year growth rate is displayed in the second chart. Figure 4 shows side-by-side the production of personal vehicles in Canada and Mexico and the year-over-year growth rate.
In terms of personal vehicle production, U.S. and Mexico saw gains in January, while Canada dipped slightly. The rebound from December is not entirely surprising, given the holiday work stoppages during the month coupled with ongoing supply-chain limitations. Canada’s decline could dip further in February due to the work stoppages resulting from the border protests.
Mexico saw the greatest percentage gain, up 24.7% or 34,338 more units when compared to the month prior. The U.S. saw the largest increase in total units, up 71,021 vehicles or 14.9% month on month. Canada auto assemblies were also 4.1% or 3,890 fewer units in January versus the prior month. The annual growth rate across the region in January rebounded from the significant loss the month prior. The U.S. saw the best gain at 9.4%, followed by Canada at 8.2% and Mexico at 7.2%. Overall, the region saw a boost of 101,469 units in January, a 14.4% increase over December’s total.
Canada’s personal vehicle production share of the North American market was unchanged month on month at 12.0% in January, while Mexico’s share slipped from 21.1% to 20.9%. The U.S. edged up to a 67.1% share of the North American market in January, a 0.2 percentage point increase versus the month prior.
Commercial Vehicle Production
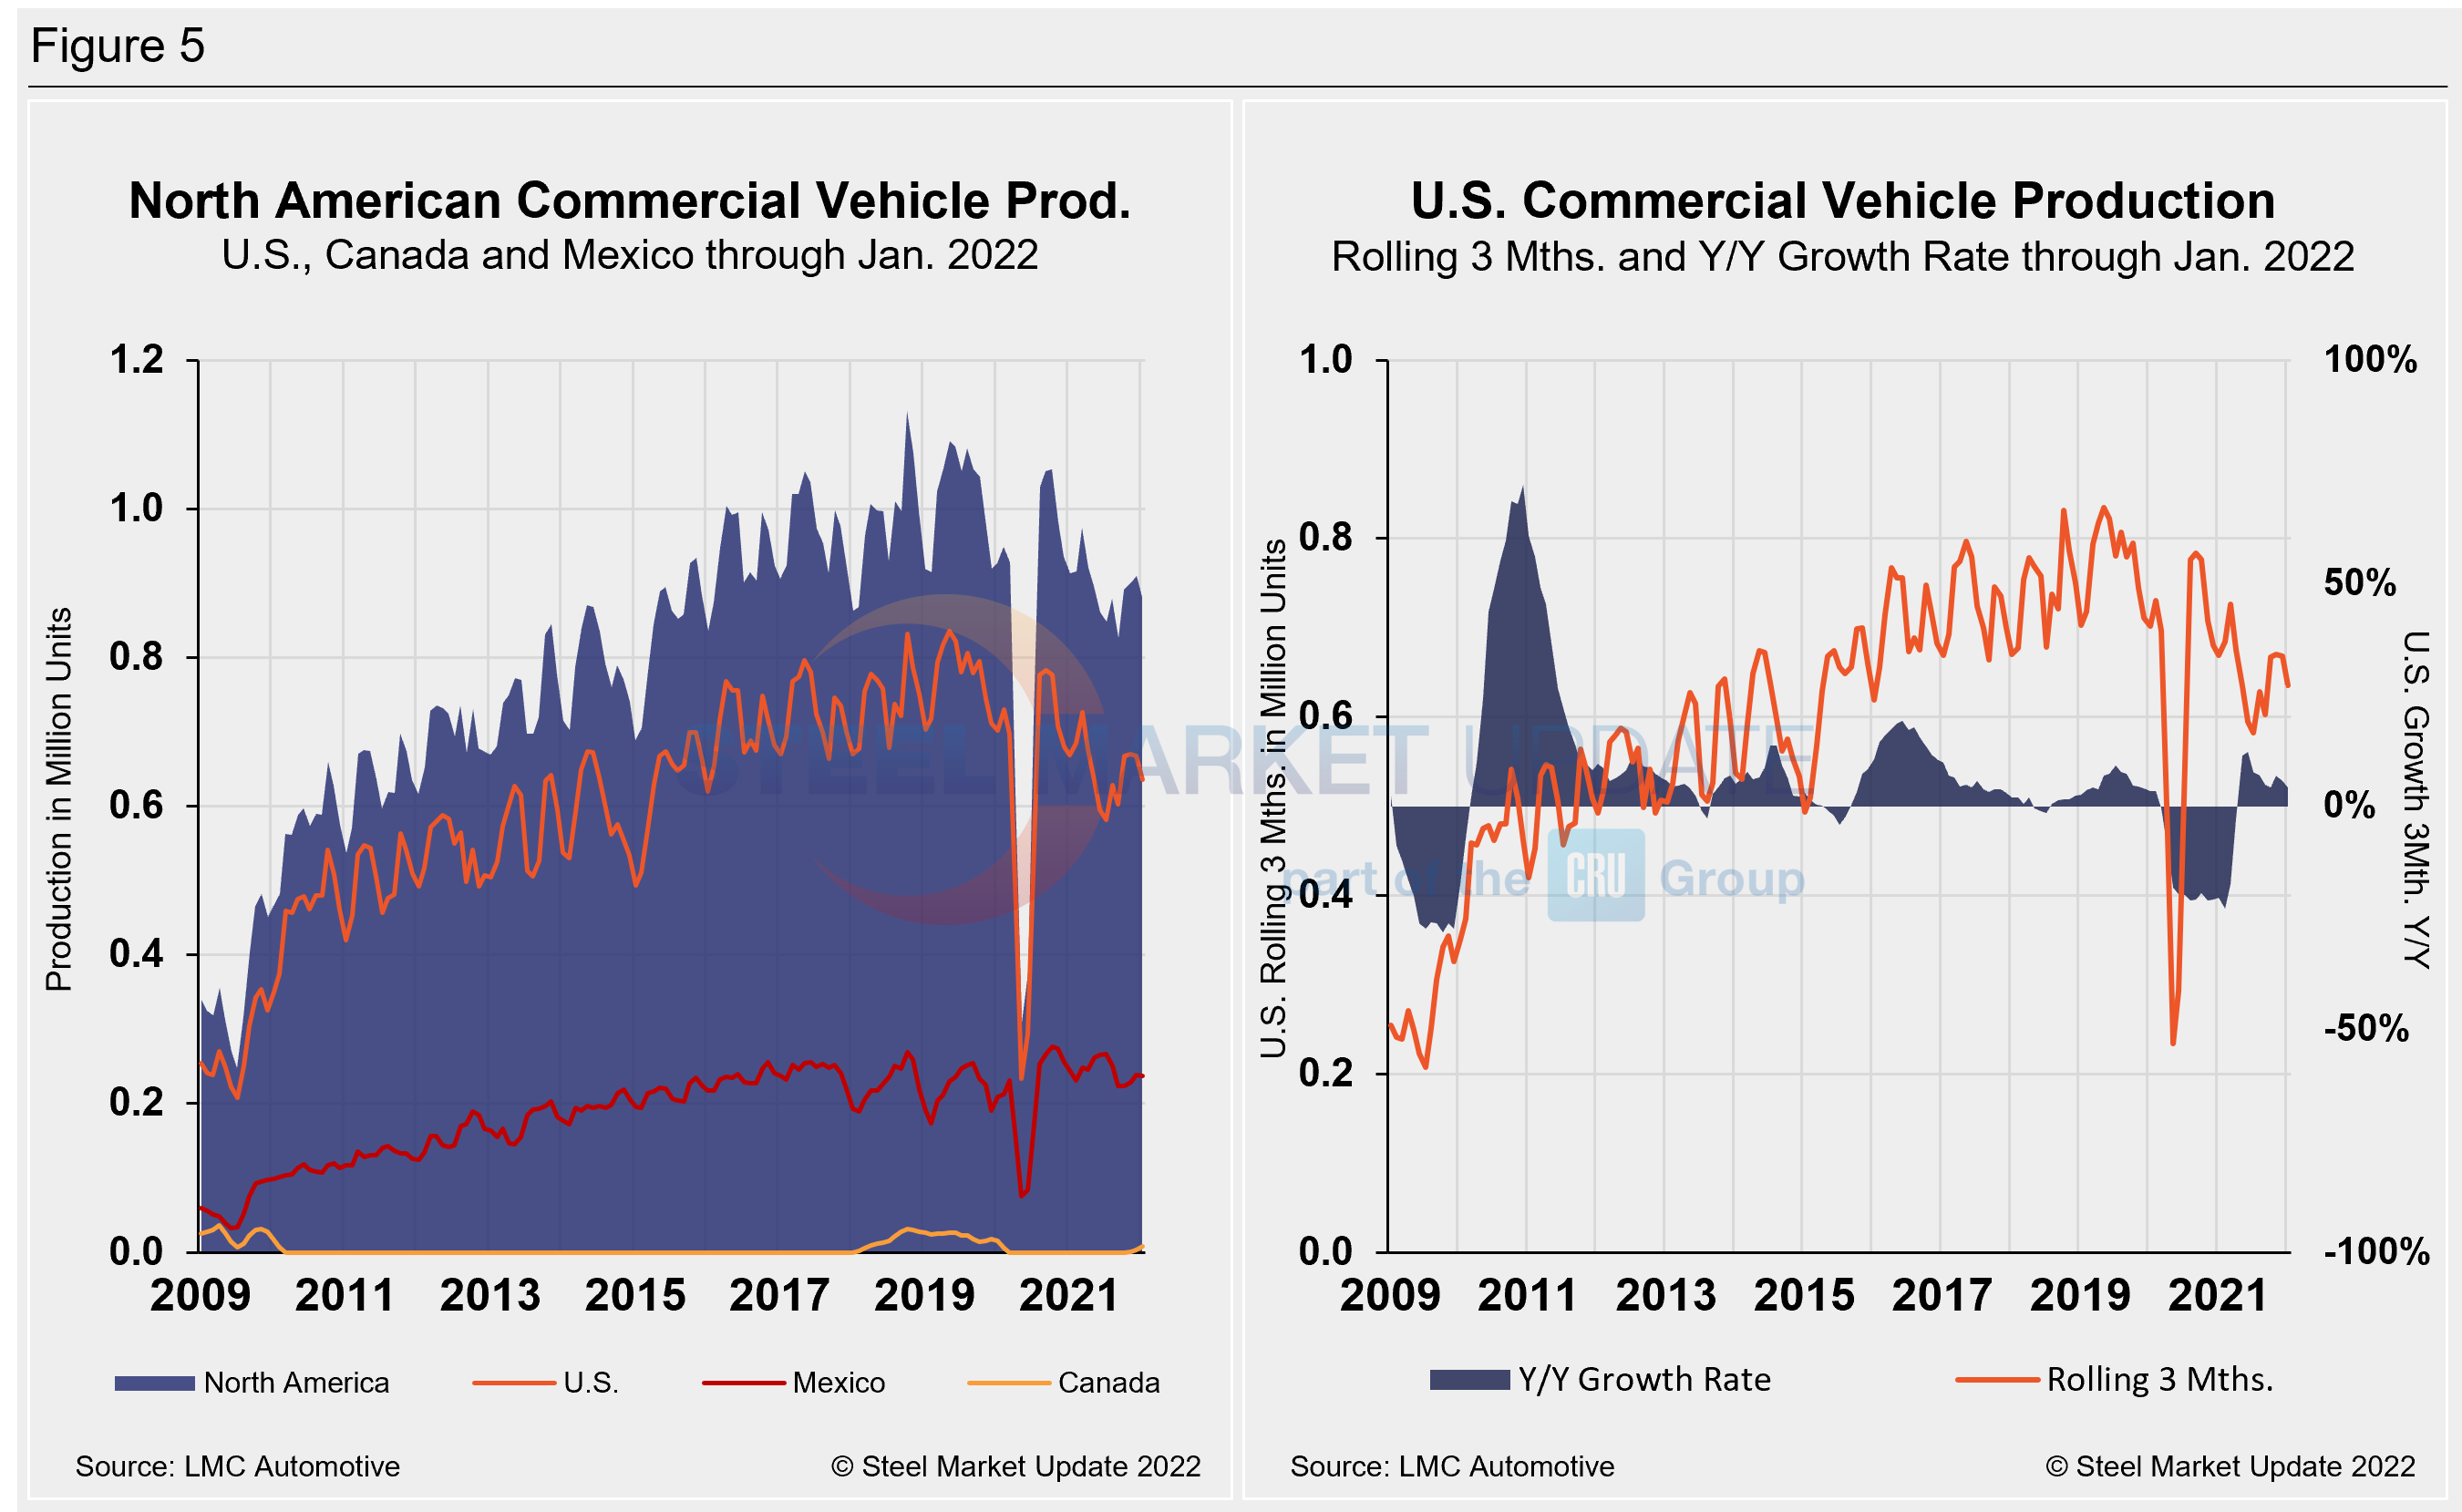
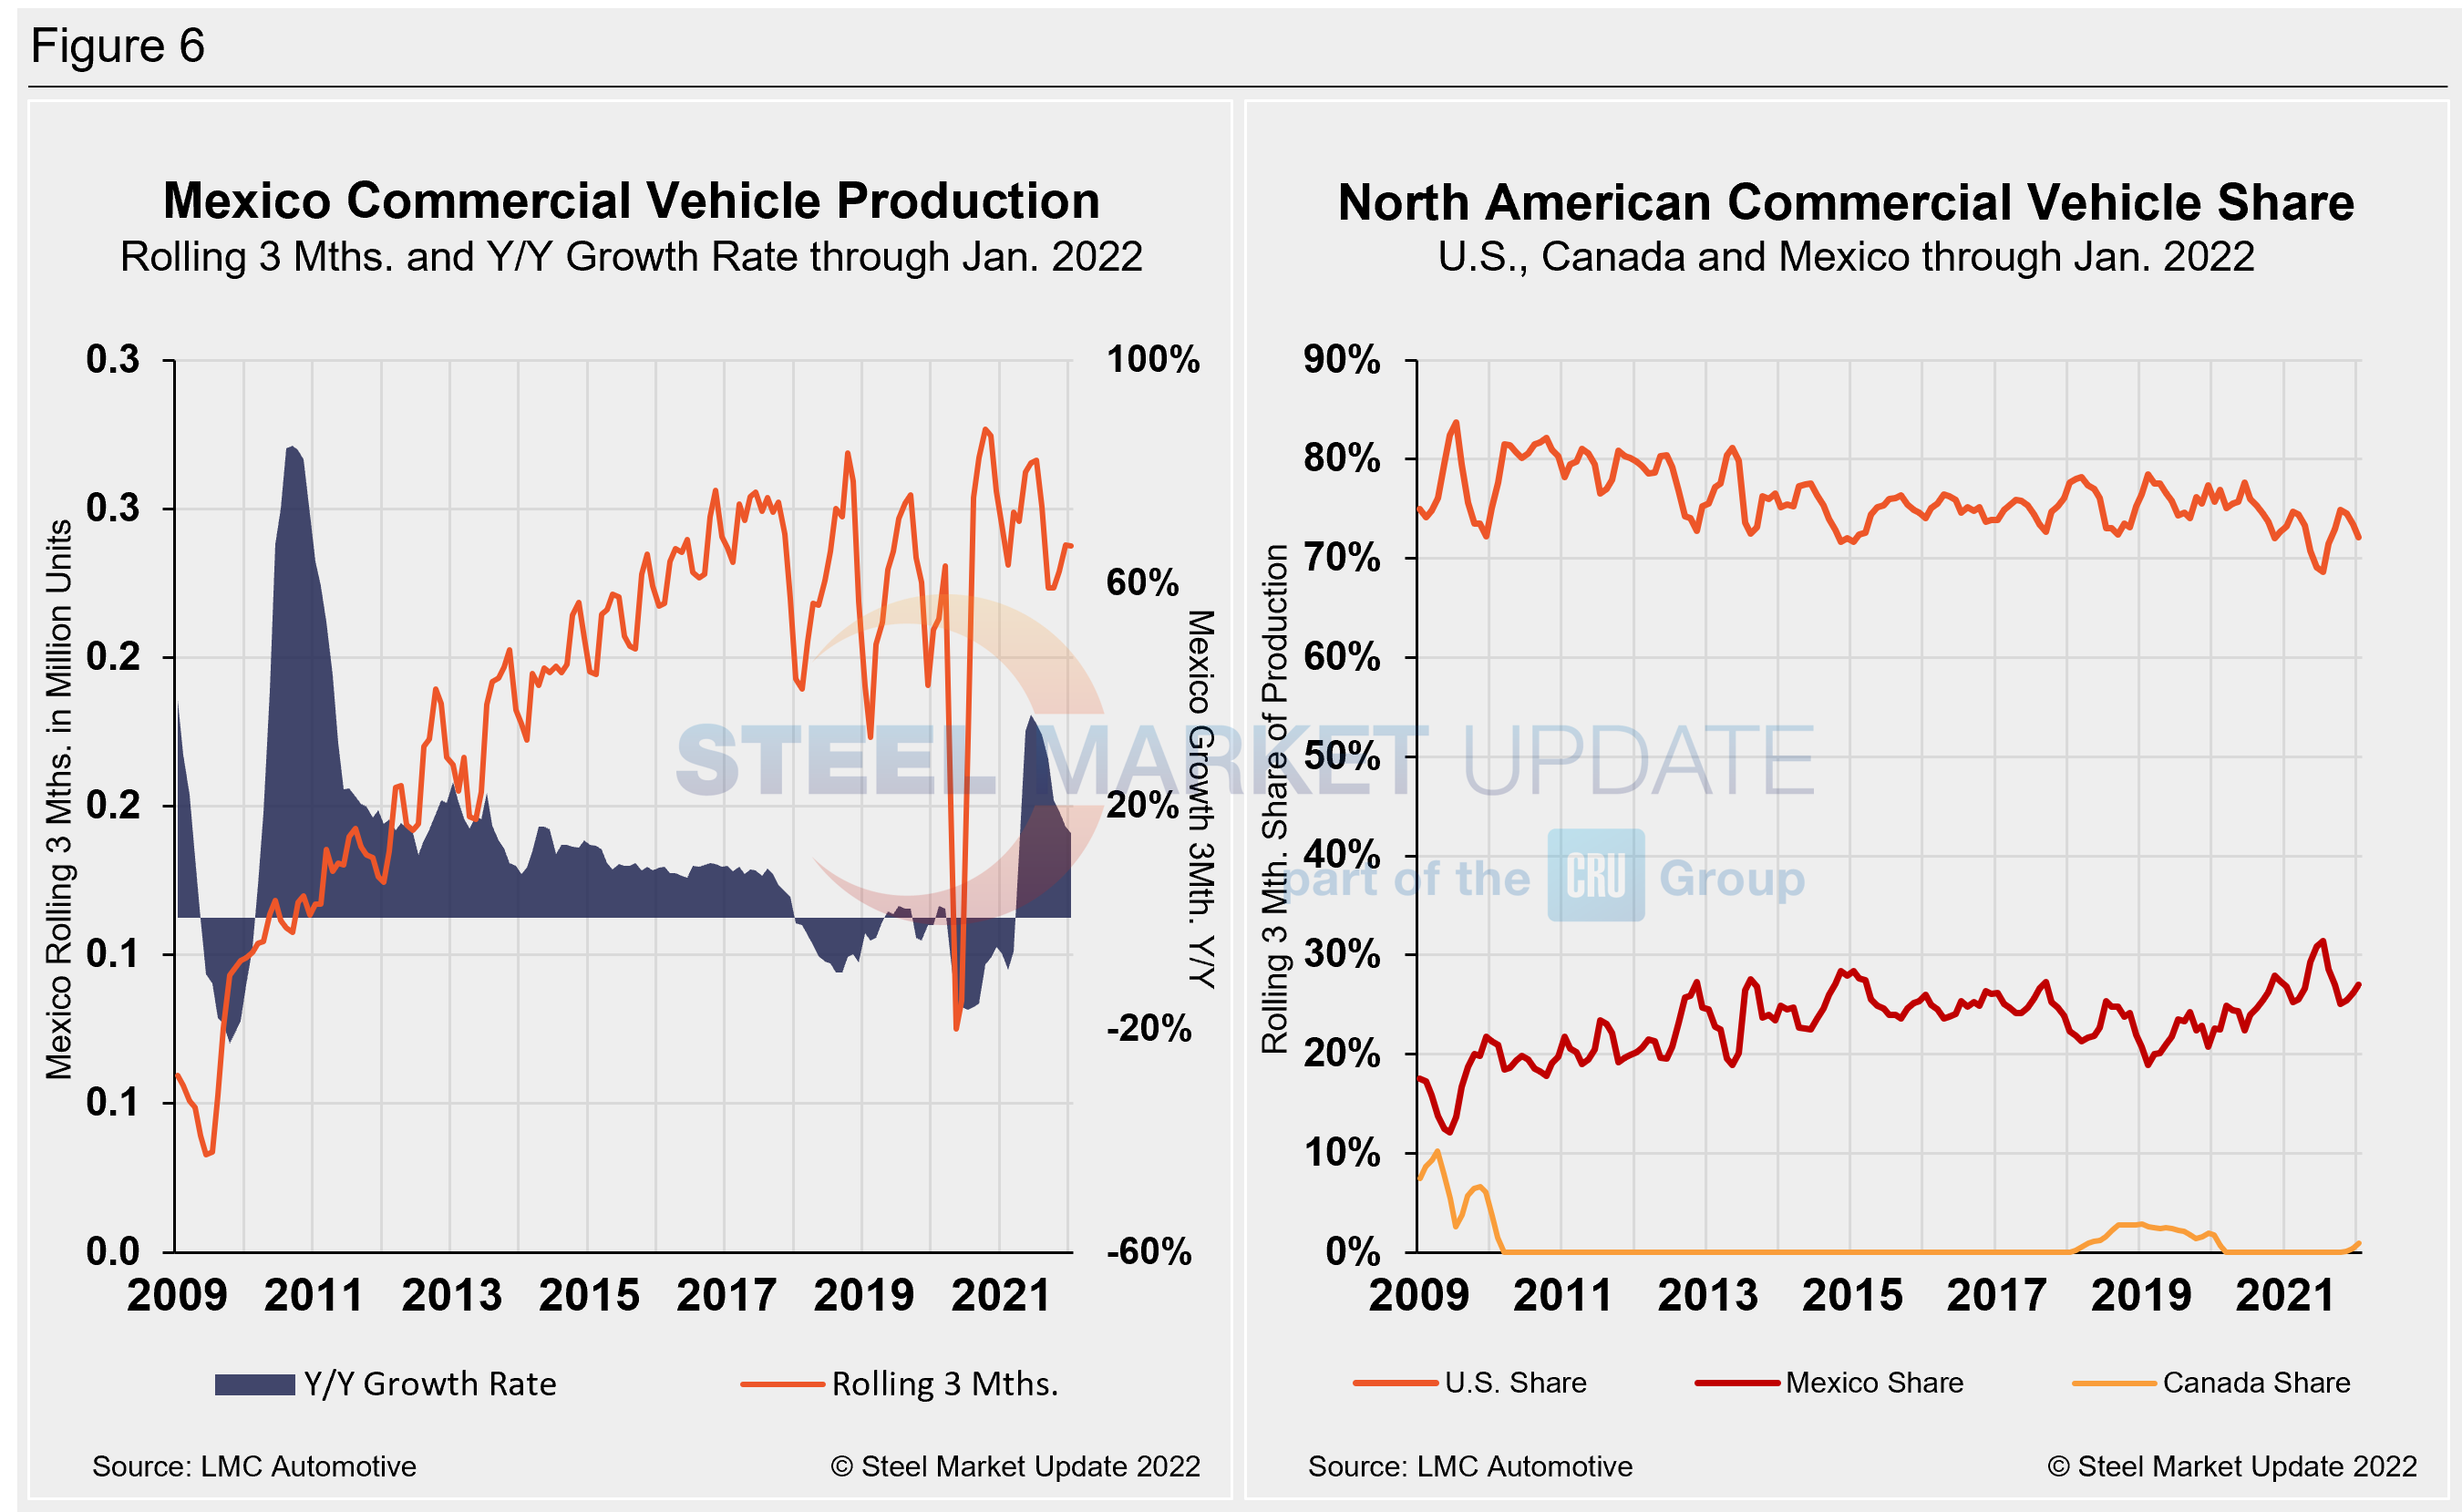
Total commercial vehicle production for North America and the total for each nation on a rolling three-month basis is shown below in the first chart in Figure 5, while the production of commercial vehicles in the U.S and the year-over-year growth rate is displayed in the second chart. Figure 6 shows the production of commercial vehicles and the year-over-year growth rate in Mexico displayed in the first chart, while the second chart shows the production share for each nation. Of note for the Canadian automotive sector, January marked Canada’s third month of commercial vehicle production in 25 months. The U.S.’s northern neighbor produced 4,241 light commercial vehicles in January, nearly 55% above December’s 2,739 total, and the third month of production since December 2019 when the country produced 5,966 units.
North American commercial vehicle production rose 8.1% in January to 293,783 units, following a 13.9% decline in December. The upgrade of 22,050 units month on month was a positive mark after the slow end to 2021. Mexico’s commercial production accelerated by 14.7% or 10,706 units in January, helping drive the overall gain. The U.S. saw a 5.0% boost or 9,848 more units last month versus December.
The annual commercial production growth rate is now -3.5% for the region, a 0.6% percentage point improvement month on month, but well ahead of the -21.3% seen last September. The U.S. share was 72.2% in January, down 1.2 percentage points versus the month prior. Mexico’s share expanded slightly to 27.0% month on month, up 0.2 of a percentage point, while Canada now has a 0.9% share of the market. Presently, Mexico exports just under 80% of its light vehicle production, while the U.S and Canada are the highest volume destinations for Mexican exports.
Editor’s Note: This report is based on data from LMC Automotive for automotive assemblies in the U.S., Canada and Mexico. The breakdown of assemblies is “Personal” (cars for personal use) and “Commercial” (light vehicles less than 6.0 metric tons gross vehicle weight rating; heavy trucks and buses are not included). In this report, we describe light vehicle sales in the U.S. and report in detail on assemblies in the three regions of North America.
By David Schollaert, David@SteelMarketUpdate.com


