

Analysis

March 4, 2022
CPIP Data: Construction Spending Jumps in January
Written by David Schollaert
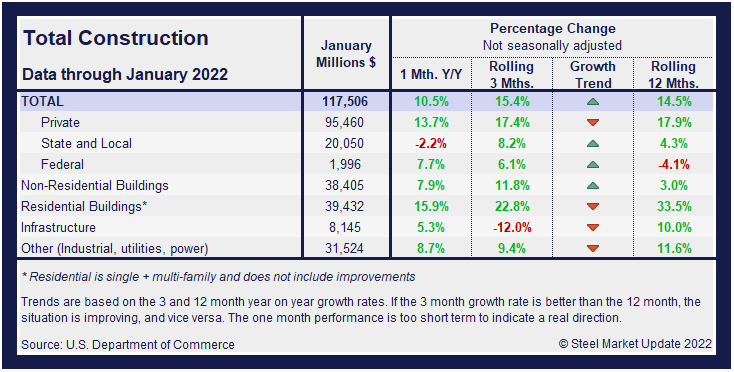
U.S. construction spending in January totaled $1.68 trillion at a seasonally adjusted annual rate, boosted 1.3% by strong outlays on single-family homebuilding and private nonresidential structures, the Commerce Department reported.
The gain is even more significant given December data was revised higher to show construction outlays rising 0.8% instead of 0.2% as previously reported. January’s spending increased 8.2% on a year-on-year basis.
The Census Bureau’s report on construction shows spending on private construction projects shot up 1.5% in January. Outlays on residential construction increased 1.3%. Single-family homebuilding spending advanced 1.2%, while outlays on multi-family housing projects dipped 0.1%.
In contrast, public construction spending rose 0.6% for the month, but slipped 1.3% from the year-ago level. Outlays on state and local government construction projects fell 0.5%, while federal government spending soared 13.8%.
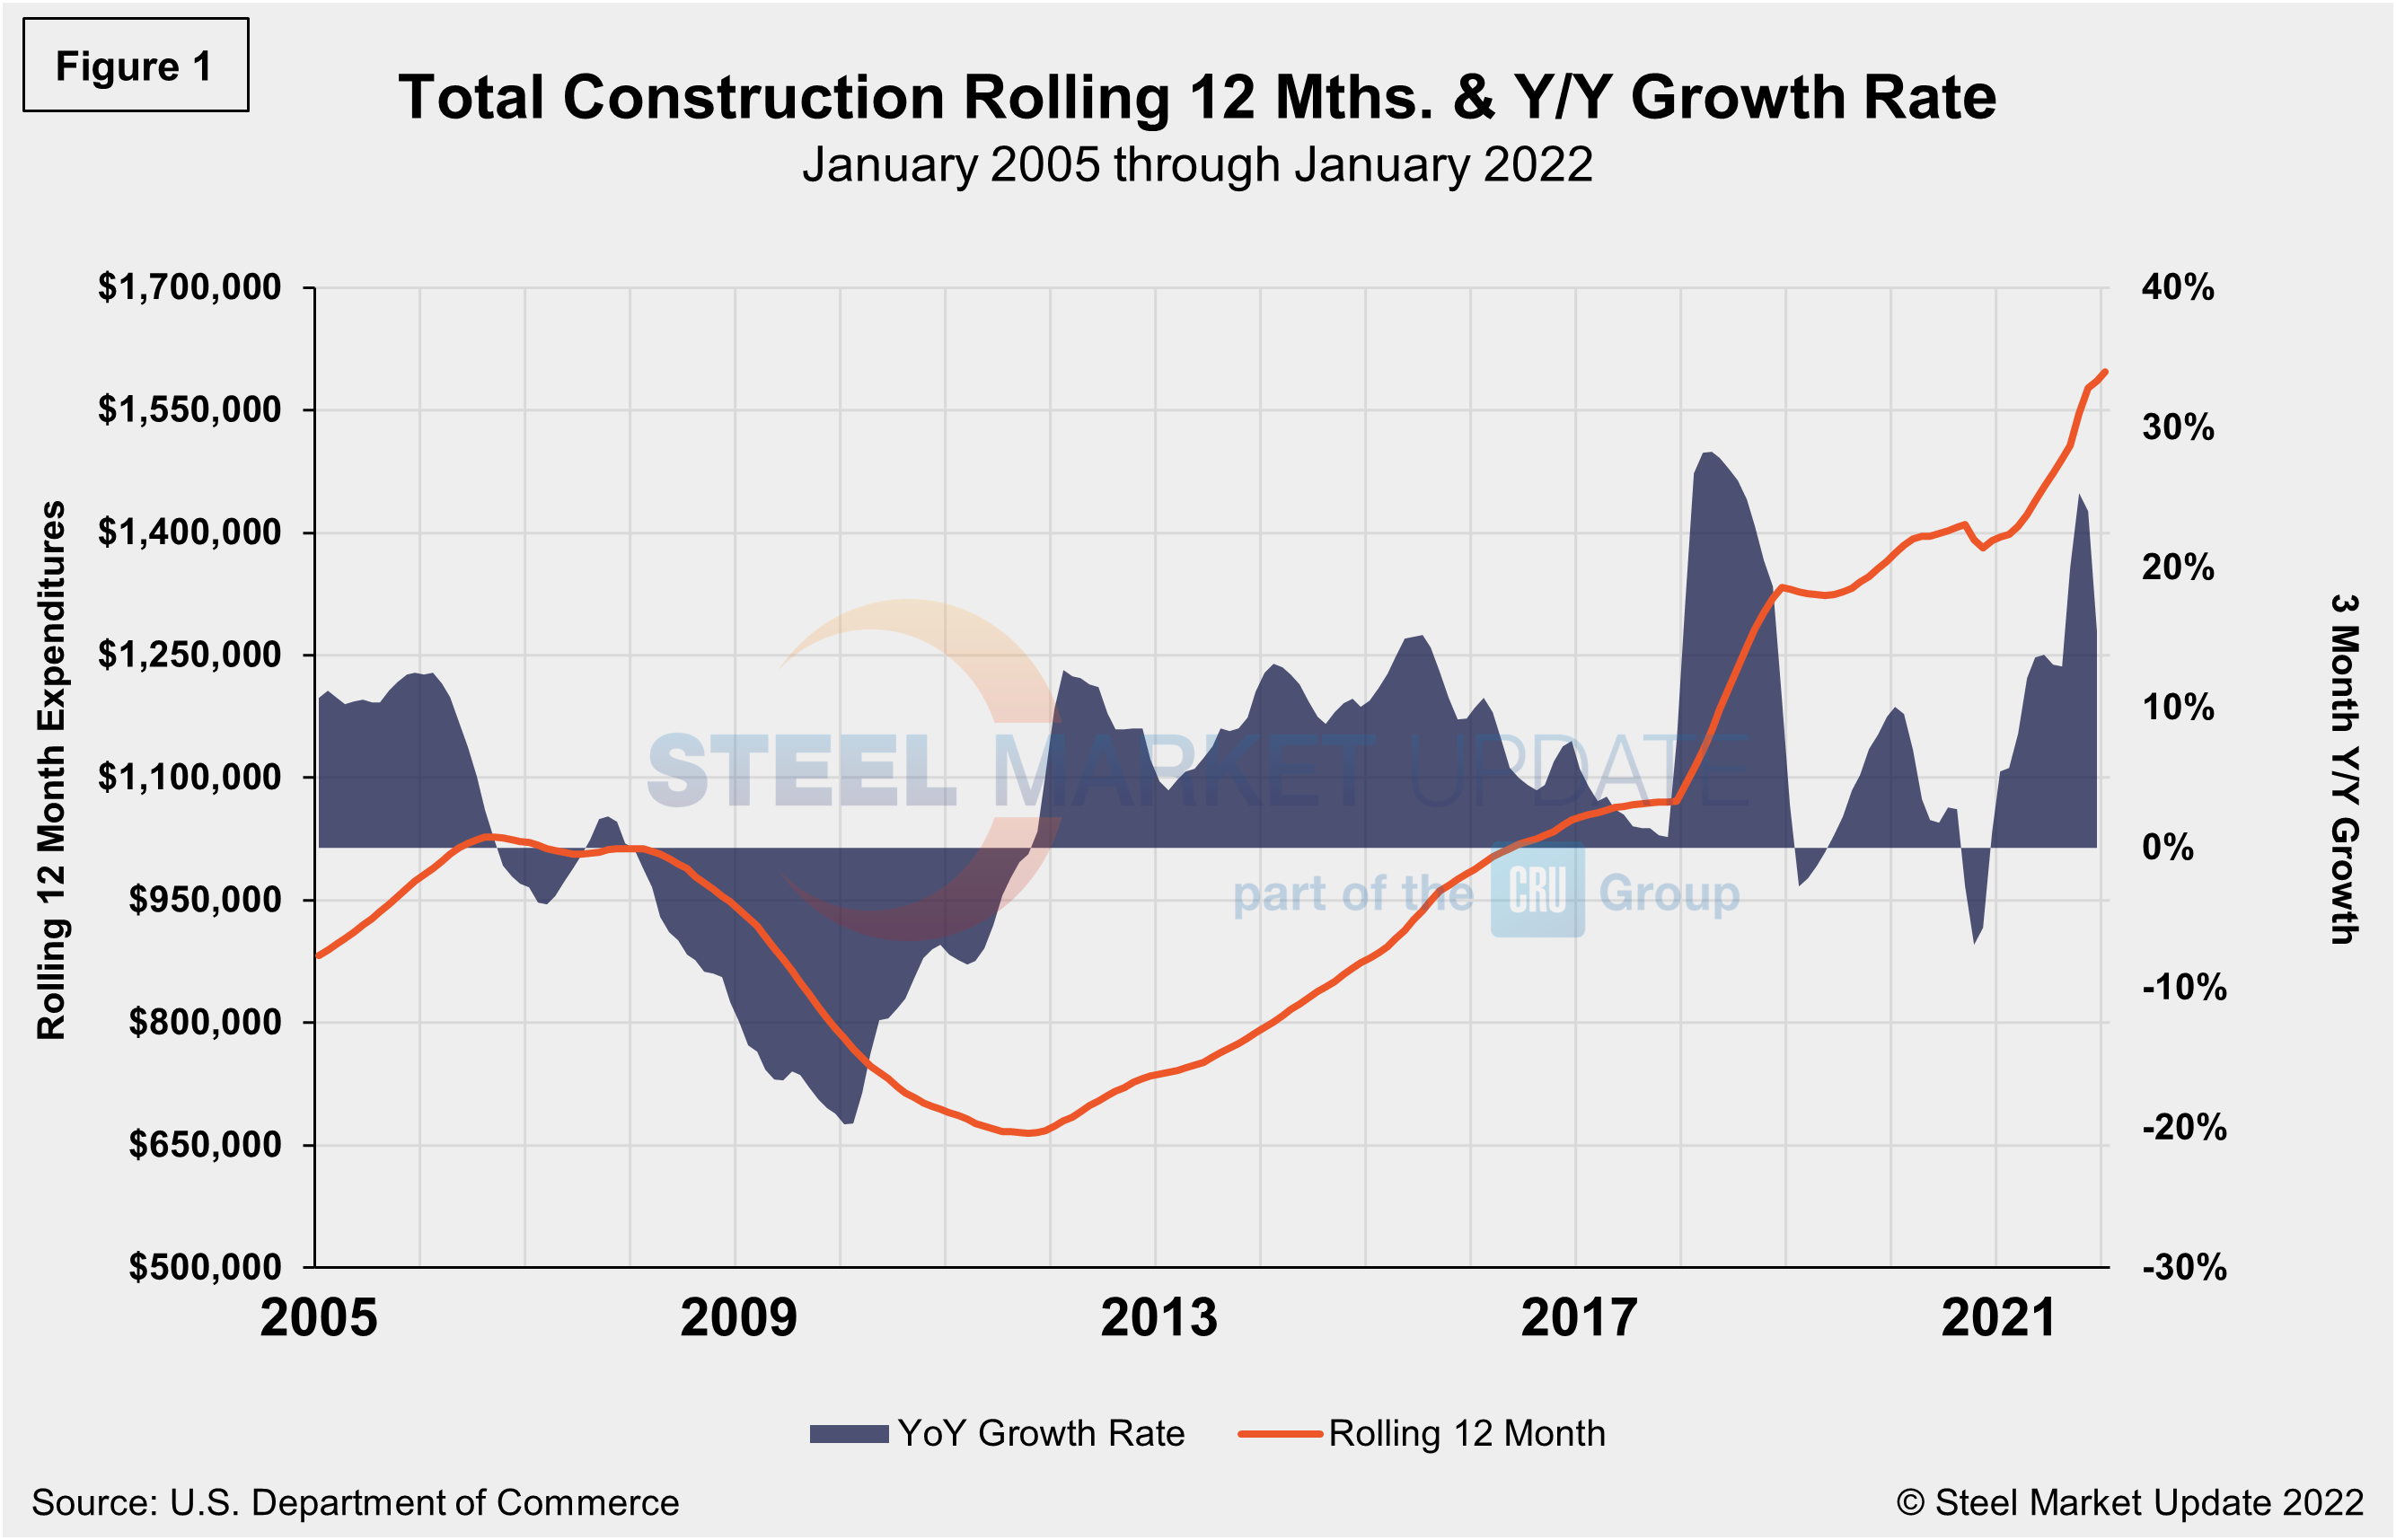
Total construction expenditures and their major categories are shown in the table and chart (Figure 1) below.
Private Construction
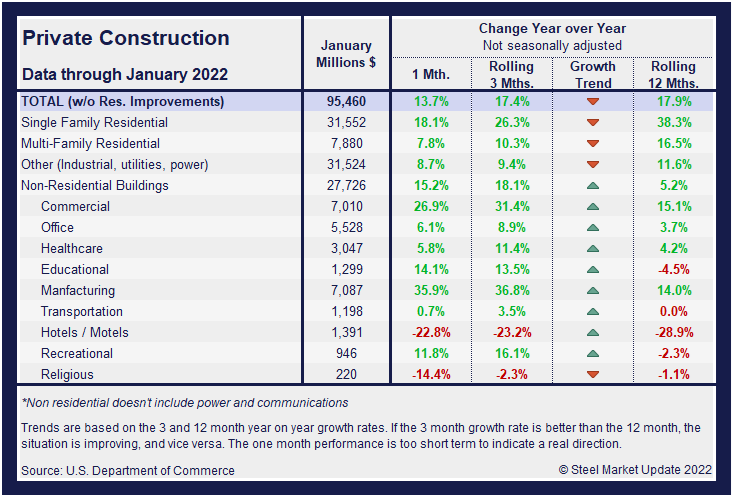
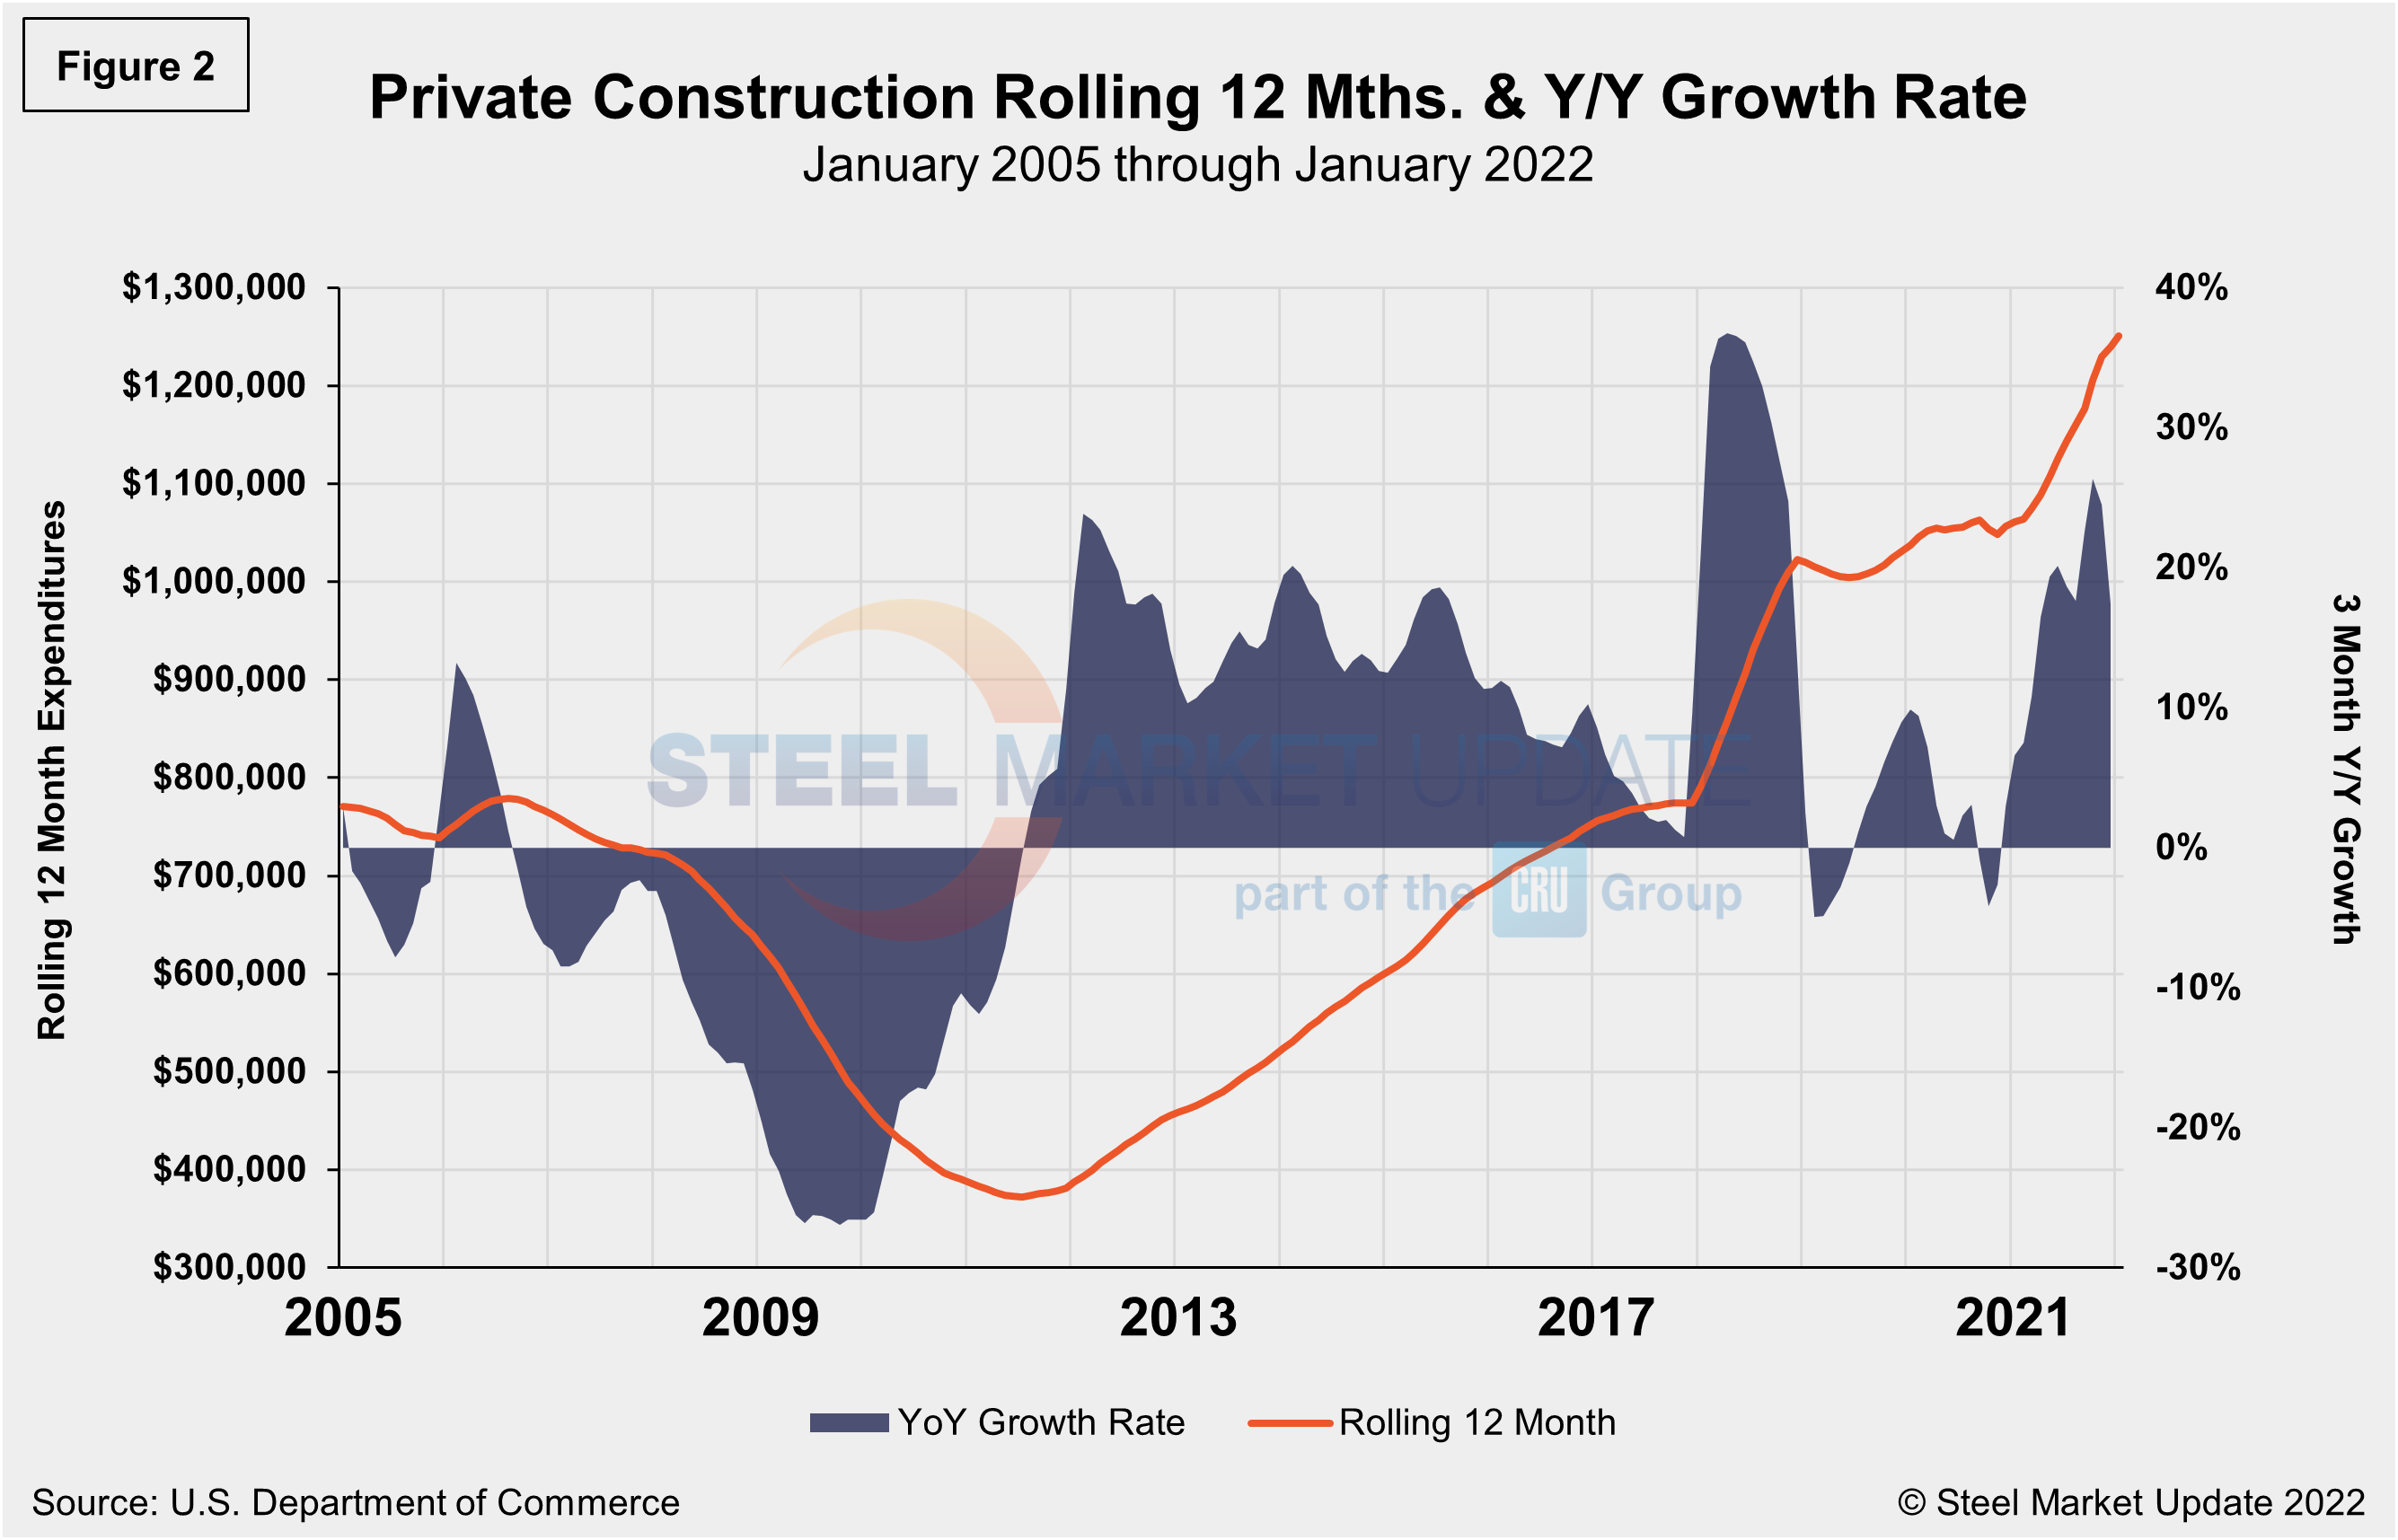
The breakdown of private expenditures into residential and nonresidential and their subsectors are highlighted in the table and Figure 2 below. Construction put in place in the private sector totaled a seasonally adjusted $1.33 trillion in January, up from the revised $1.31 trillion the prior month, a 1.5% increase.
Within that category, residential construction was at a seasonally adjusted annual rate of $829.4 billion in January, ahead of the revised December estimate of $819.0 billion. Nonresidential construction was at a seasonally adjusted annual rate of $497.2 billion in January, up from the revised December estimate of $488.2 billion.
Among residential segments, single-family construction at $445.1 billion added 1.2% over the December total and 15.4% year-over-year. Multifamily construction inched down less than 0.1% in January at $101.5 billion, but rose 4.8% from a year earlier. Spending on improvements to existing owner-occupied houses increased 1.8% for the month and 13.7% year-over-year.
Investment in private nonresidential structures like gas and oil well drilling accelerated 1.8% in January, suggesting a rebound in spending early in the first quarter. Spending on structures fell for a third straight quarter in the October-December period.
Despite January’s jump among residential segments, homebuilding remains constrained by higher prices for building materials, especially framing lumber. Last November, the U.S. nearly doubled the duties on imported Canadian softwood lumber after a review of its antidumping and countervailing duty orders.
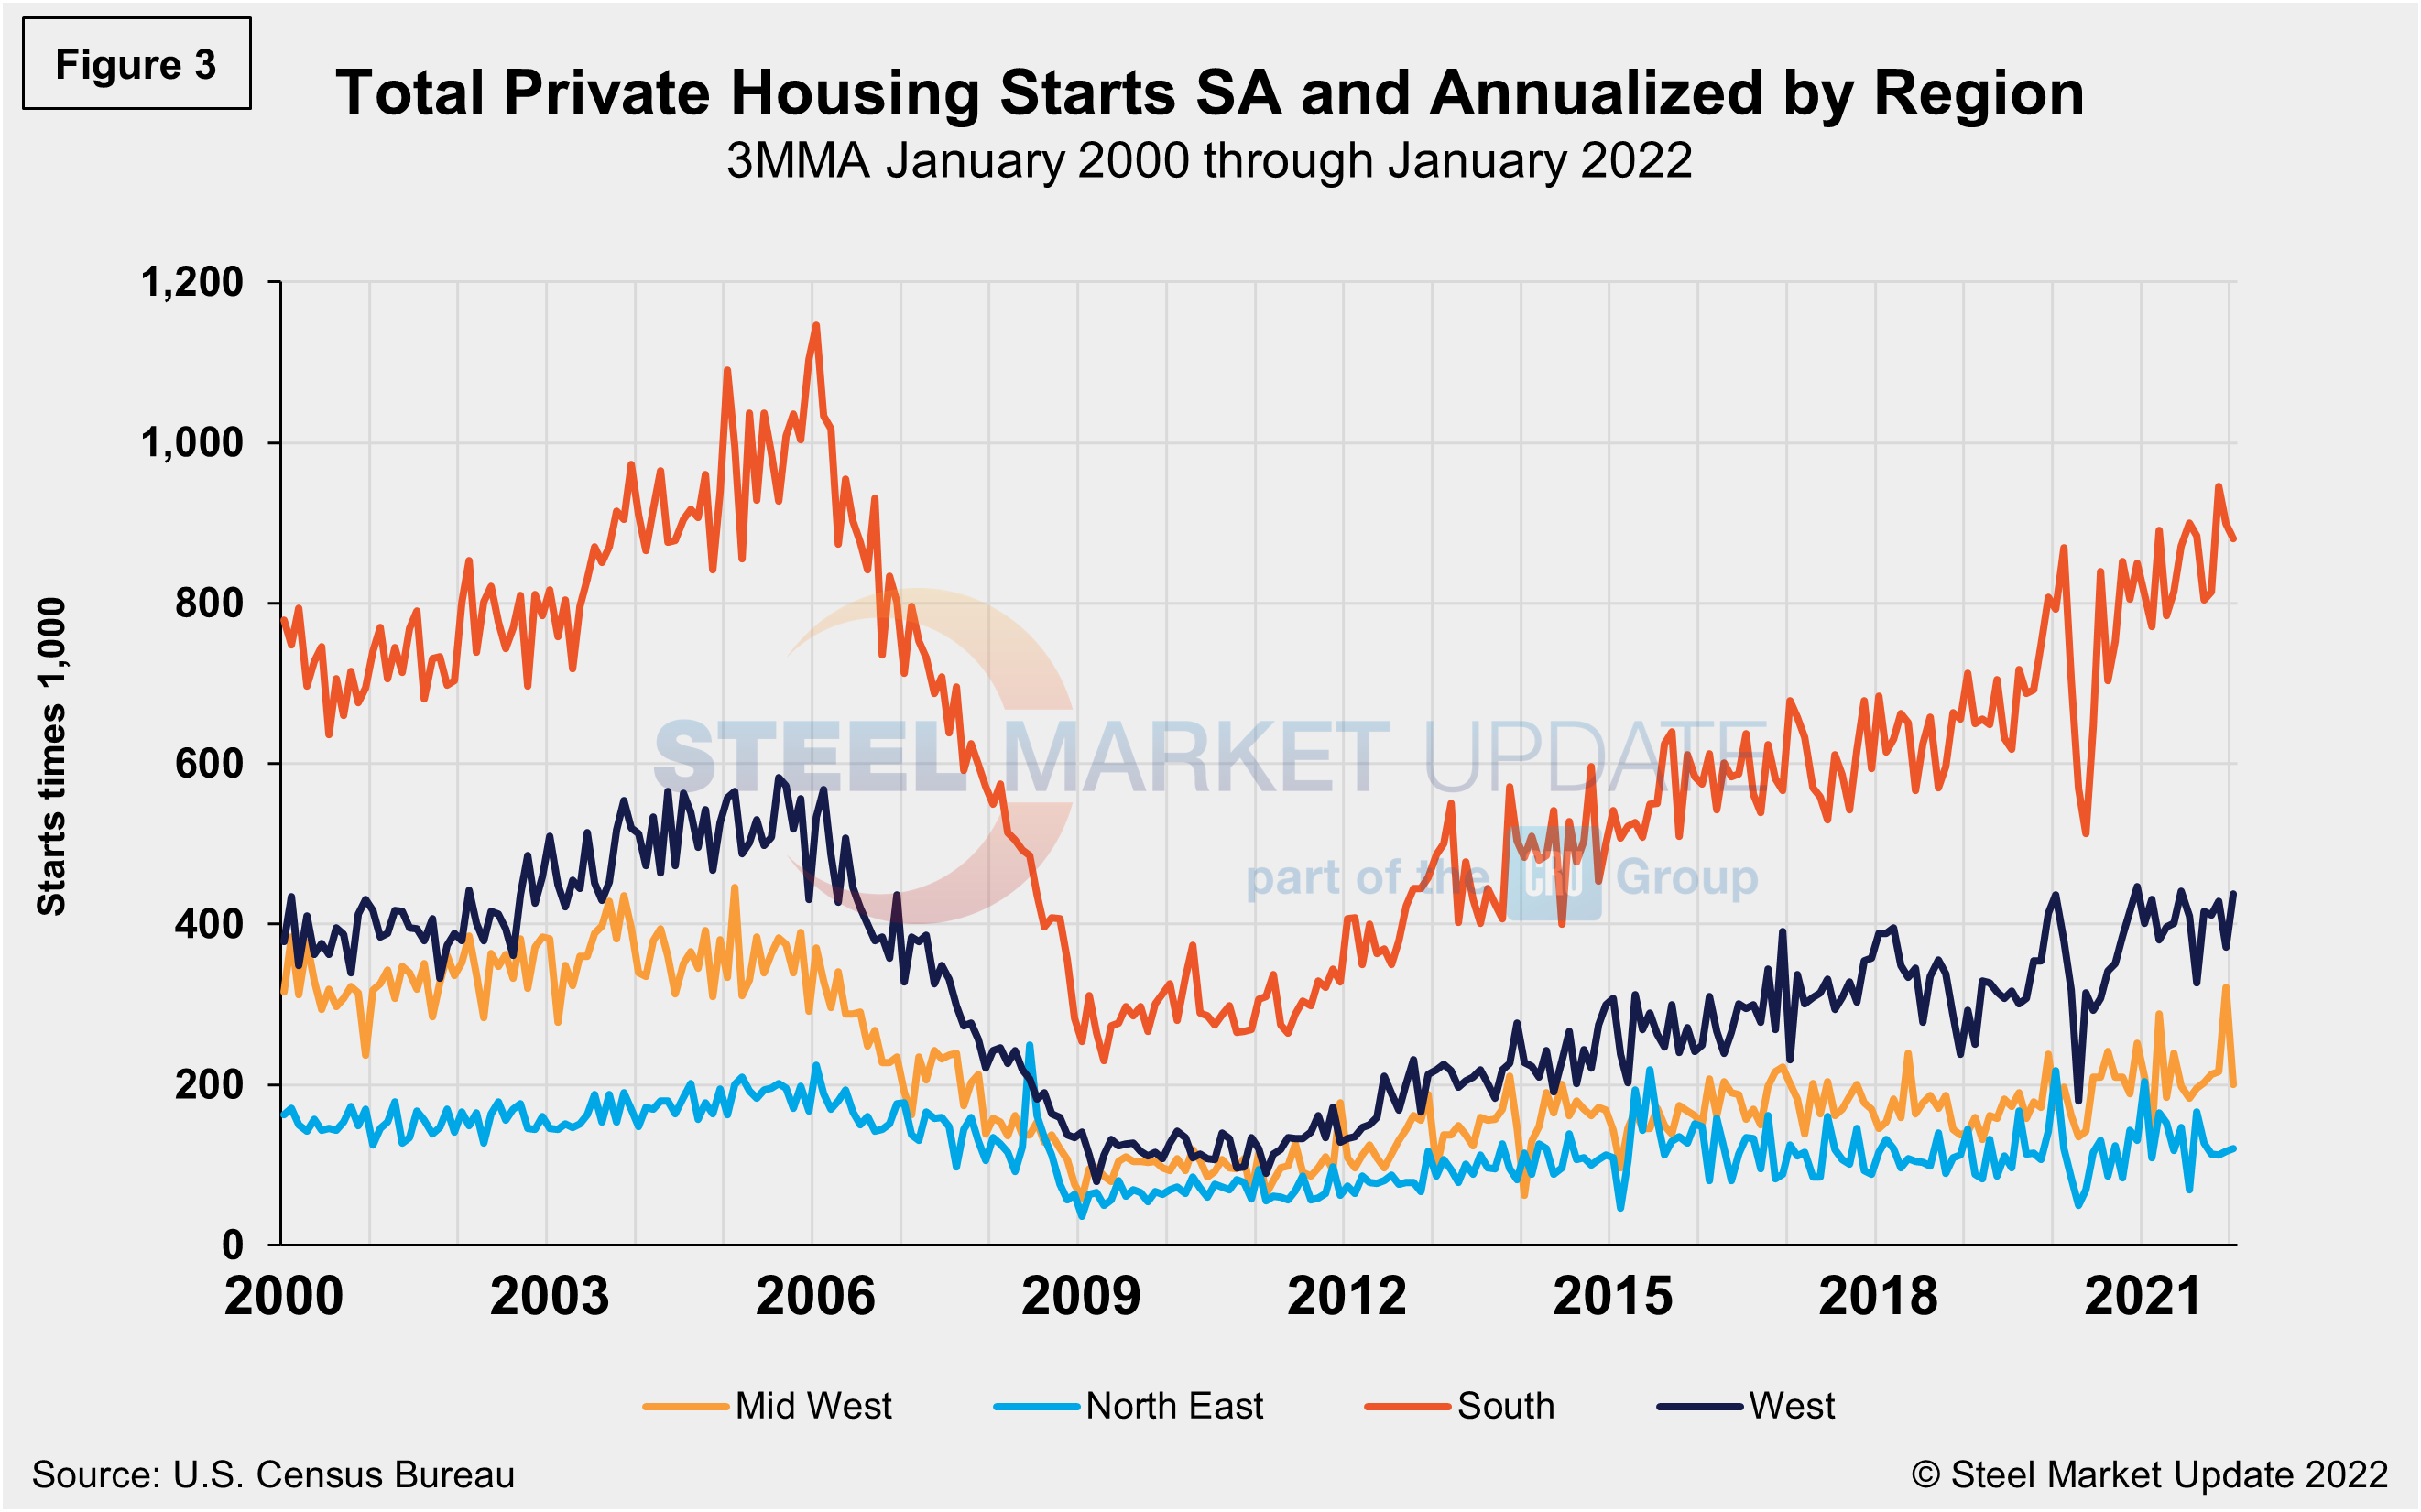
Total housing starts in the four regions are displayed below (Figure 3). Privately‐owned housing starts in January were at a seasonally adjusted annual rate of 1.638 million, down 3.8% from the revised December estimate of 1.708 million. The loss was driven by a single-family decline at a rate of 1.116 million, down 5.6% from December’s revised figure of 1.182 million. Both single-family and multifamily properties saw a decline in January due to ongoing labor and material shortages.
Regional results were mixed. The West saw a 17.7% gain in January as starts totaled 438,000, while the Midwest plummeted by 37.7% with just 200,000 starts. The South region continued to be the strongest for housing starts at 880,000 in January, yet the result was a 2.0% decline versus the prior month. The Northeast saw a 2.6% increase month on month to a total of 120,000 starts in January.
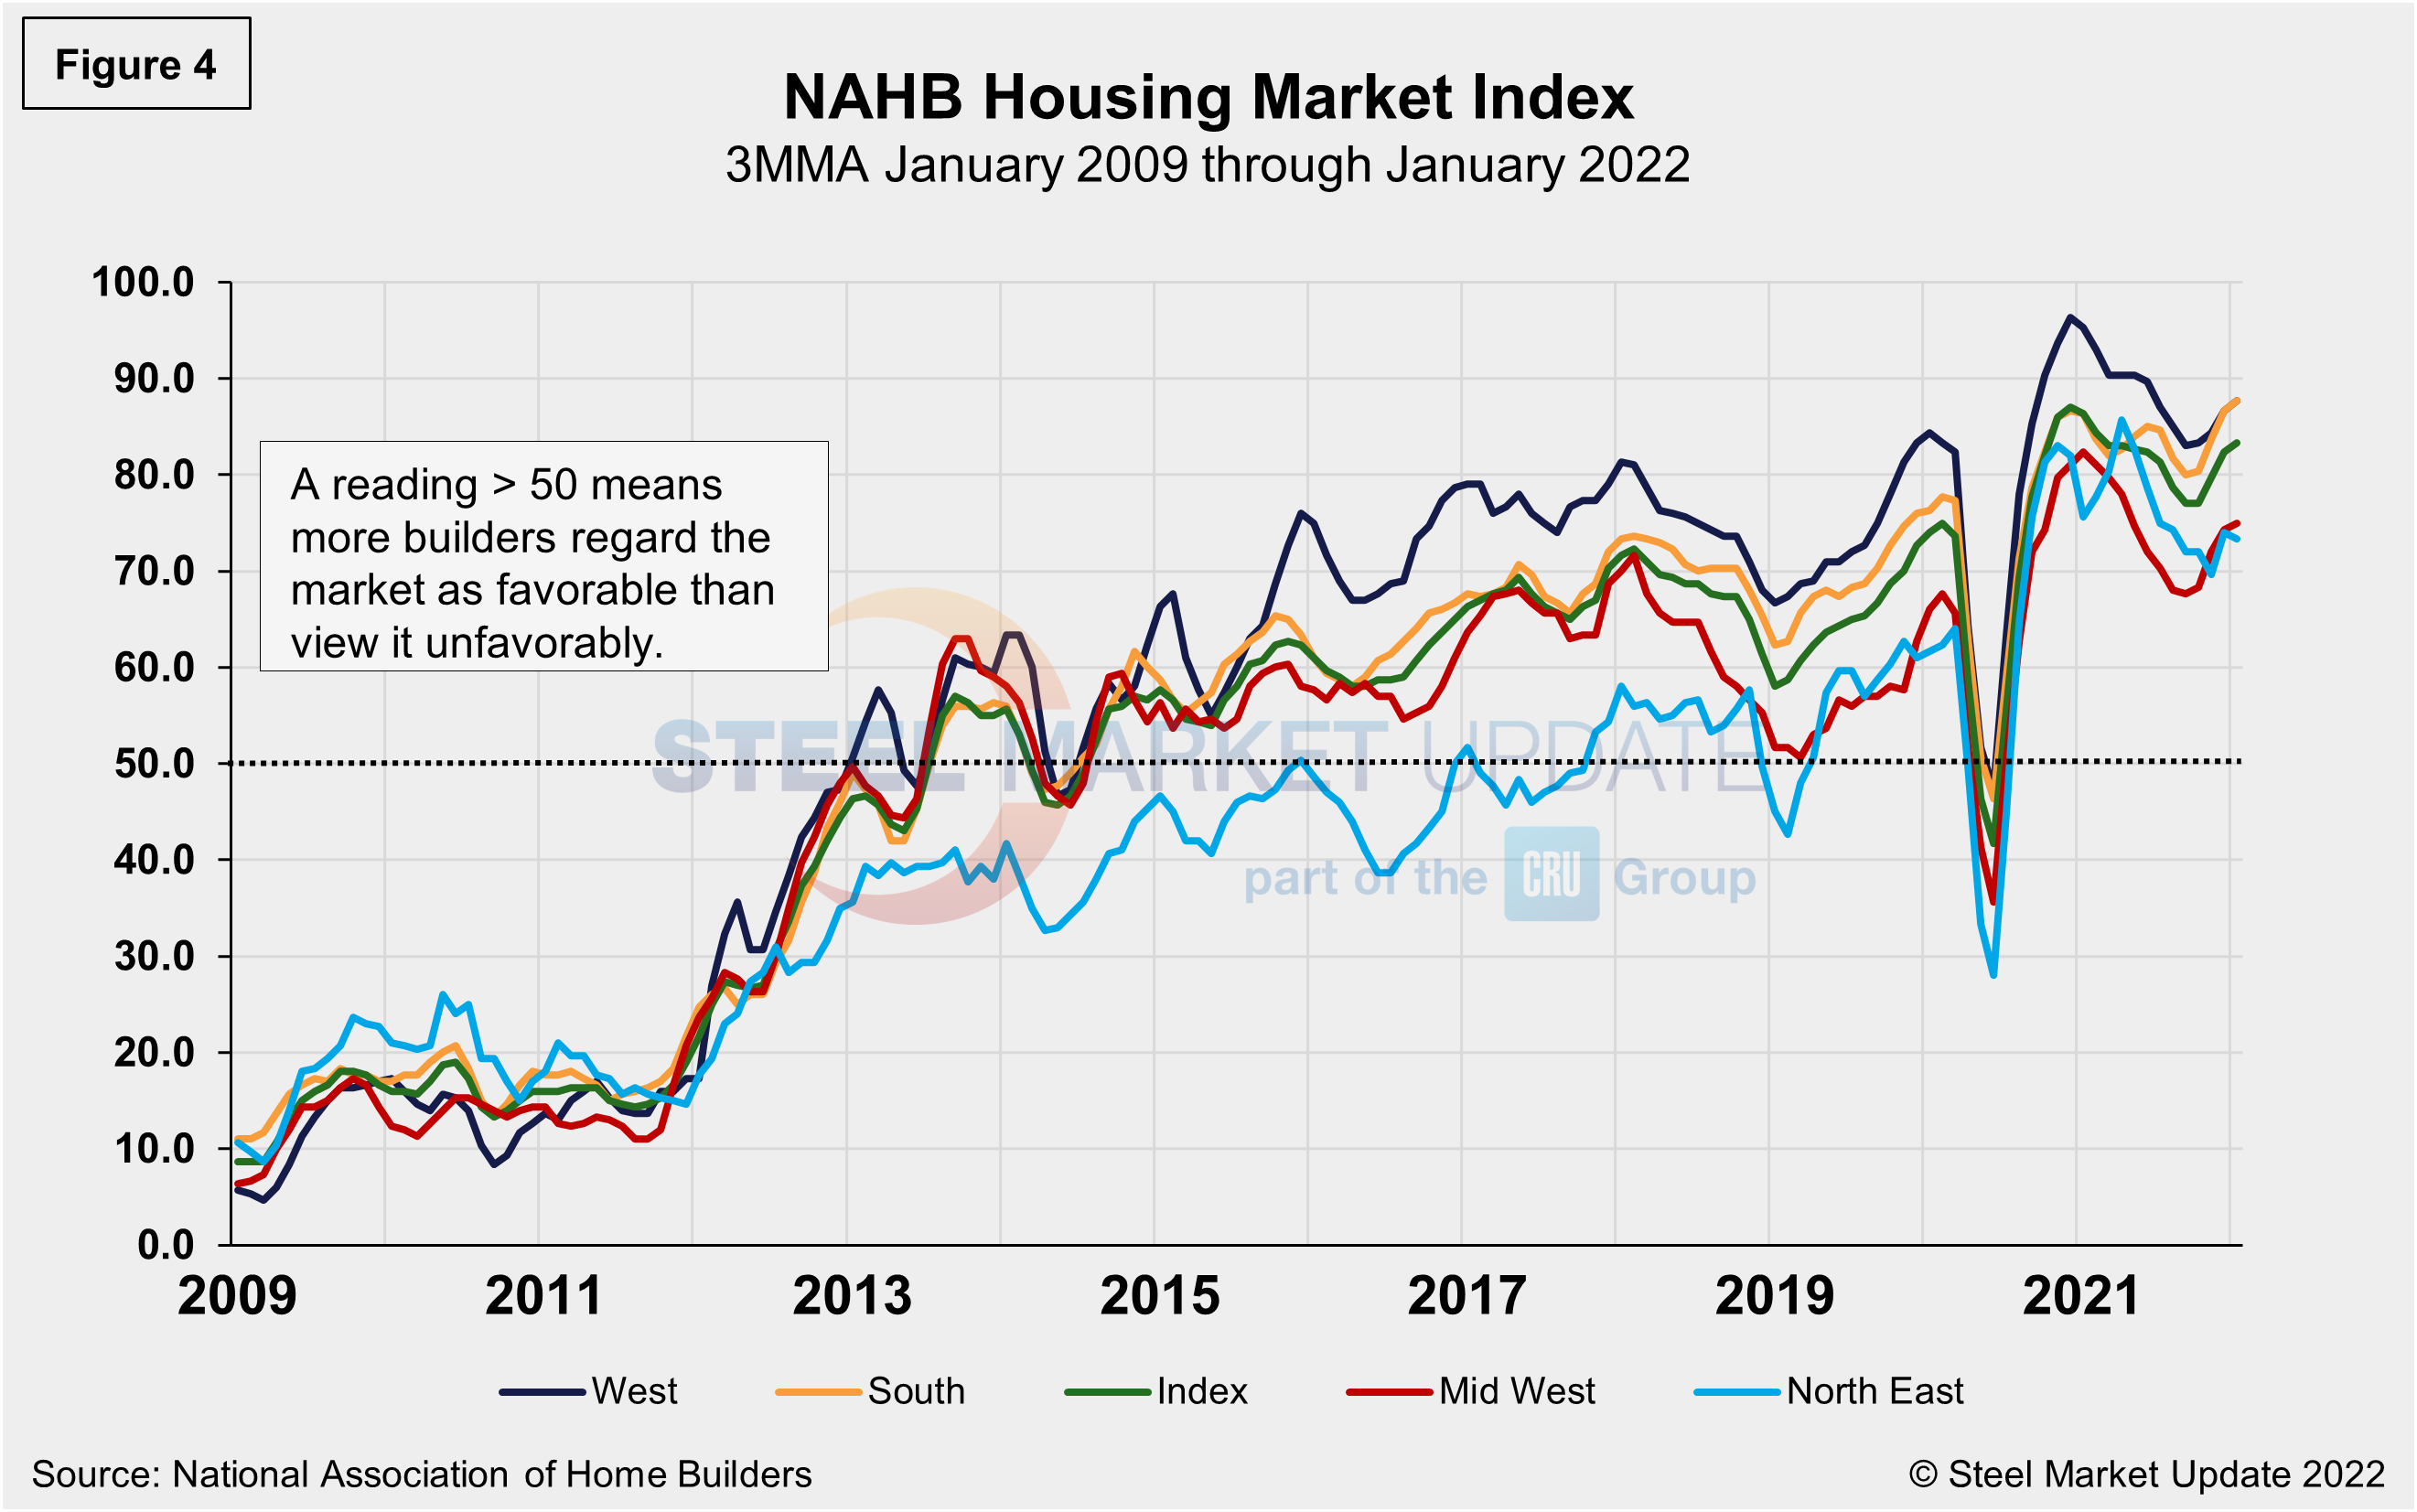
The National Association of Homebuilders (NAHB) said last month that building material production bottlenecks were raising construction costs and delaying projects. Residential investment rebounded moderately in the fourth quarter after two straight quarterly declines.
NAHB’s Optimism Index registered 83 in January, down slightly from 84 the month prior, and slipping for the first time in five months. Advance reports indicate that the index may remain down in February (Figure 4).
State and Local Construction
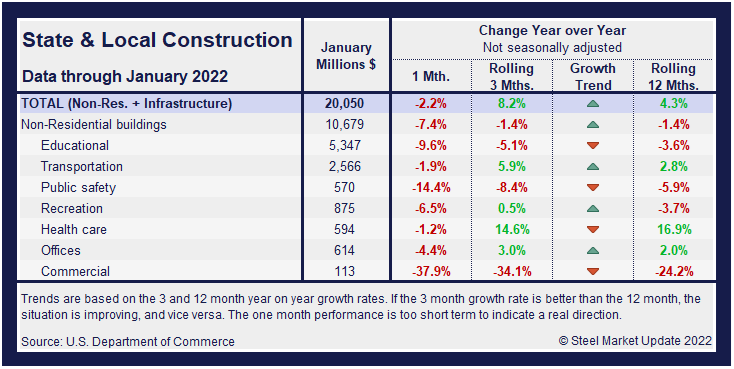
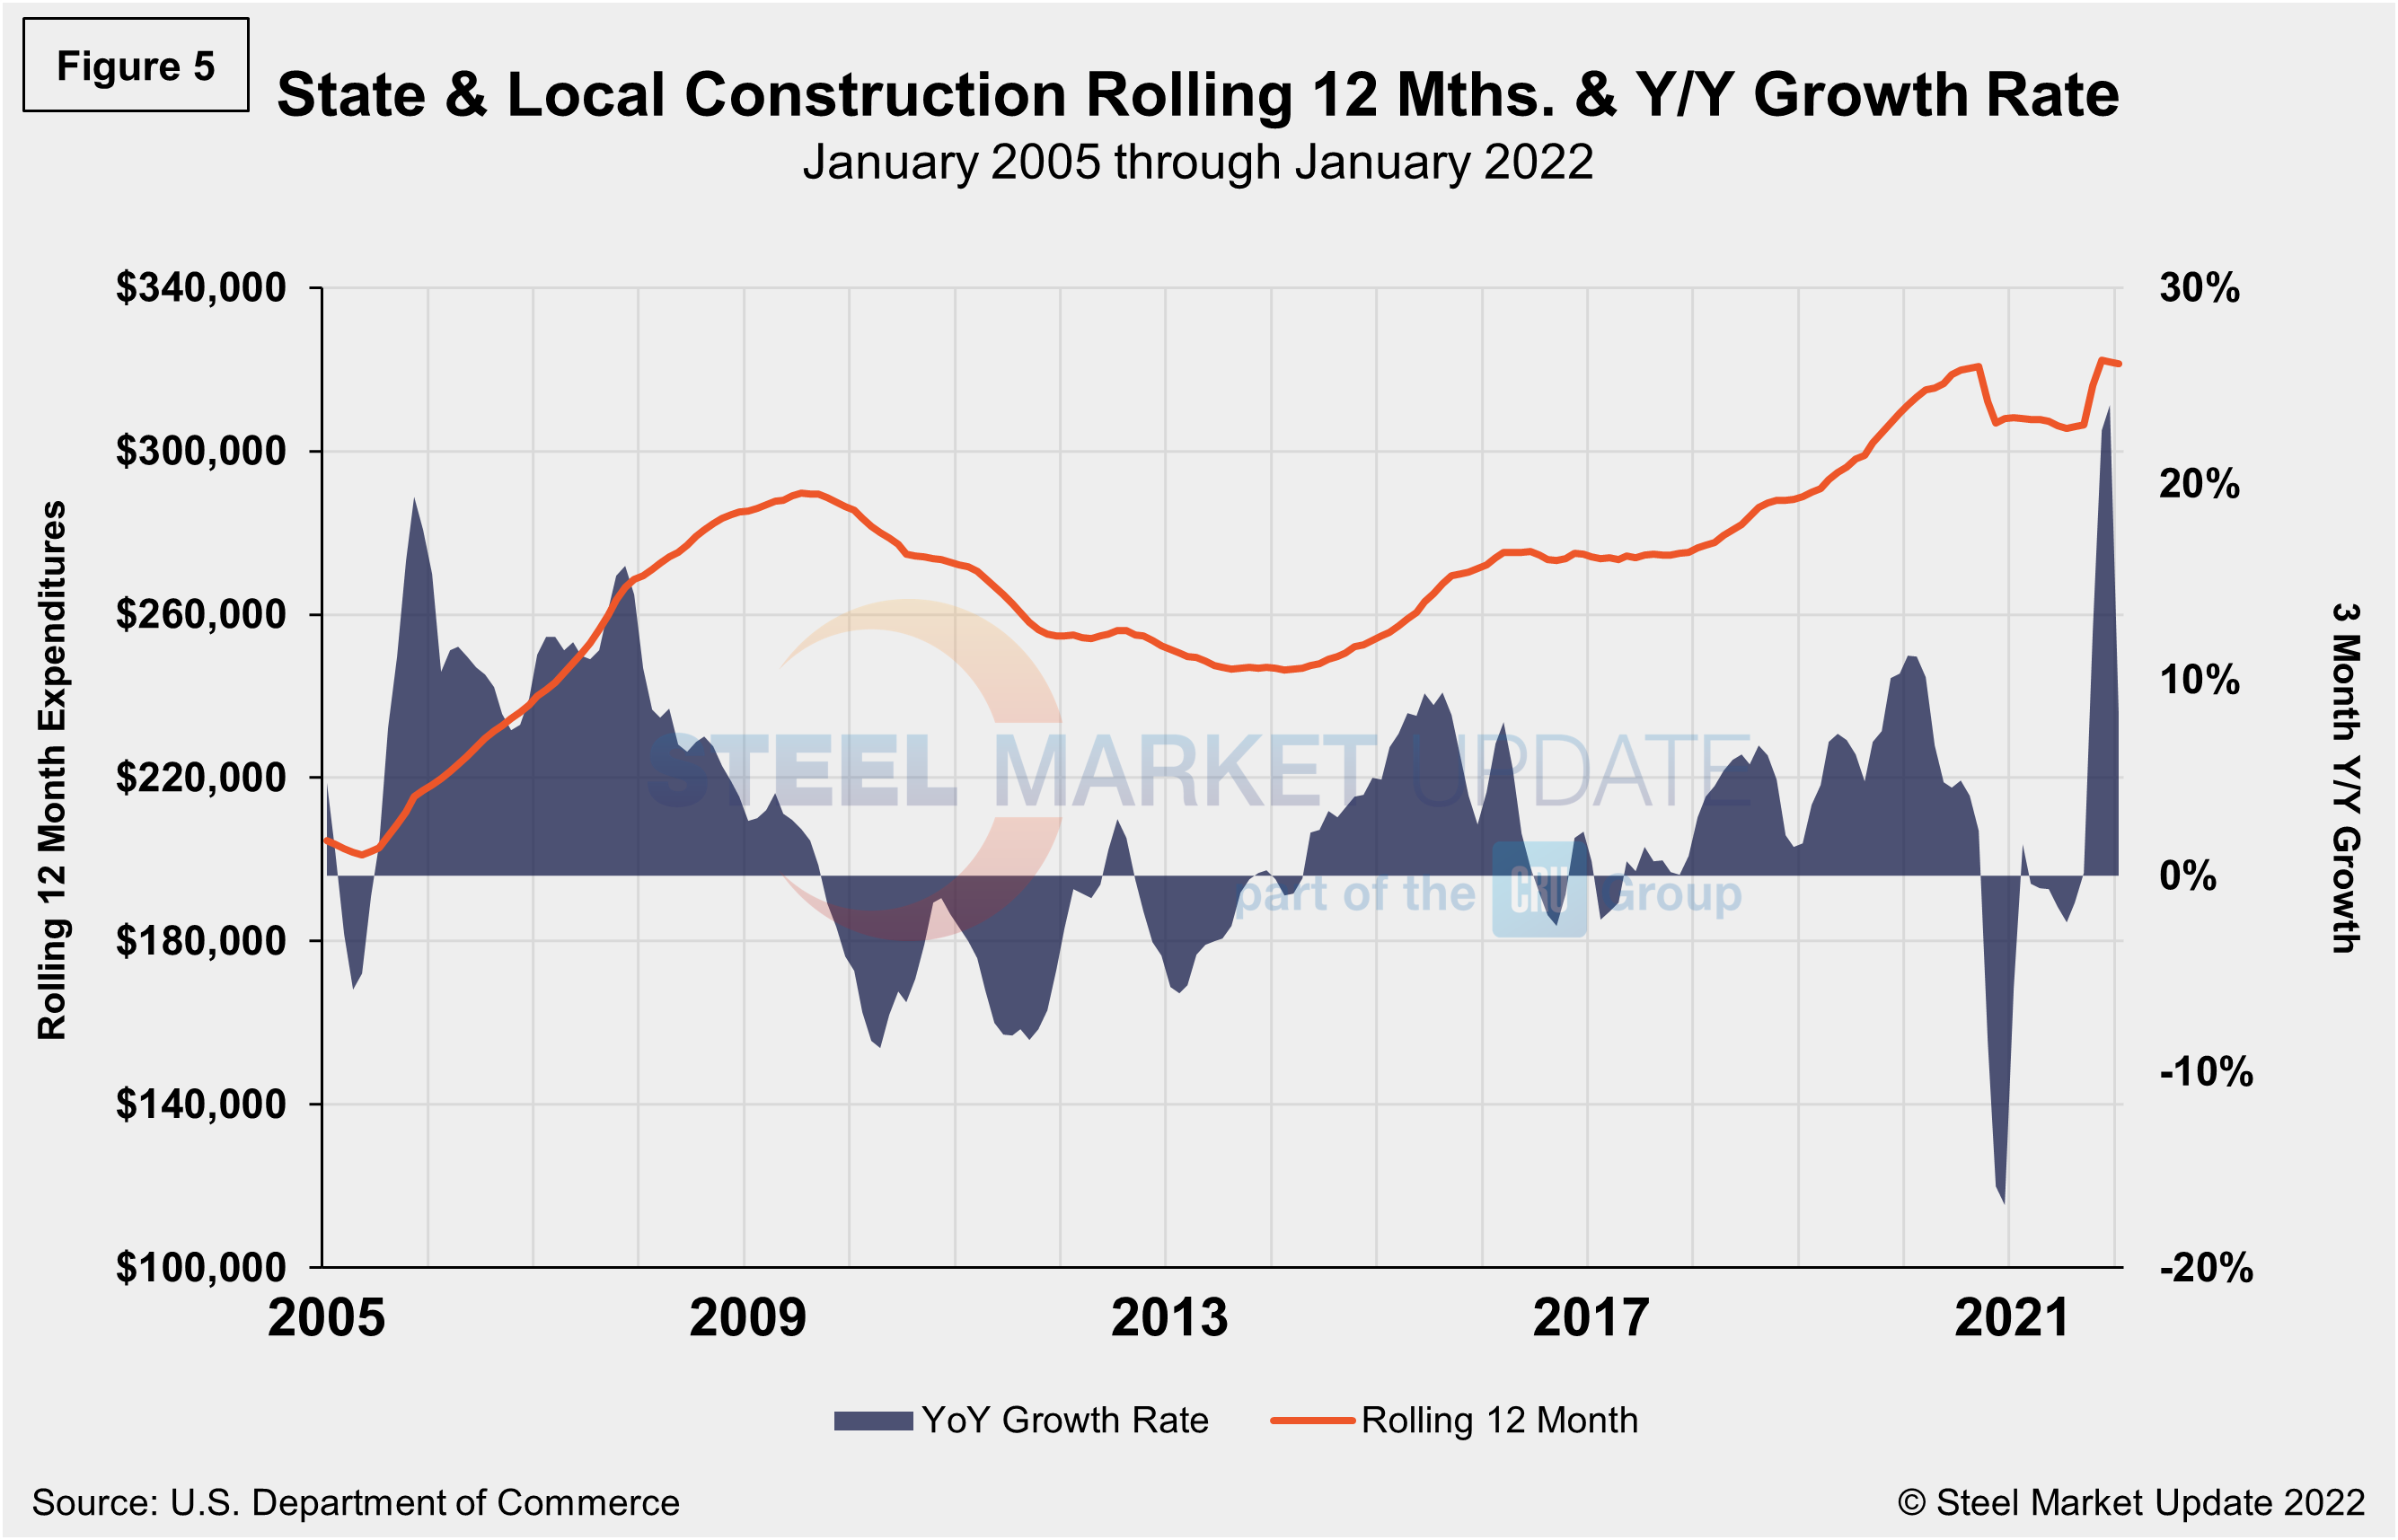
Publicly funded construction spending in January was $350.7 billion, at a seasonally adjusted rate, rising for the fourth straight month, and 0.6% above the revised December estimate of $348.7 billion. Outlays on state and local government construction projects fell 0.5%, while federal government spending soared 13.8% (see table and Figure 5 below).
Educational construction was at a seasonally adjusted annual rate of $80.9 billion, virtually unchanged from the revised December estimate of $81.0 billion. Highway construction was at a seasonally adjusted annual rate of $105.3 billion, 0.1% below the revised December estimate of $105.5 billion.
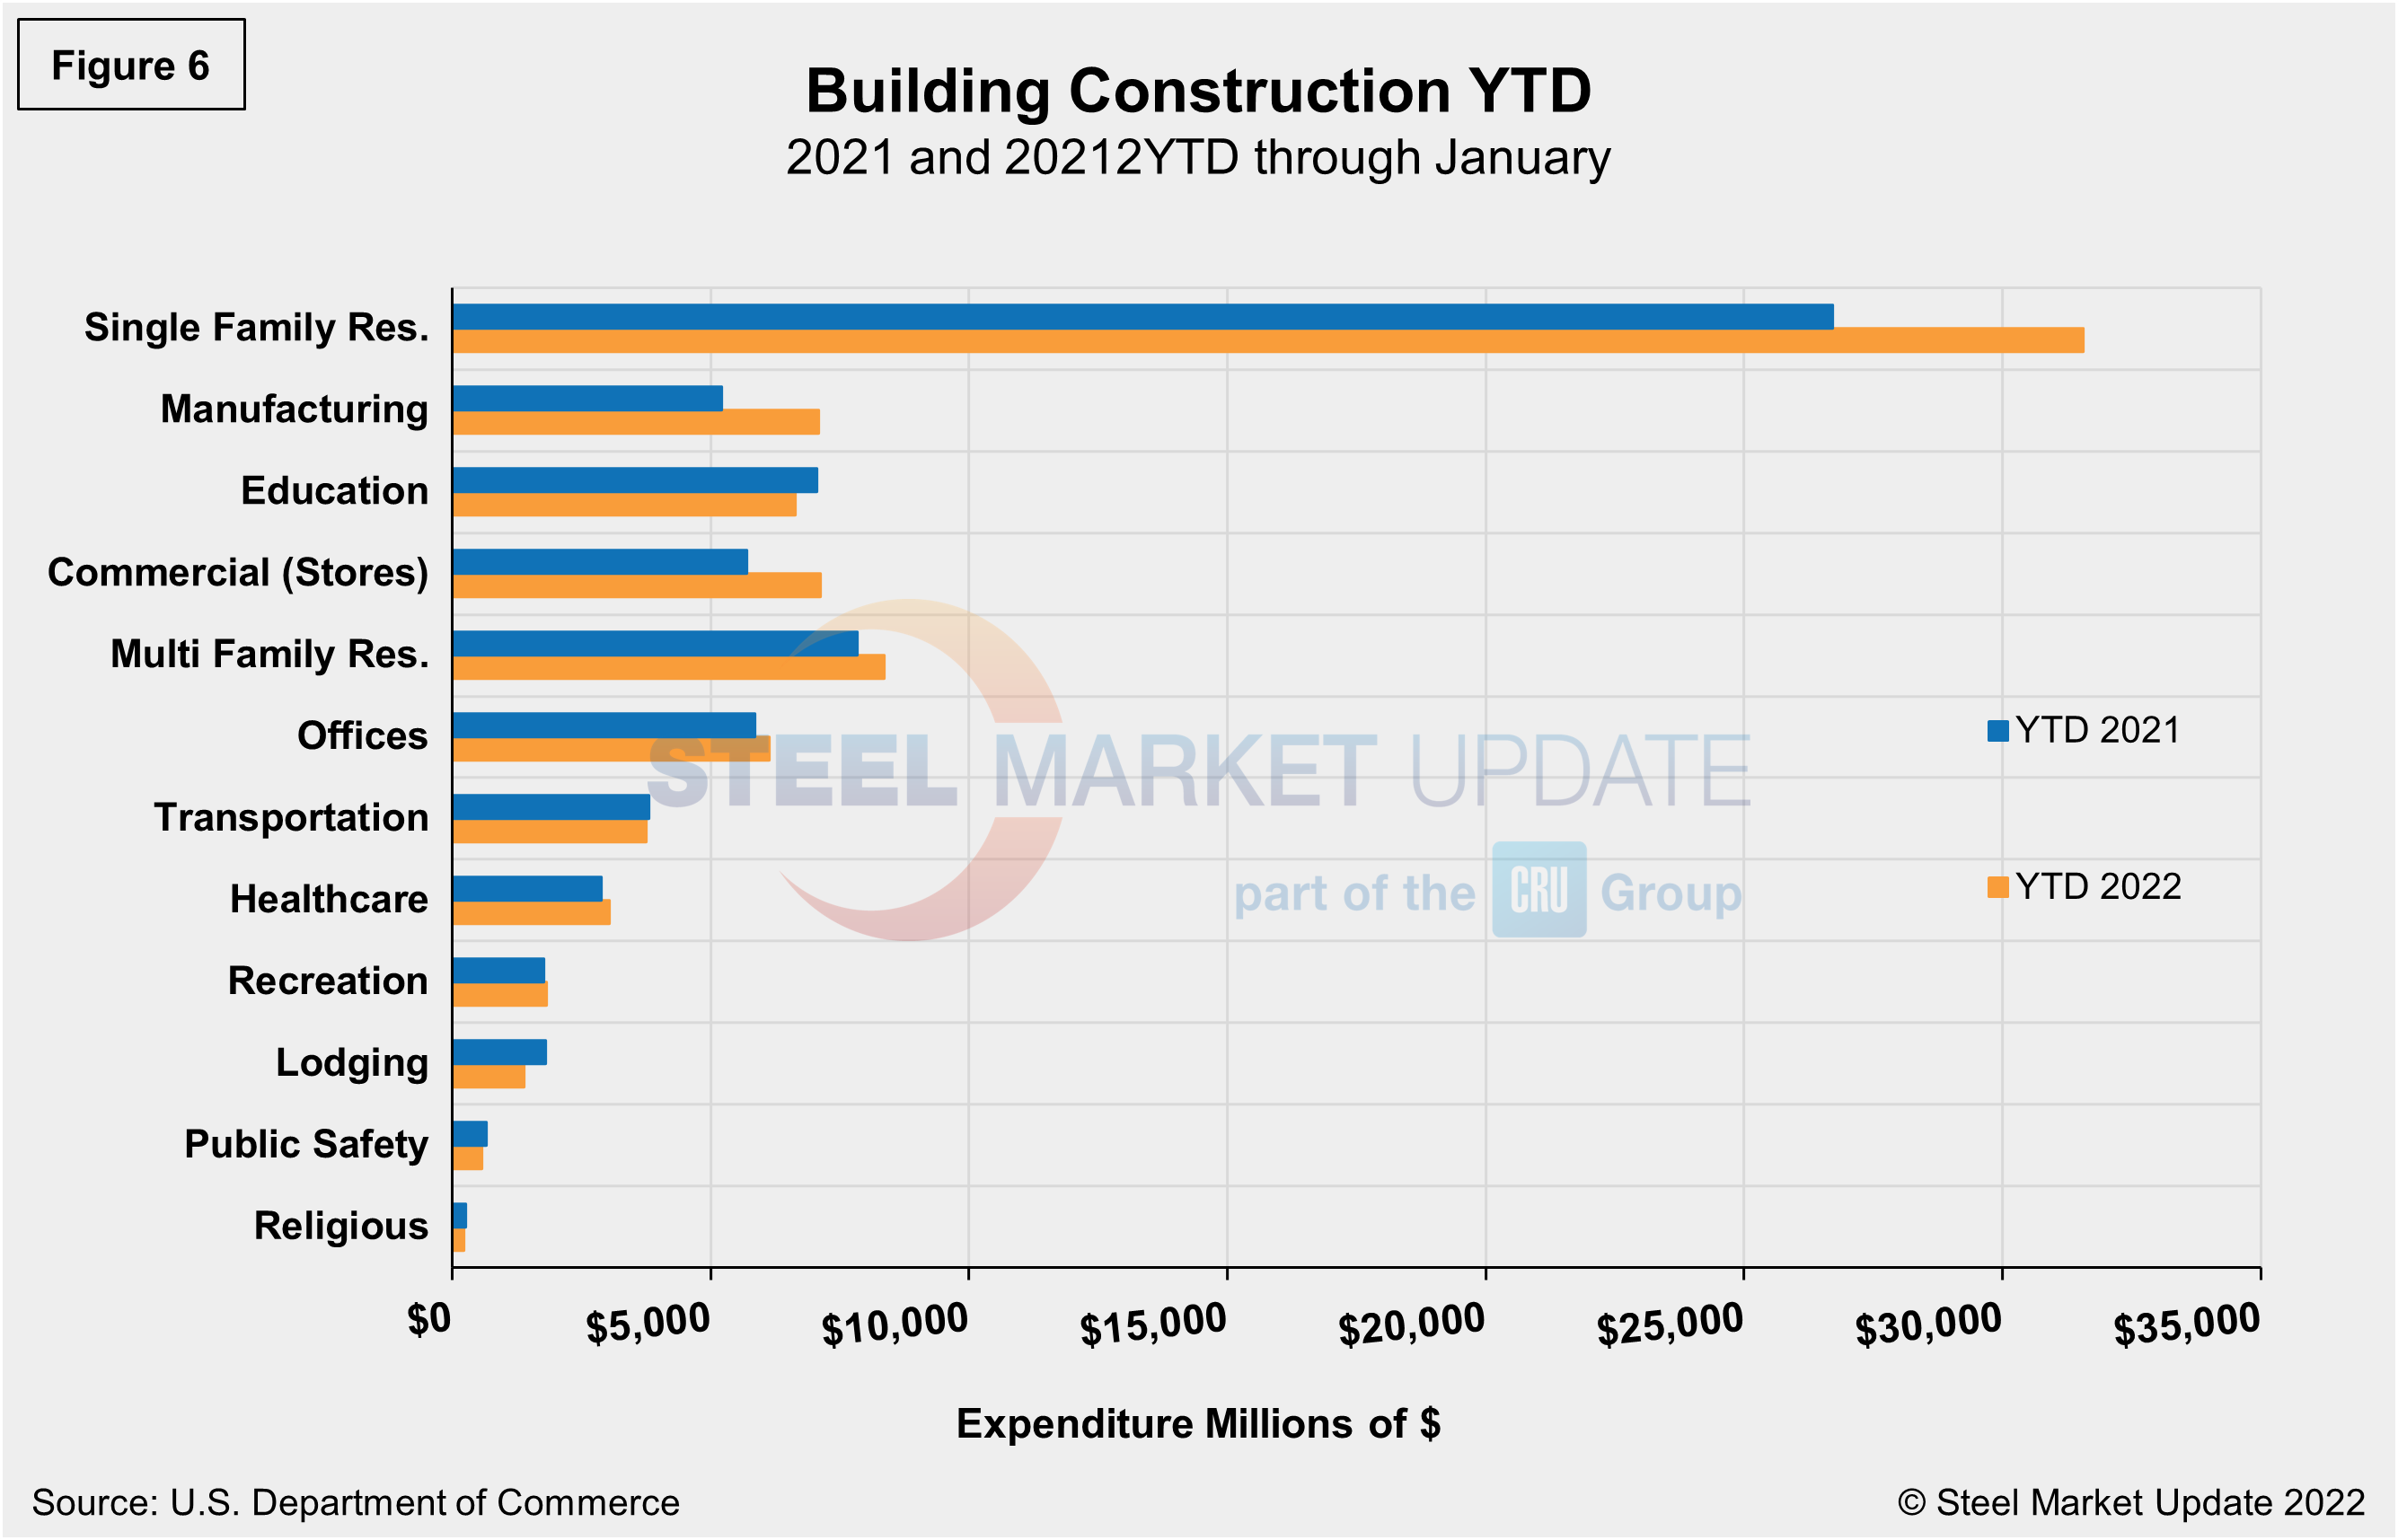
Year-to-date expenditures for construction of the various building sectors for 2021 and 2022 are compared in Figure 6. Single-family residential construction was dominant in 2021 with expenditures totaling $409.9 billion. The trend has continued in 2022 as single-family residential totaled $31.55 billion in January, 18.1% above the $26.72 billion seen a year ago. In terms of year-ago growth, manufacturing at 35.9% saw the strongest subsector growth versus the prior year, followed by commercial at 24.9%. Multifamily residential grew by 6.5% and totaled $8.35 billion when compared to the same year-ago period. Lodging is behind by double digits at 22.8% year on year, followed by recreation and public safety, both down 14.4%.
Explanation: Each month, the Commerce Department issues its Construction Put in Place (CPIP) data, usually on the first working day covering activity one month and one day earlier. There are three major categories based on funding source: private, state and local, and federal. Within these three groups are about 120 subcategories of construction projects. SMU analyzes the expenditures from the three funding categories to provide a concise summary of the steel-consuming sectors.
By David Schollaert, David@SteelMarketUpdate.com


