

Market Data

March 4, 2022
U.S. Job Creation Accelerates in February
Written by David Schollaert
U.S. job growth accelerated in February, as falling Omicron cases brought customers back to business and workers back off the sidelines. Employers added 678,000 jobs last month, topping economists’ forecasts for a second straight month and bringing the unemployment rate down to 3.8%, according to the Labor Department.
Job openings are near a record high, the biggest gain in seven months. Layoffs are at a new low, yet the U.S. economy still has roughly two million fewer jobs than it did before the pandemic resulted in mass layoffs two years ago. Despite the gains, some workers remain sidelined by health concerns, childcare problems, or other factors. The result: companies still report having trouble finding enough staff to meet demand.
More than 300,000 people joined the workforce, as the hospitality industry – among the hardest-hit sectors during the pandemic because of the sharp drop in travel – accounted for a quarter of the new jobs across the U.S. in February, as firms sought to accommodate a growing number of vacationers, convention attendees, and business travelers. As COVID-related restrictions are being lifted, a further boost in business and hiring is expected.
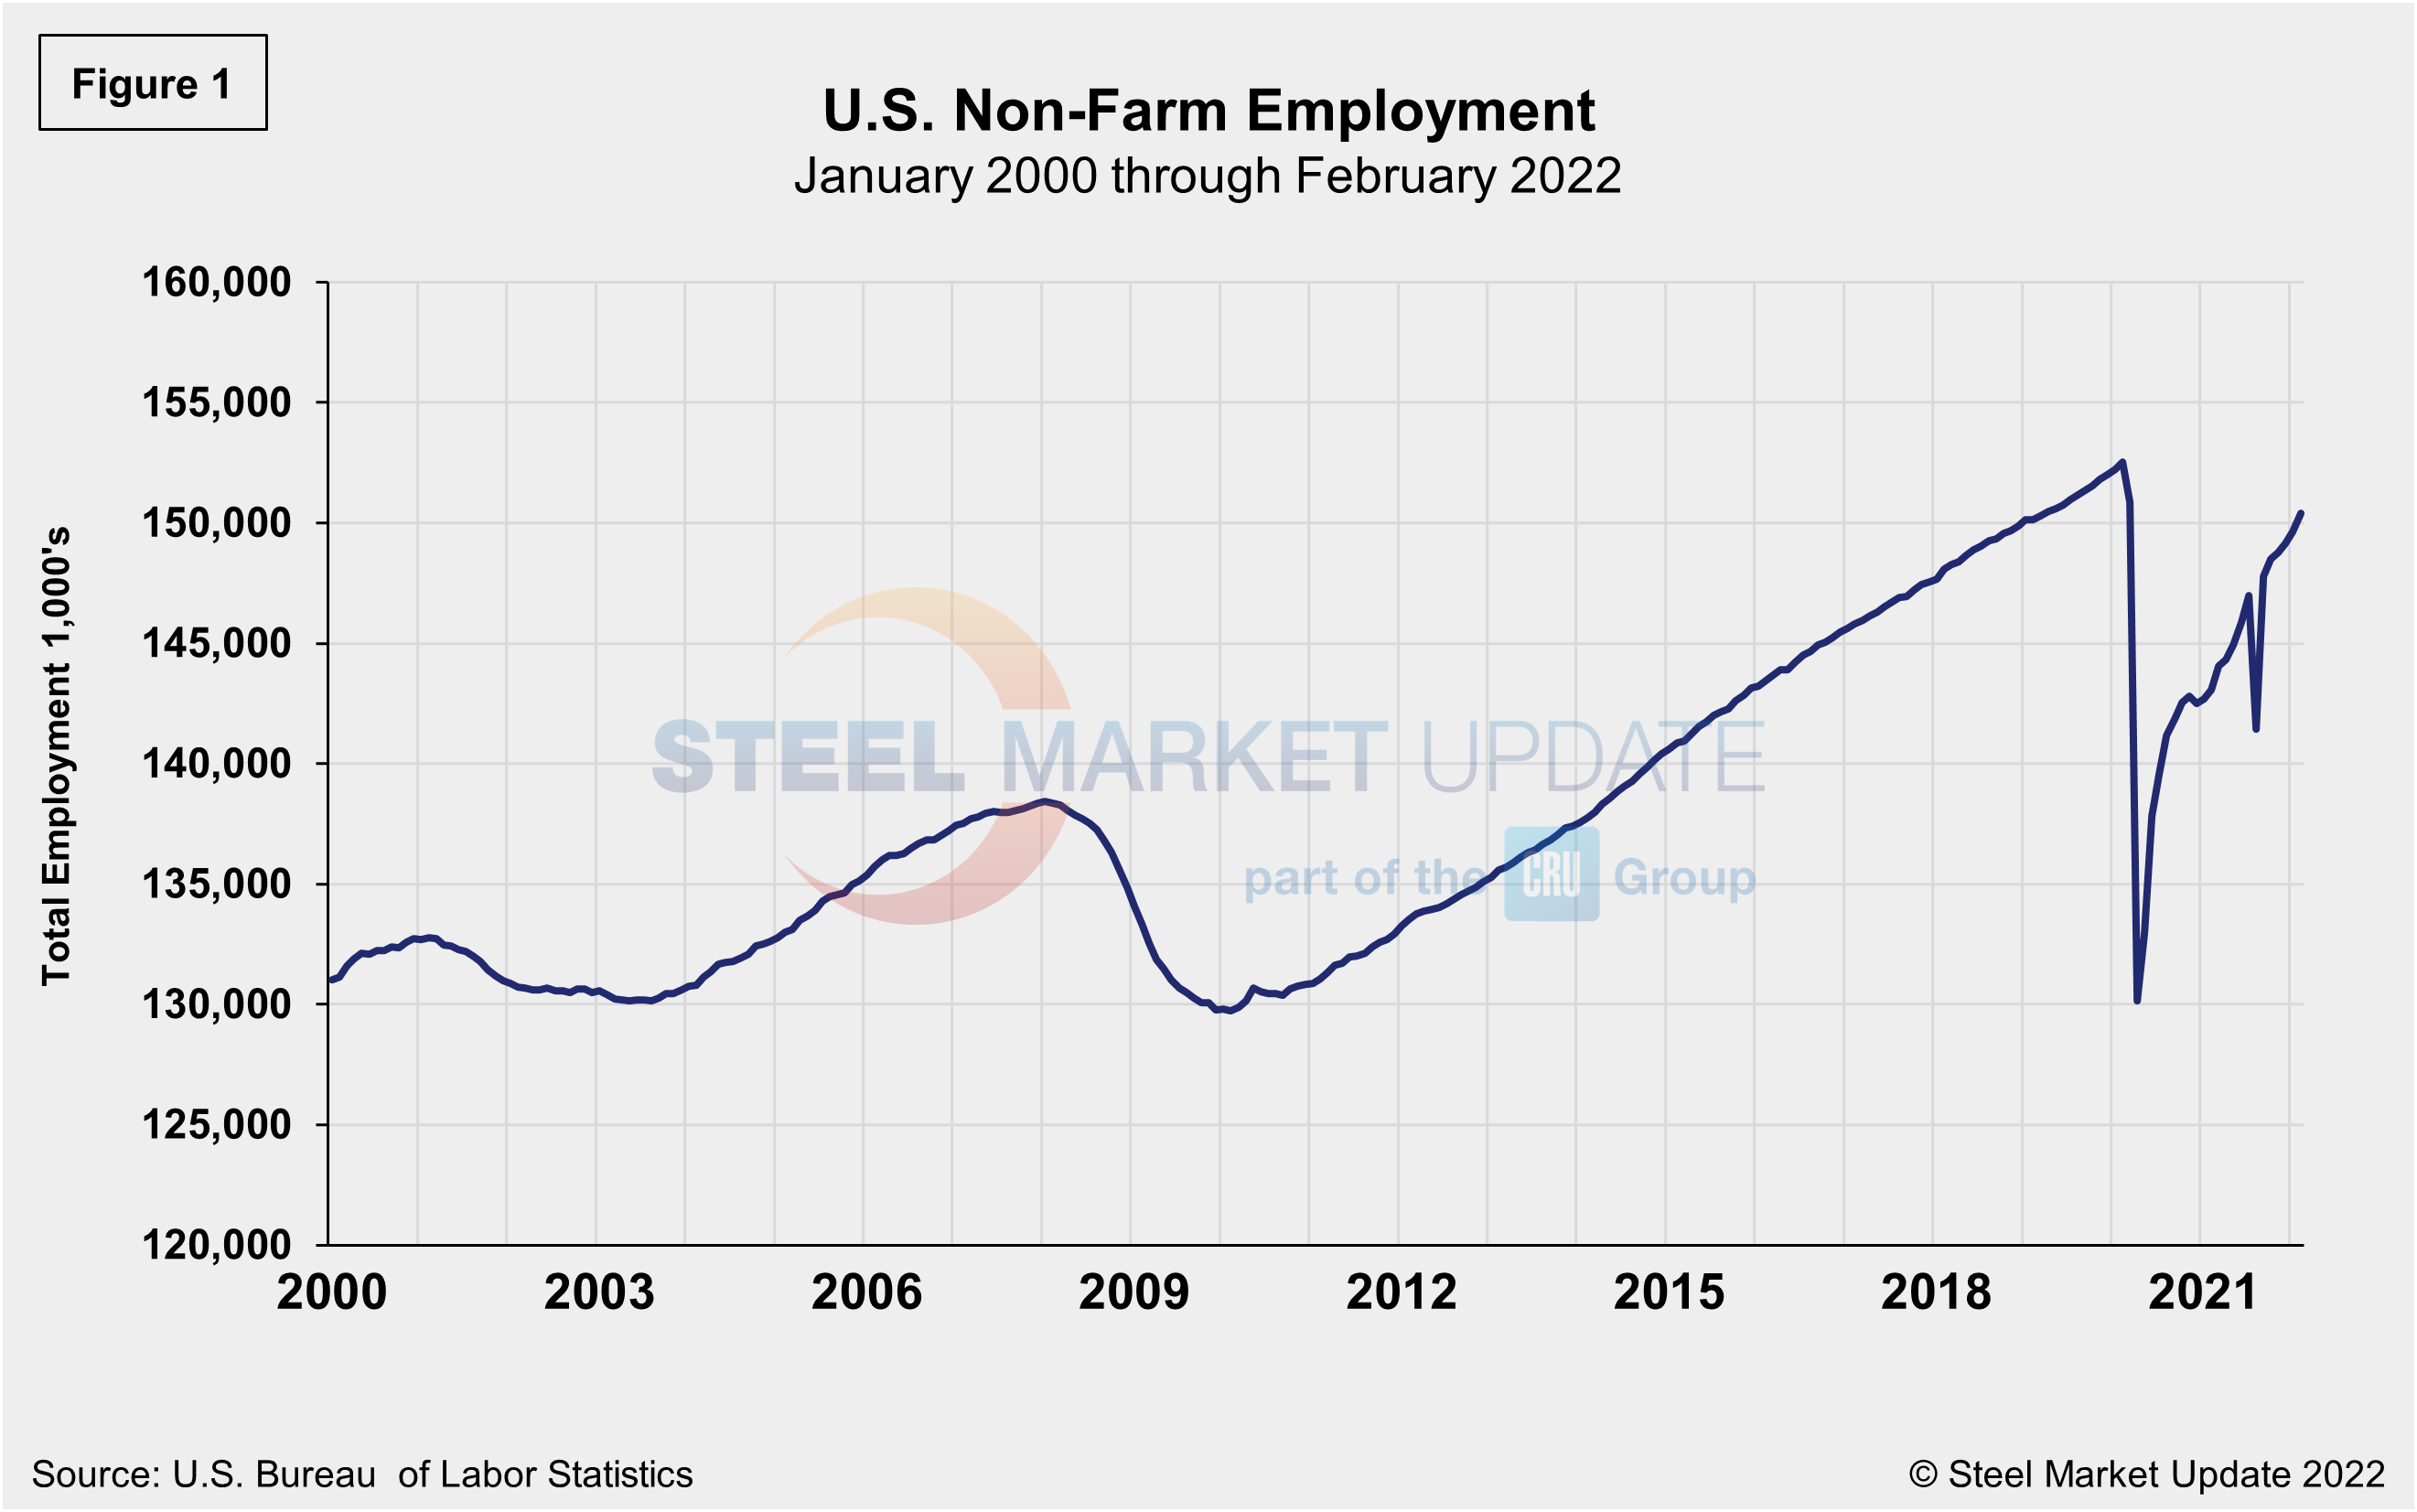
The labor force participation rate reached 62.3%, the highest pandemic-era total and the top measure since March 2020. Figure 1 shows the total number of nonfarm workers employed in the U.S. since 2000.
The number of long-term unemployed (out of work for at least 27 consecutive weeks) was essentially unchanged at 1.7 million in February versus January. That figure accounted for 26.7% of the total unemployed in the month. This measure is down from a recent high of 4.0 million last year but is 581,000 higher than in February 2020.
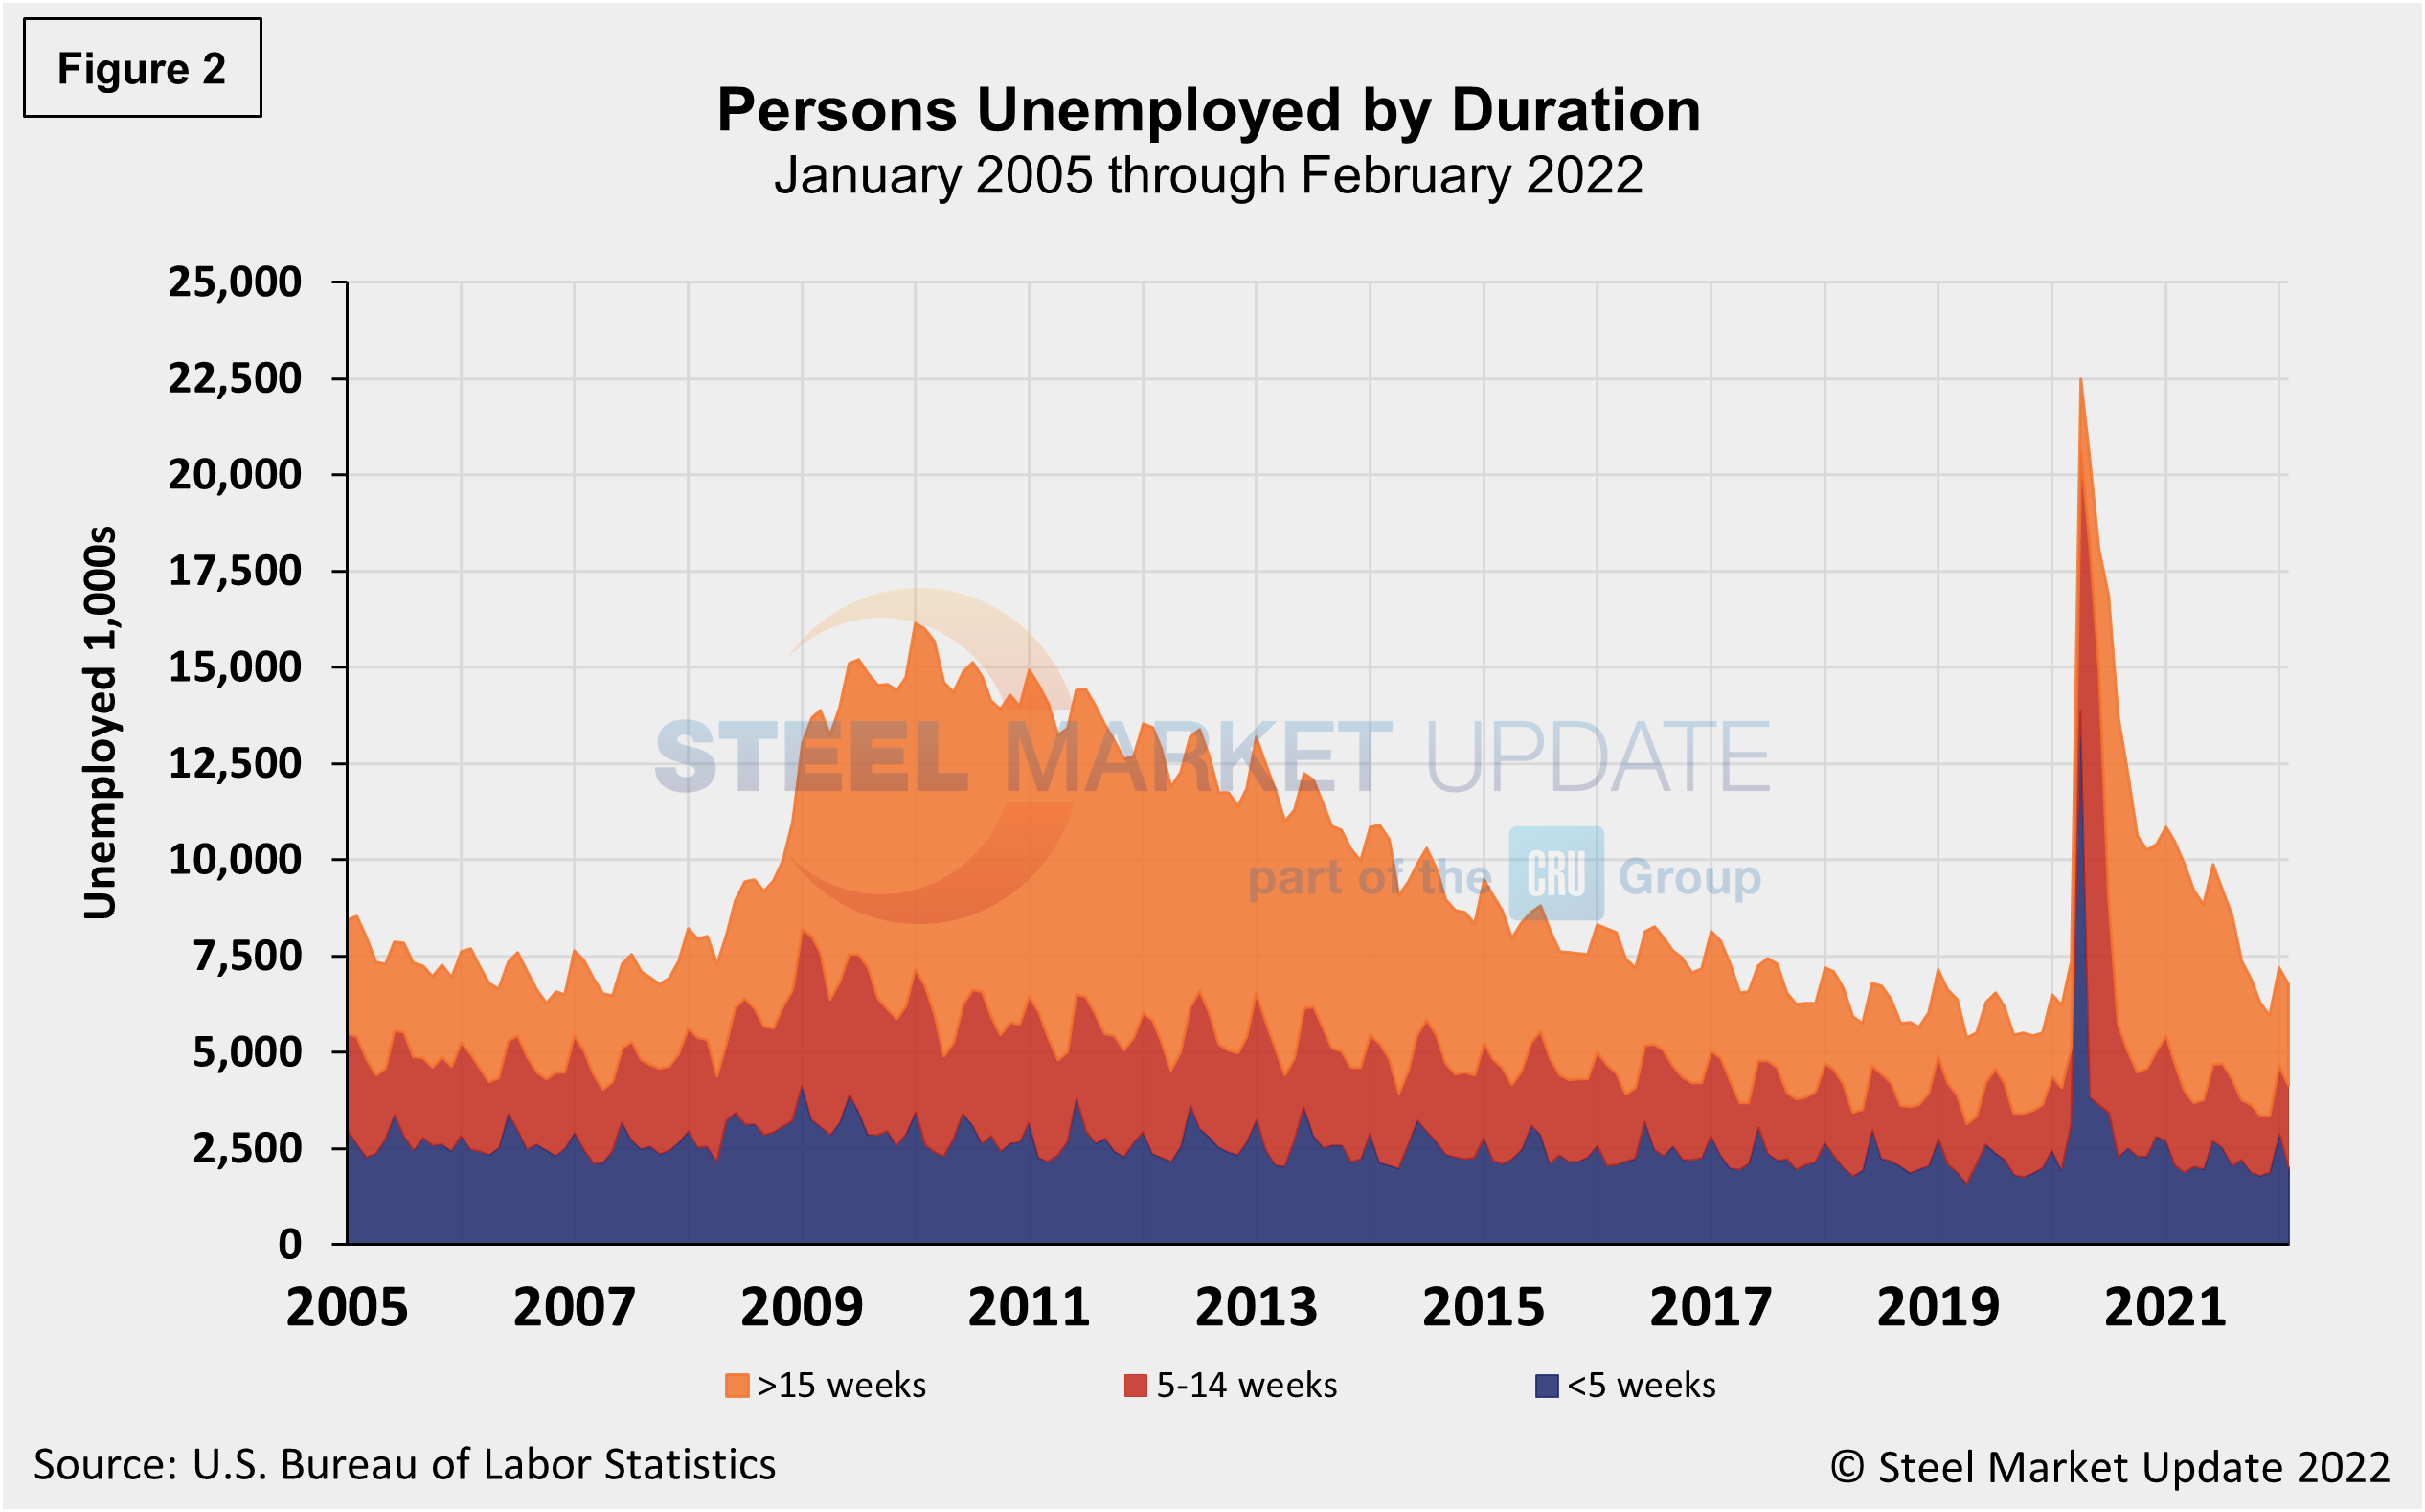
The historic picture for the duration of unemployment since January 2000 is broken down into <5 weeks, 5 to 14 weeks, and >15 weeks in Figure 2. The total number unemployed was 6.782 million at the end of February, a decrease of 425,000 compared to January. The result pushed the unemployment total above pre-pandemic levels by about 588,000 people, while roughly 15.722 million more now have jobs compared to the 22.5 million thrown out of work during the worst of the pandemic in April of 2020. As of Mar. 4, 39.0% had been unemployed for more than 15 weeks, 31.8% for 5 to 14 weeks, and 29.2% for less than 5 weeks.
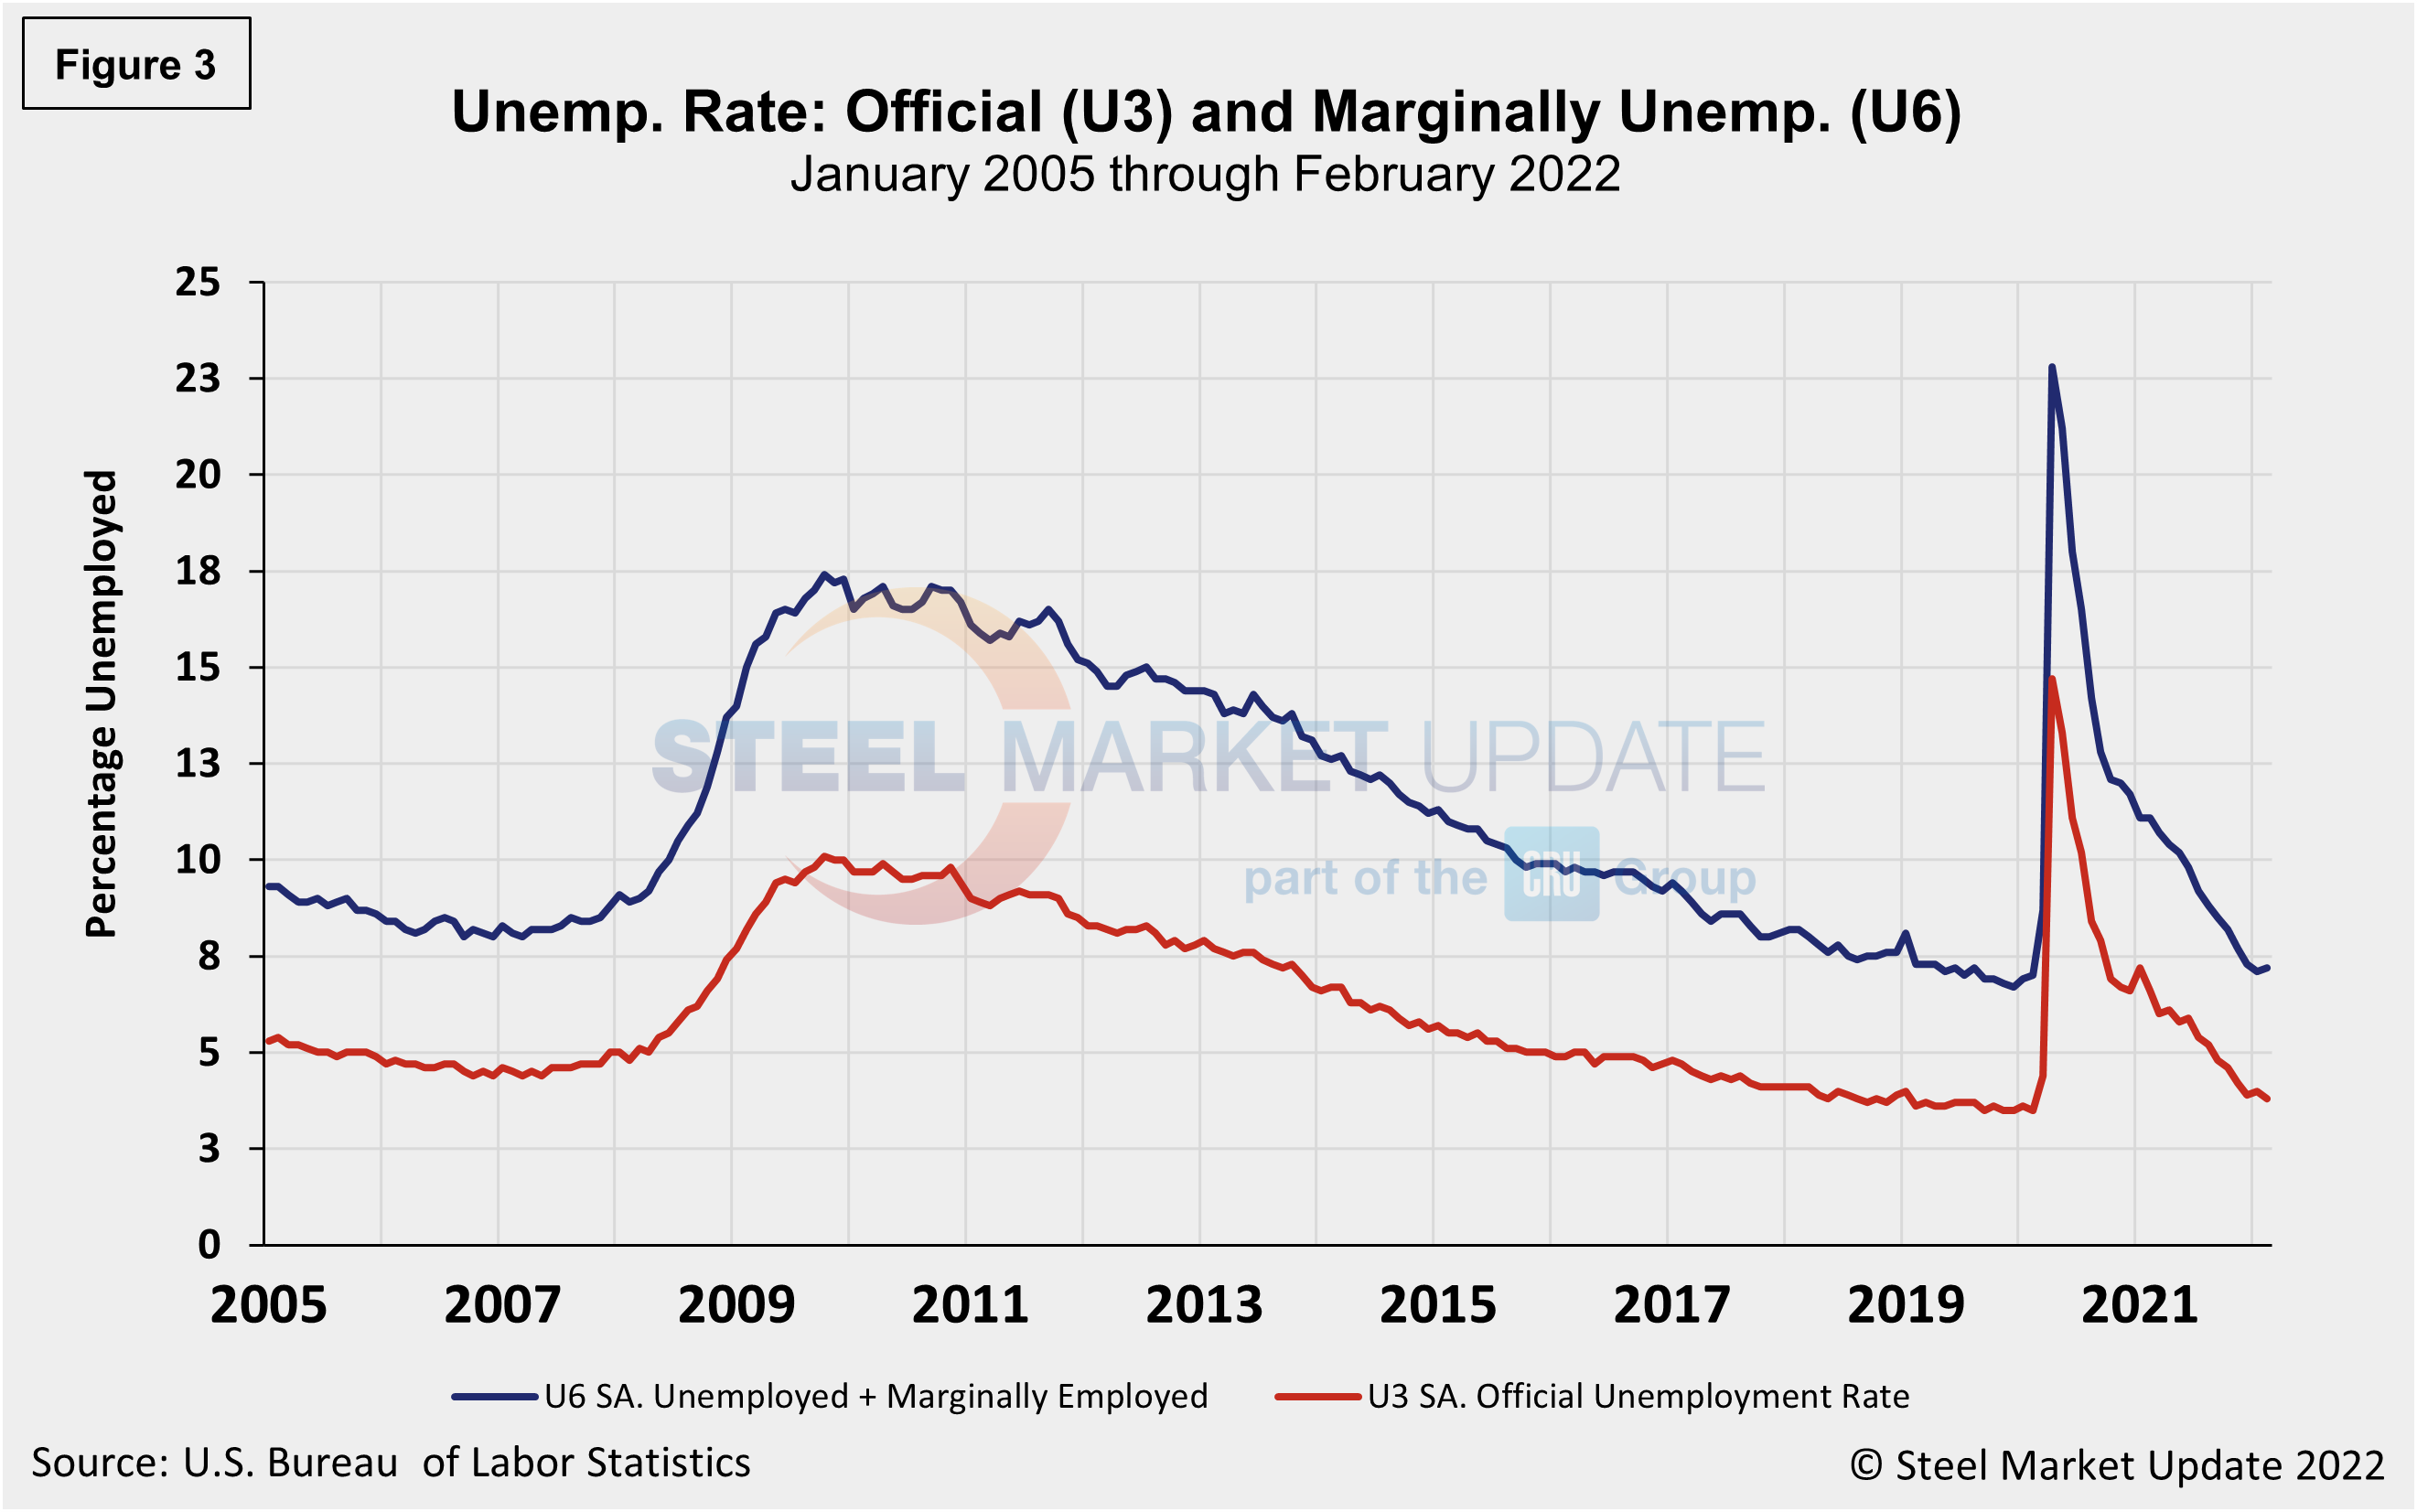
The official unemployment rate, U3, reported in the BLS Household survey (see explanation below) increased from 3.5% in February 2020 to 14.7% in April 2020. Since then, it has trended down at a slow pace, bottoming out at 3.9% in December. January’s increase to 4.0% marked the first gain in 21 months, but February’s decline to 3.8% is the lowest mark in two years. U6, a more encompassing measure of unemployment that includes discouraged workers and those holding part-time jobs for economic reasons, grew in February to 7.2% from 7.1% (Figure 3).
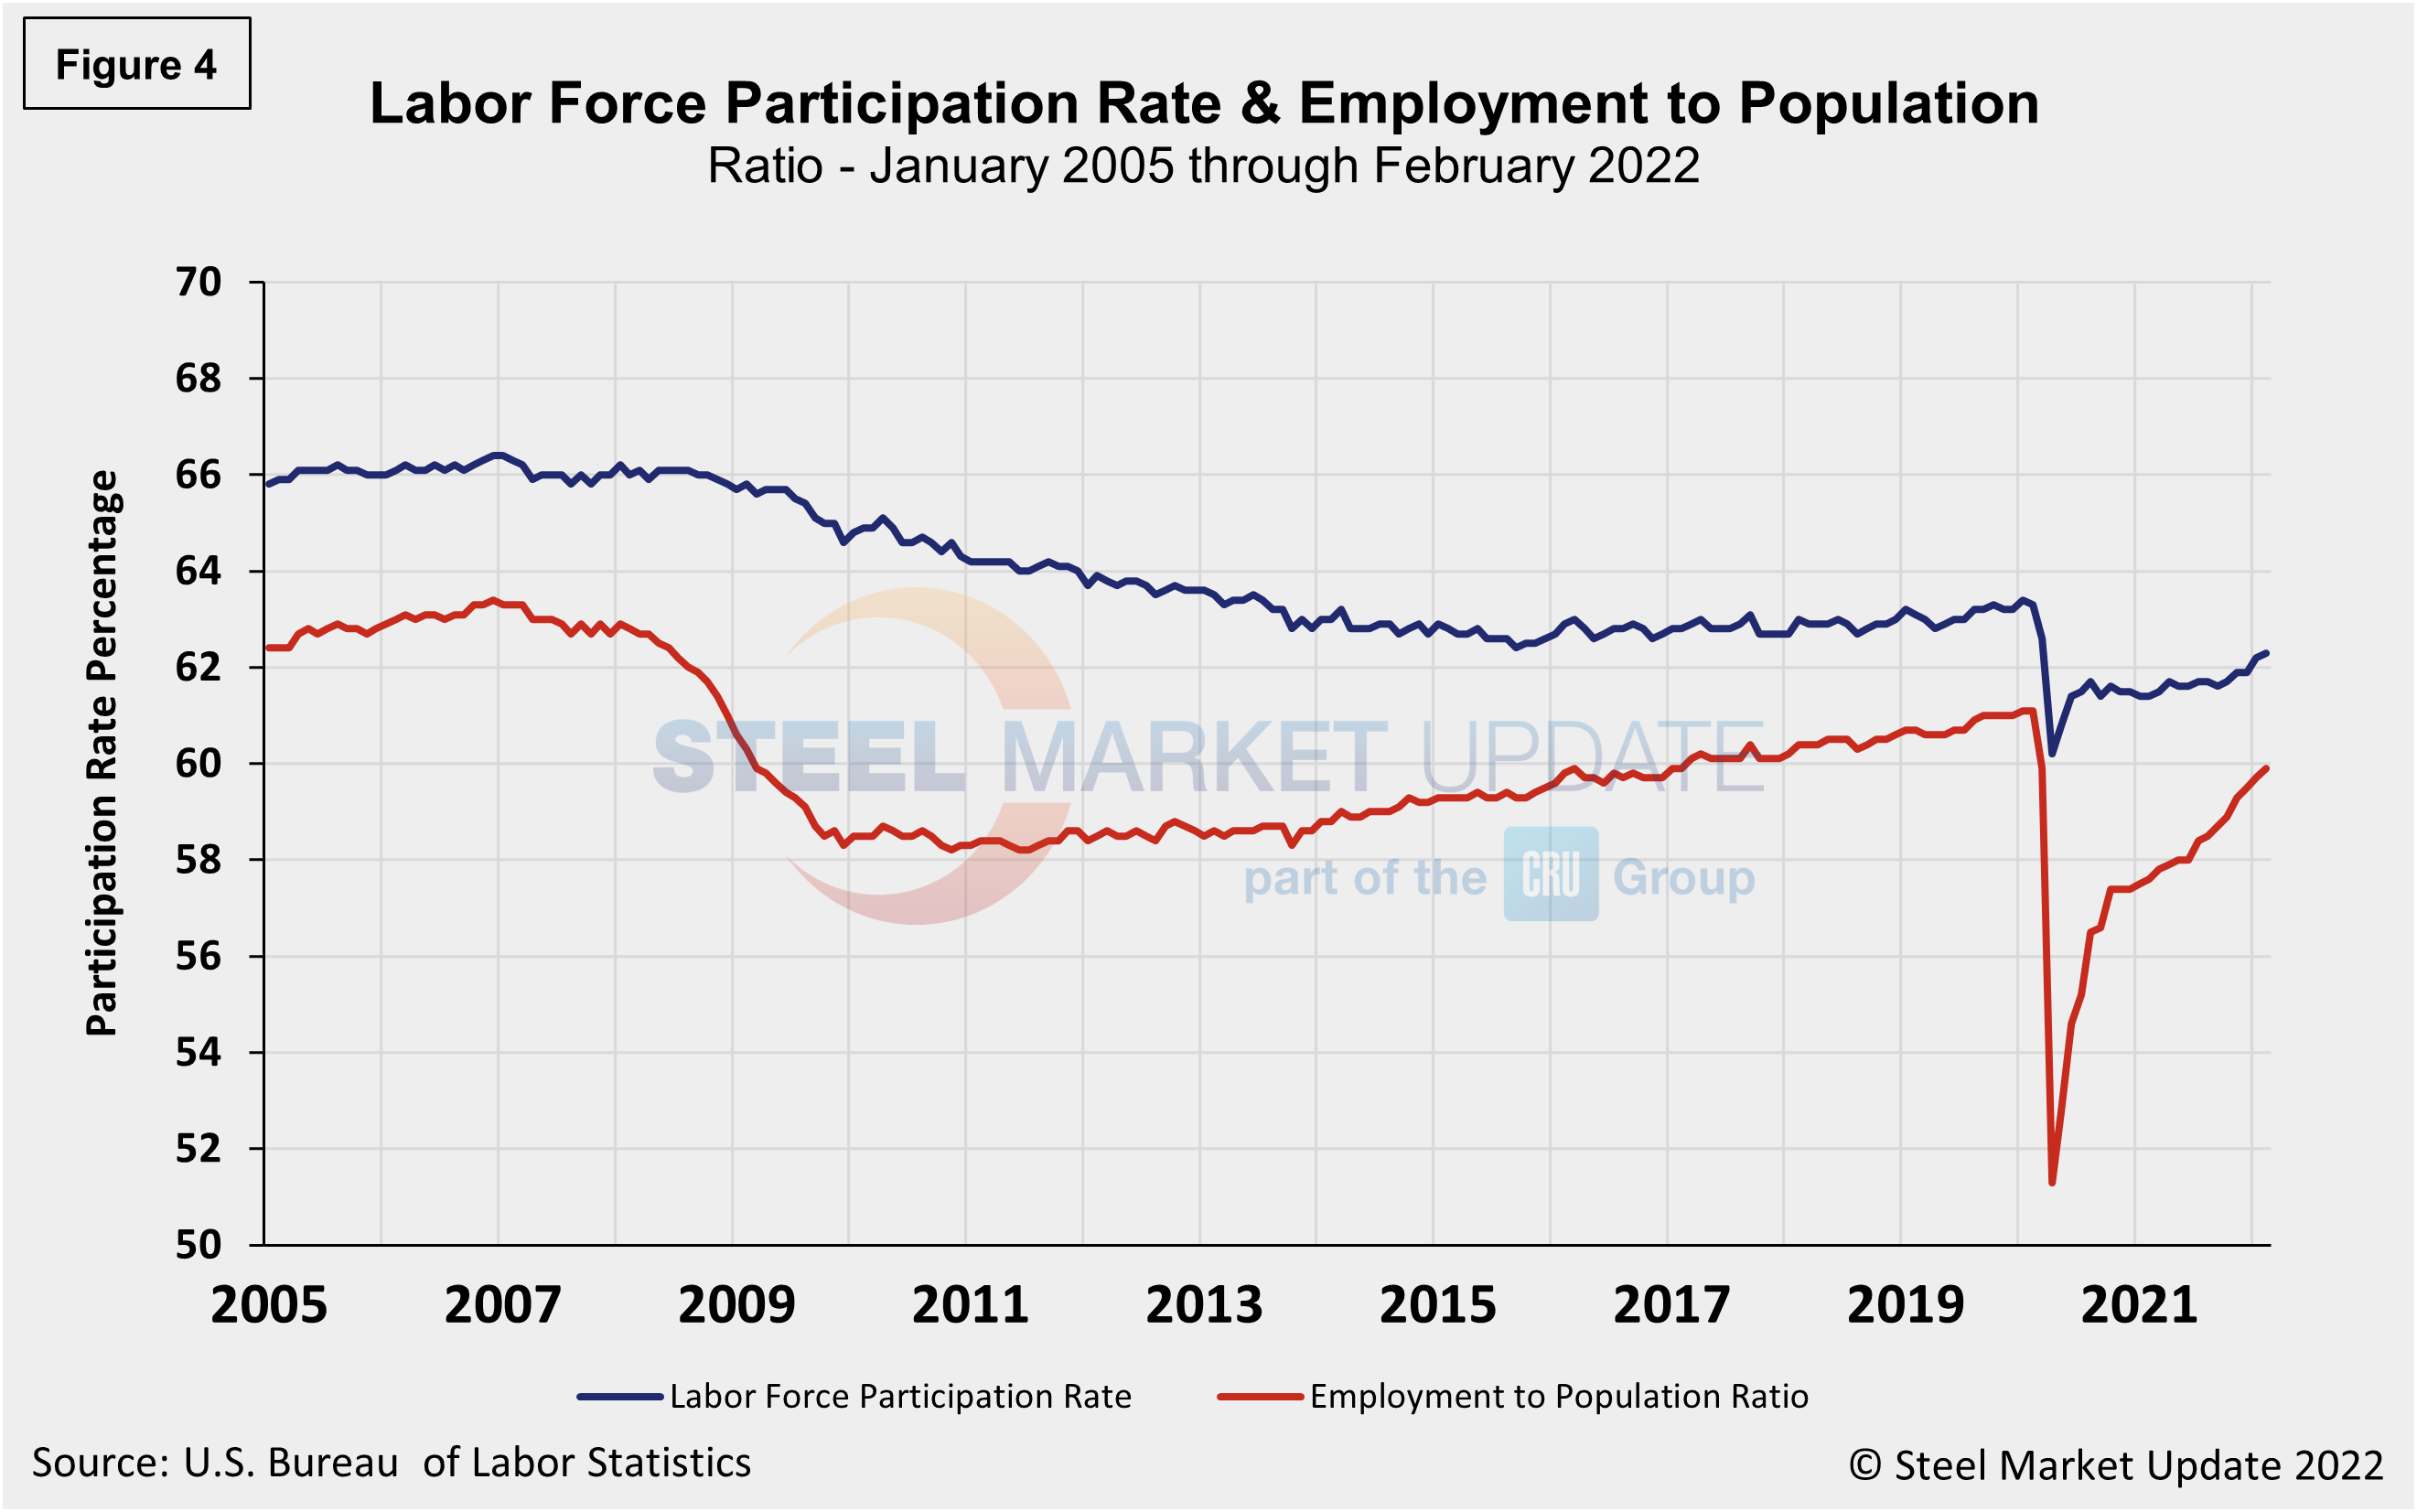
Another gauge, and more definitive view, are the number employed as a percentage of the population. Last month, the employment-to-population ratio was 59.9%, a marginal increase from January when the ratio was 59.7%, highlighting the challenges many companies continue to report in filling openings. Figure 4 shows both measures on one graph.
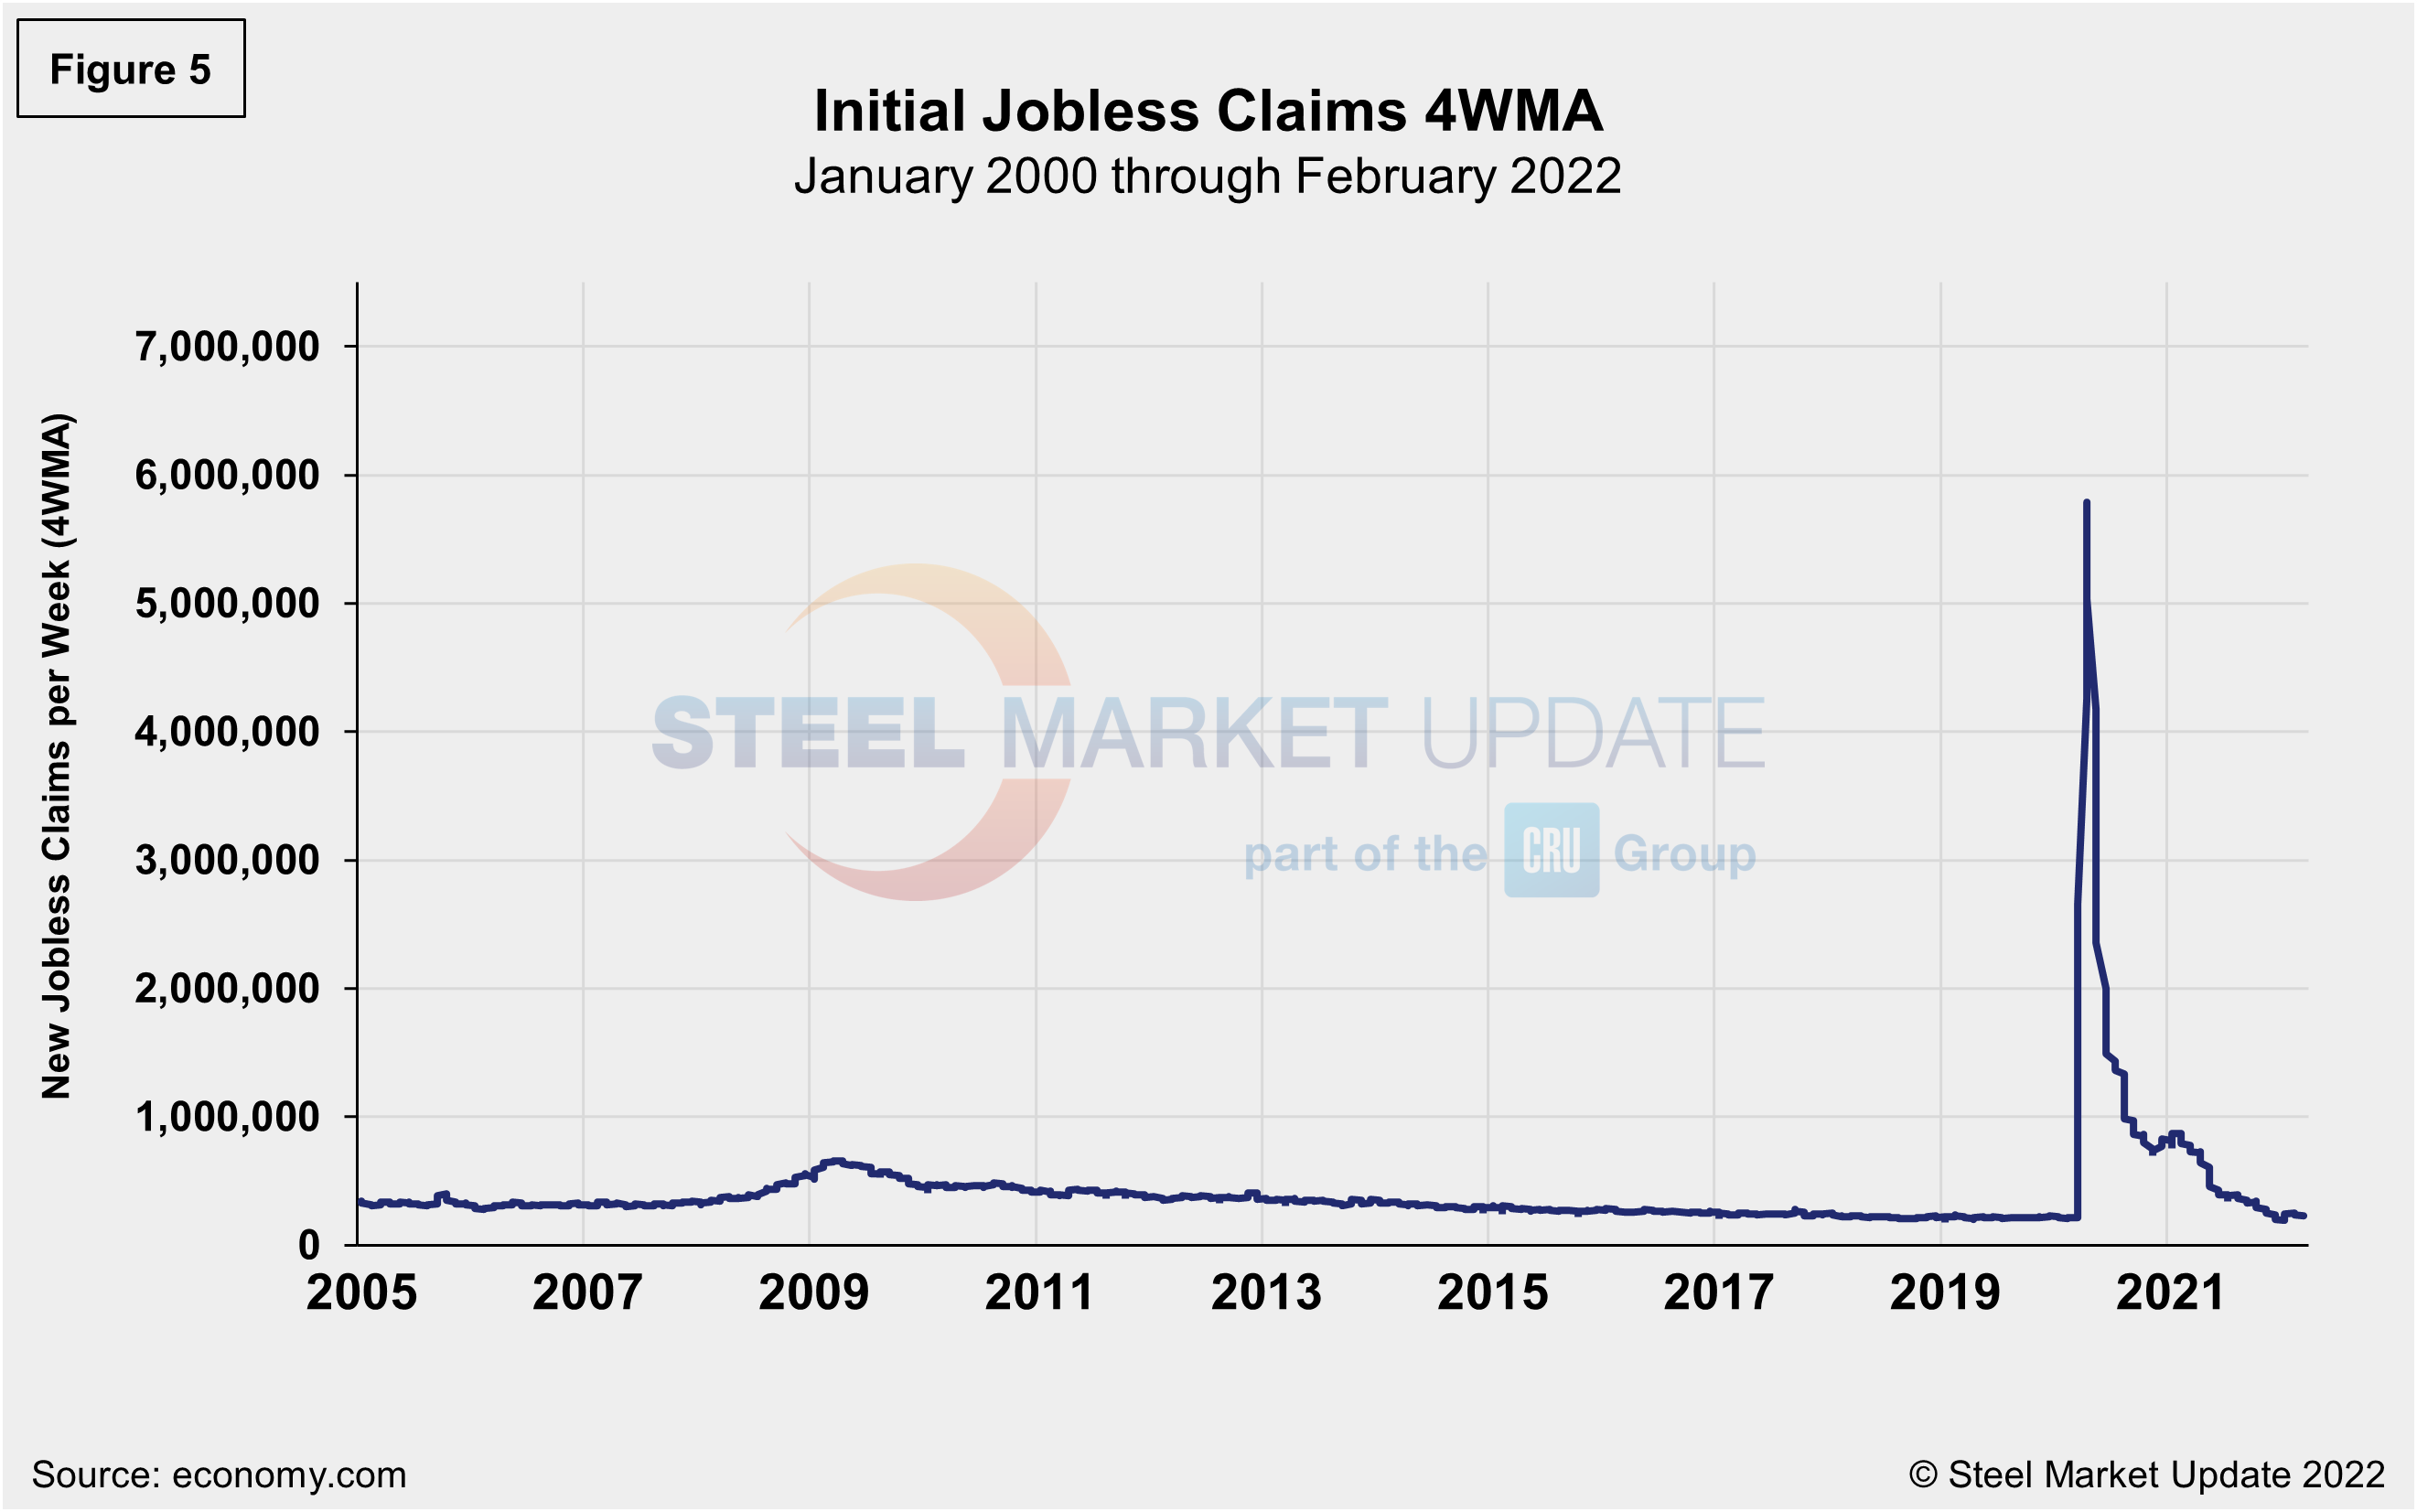
Initial claims for unemployment insurance, which are reported weekly by the Department of Labor, fell by 17,000 to 229,000 in the week ended Mar. 4, following a 16,000 decrease the week prior.
“U.S. initial claims for unemployment insurance are falling again following a temporary Omicron-related increase. New filings dropped to 215,000 in the week ended February 26, down from a revised 233,000 in the prior week and surpassing expectations for a more modest decline,” reported Economy.com. “This is still elevated relative to the cycle low of 188,000 reached in early December. Continuing claims were nearly unchanged at 1.476 million in the week ended February 19, while the insured unemployment rate also held steady at 1.1%.”
The recent change in initial claims continues to underscore the struggles and inconsistencies facing the labor market. Figure 5 shows the four-week moving average of new claims since January 2005, seasonally adjusted.
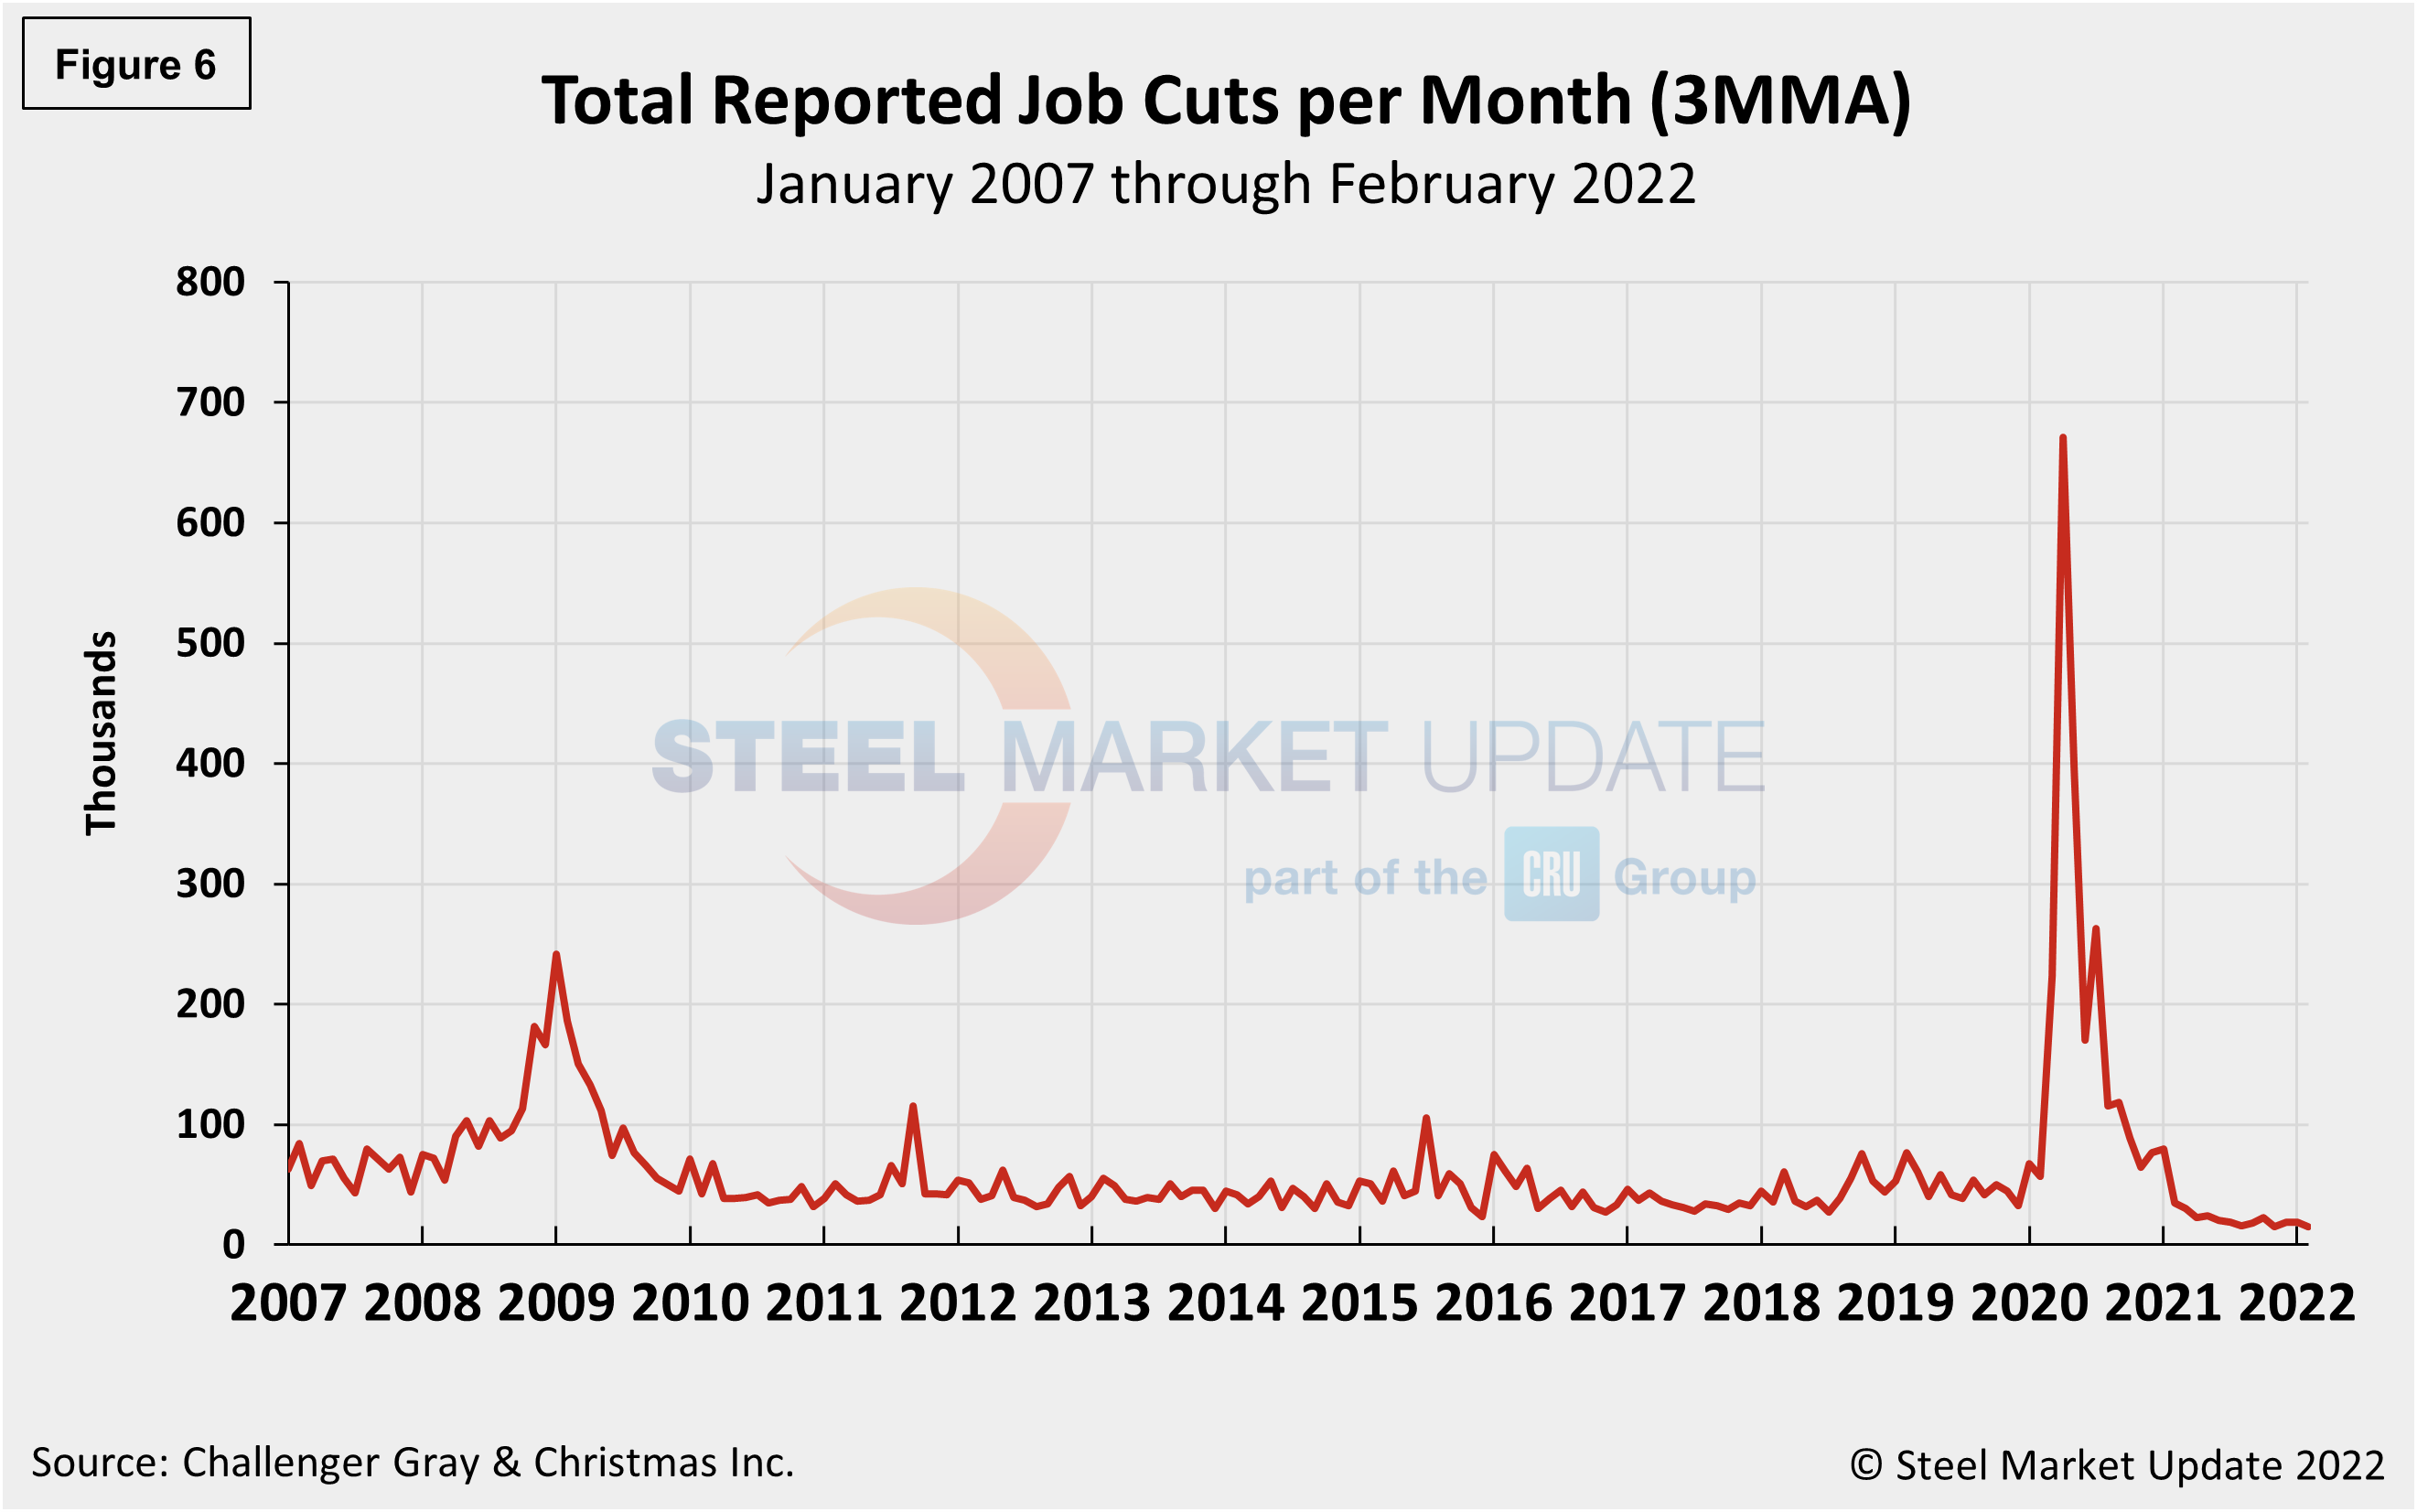
Human resources consulting firm Challenger, Gray and Christmas, Inc., produces a monthly employment update for the U.S. It reported that job cuts in February totaled 15,245, down 20.0% from 19,064 announced the prior month. February’s total is 56% lower than the same year-ago period when 34,531 cuts were announced, while employers have announced plans to hire 215,127 workers, the highest February total on record.
In the first two months of the year, employers announced 34,309 cuts, down 70% from the 114,083 cuts announced through February 2021. It is the lowest monthly total since June 1997, when 15,091 cuts were recorded. It is also the lowest January-February total since the firm began tracking job cuts in 1993. Figure 6 shows the monthly job cuts reported by Challenger on a 3MMA basis since January 2007.
“The latest numbers give more evidence that job creation is strong, and employers continue to hold fast to their workforces. The churn in the labor market is coming from resignations,” said Challenger. “While job cuts remain at record lows, employers in the United States announced 215,127 hiring plans, the highest monthly total since September 2021, when seasonal hiring pushed hiring plans to 939,790. It is the highest February total since Challenger began tracking monthly hiring figures in 2002.”
Retailers announced the highest number of hiring plans with 114,118, followed by entertainment/leisure with 22,369. The government announced plans to hire 17,266, while the automotive sector announced 14,486.
“Semiconductor chip shortages and supply chain issues still plague automakers and manufacturers. That said, the pivot to electric vehicles is driving hiring in the sector,” added Challenger. “Ford announced it was halting production for one week at a plant in Kansas City due to semiconductor shortages. The war being fought in Ukraine will have an additional impact on supply chains.”
Explanation: On the first Friday of each month, the Bureau of Labor Statistics releases the employment data for the previous month. Data is available at www.bls.gov. The BLS reports on the results of two surveys. The Establishment survey reports the actual number employed by industry. The Household survey reports on the unemployment rate, participation rate, earnings, average workweek, the breakout into full-time and part-time workers and lots more details describing the age breakdown of the unemployed, reasons for and duration of unemployment.
By David Schollaert, David@SteelMarketUpdate.com


