

Analysis

March 20, 2022
North American Auto Assemblies Expand in February
Written by David Schollaert
North American auto assemblies grew by 8.0% in February, expanding for the second straight month despite ongoing supply hurdles. Though last month’s production was 2.2% higher year on year, it was 21.1% below the same pre-pandemic period in 2020.
Despite February’s production gains, the industry was met with strong supply-related headwinds. The ongoing supply-chain and microchip shortages that have hampered the auto industry for nearly two years were exacerbated by a week-long border protest over vaccine mandates that blocked travel across the Ambassador Bridge to Canada, a key supply route for the North American automotive industry.
North American vehicle production, including personal and commercial vehicles, totaled 1.120 million units in February, up from the downward revised January total of 1.037 million units. Though improved, North American automotive assembly totals are still well behind pre-pandemic totals. Last month’s total was down from 1.419 million units produced in February 2020.
Though much of what crippled automakers in 2021 has passed, semiconductor readiness and supply-chain restrictions carry on and are expected to delay carmaking well into the summer months. Vehicle inventories should remain at historically low levels as a result, further impacting sales and suppressing light vehicle demand in North America, according to LMC Automotive (LMCA).
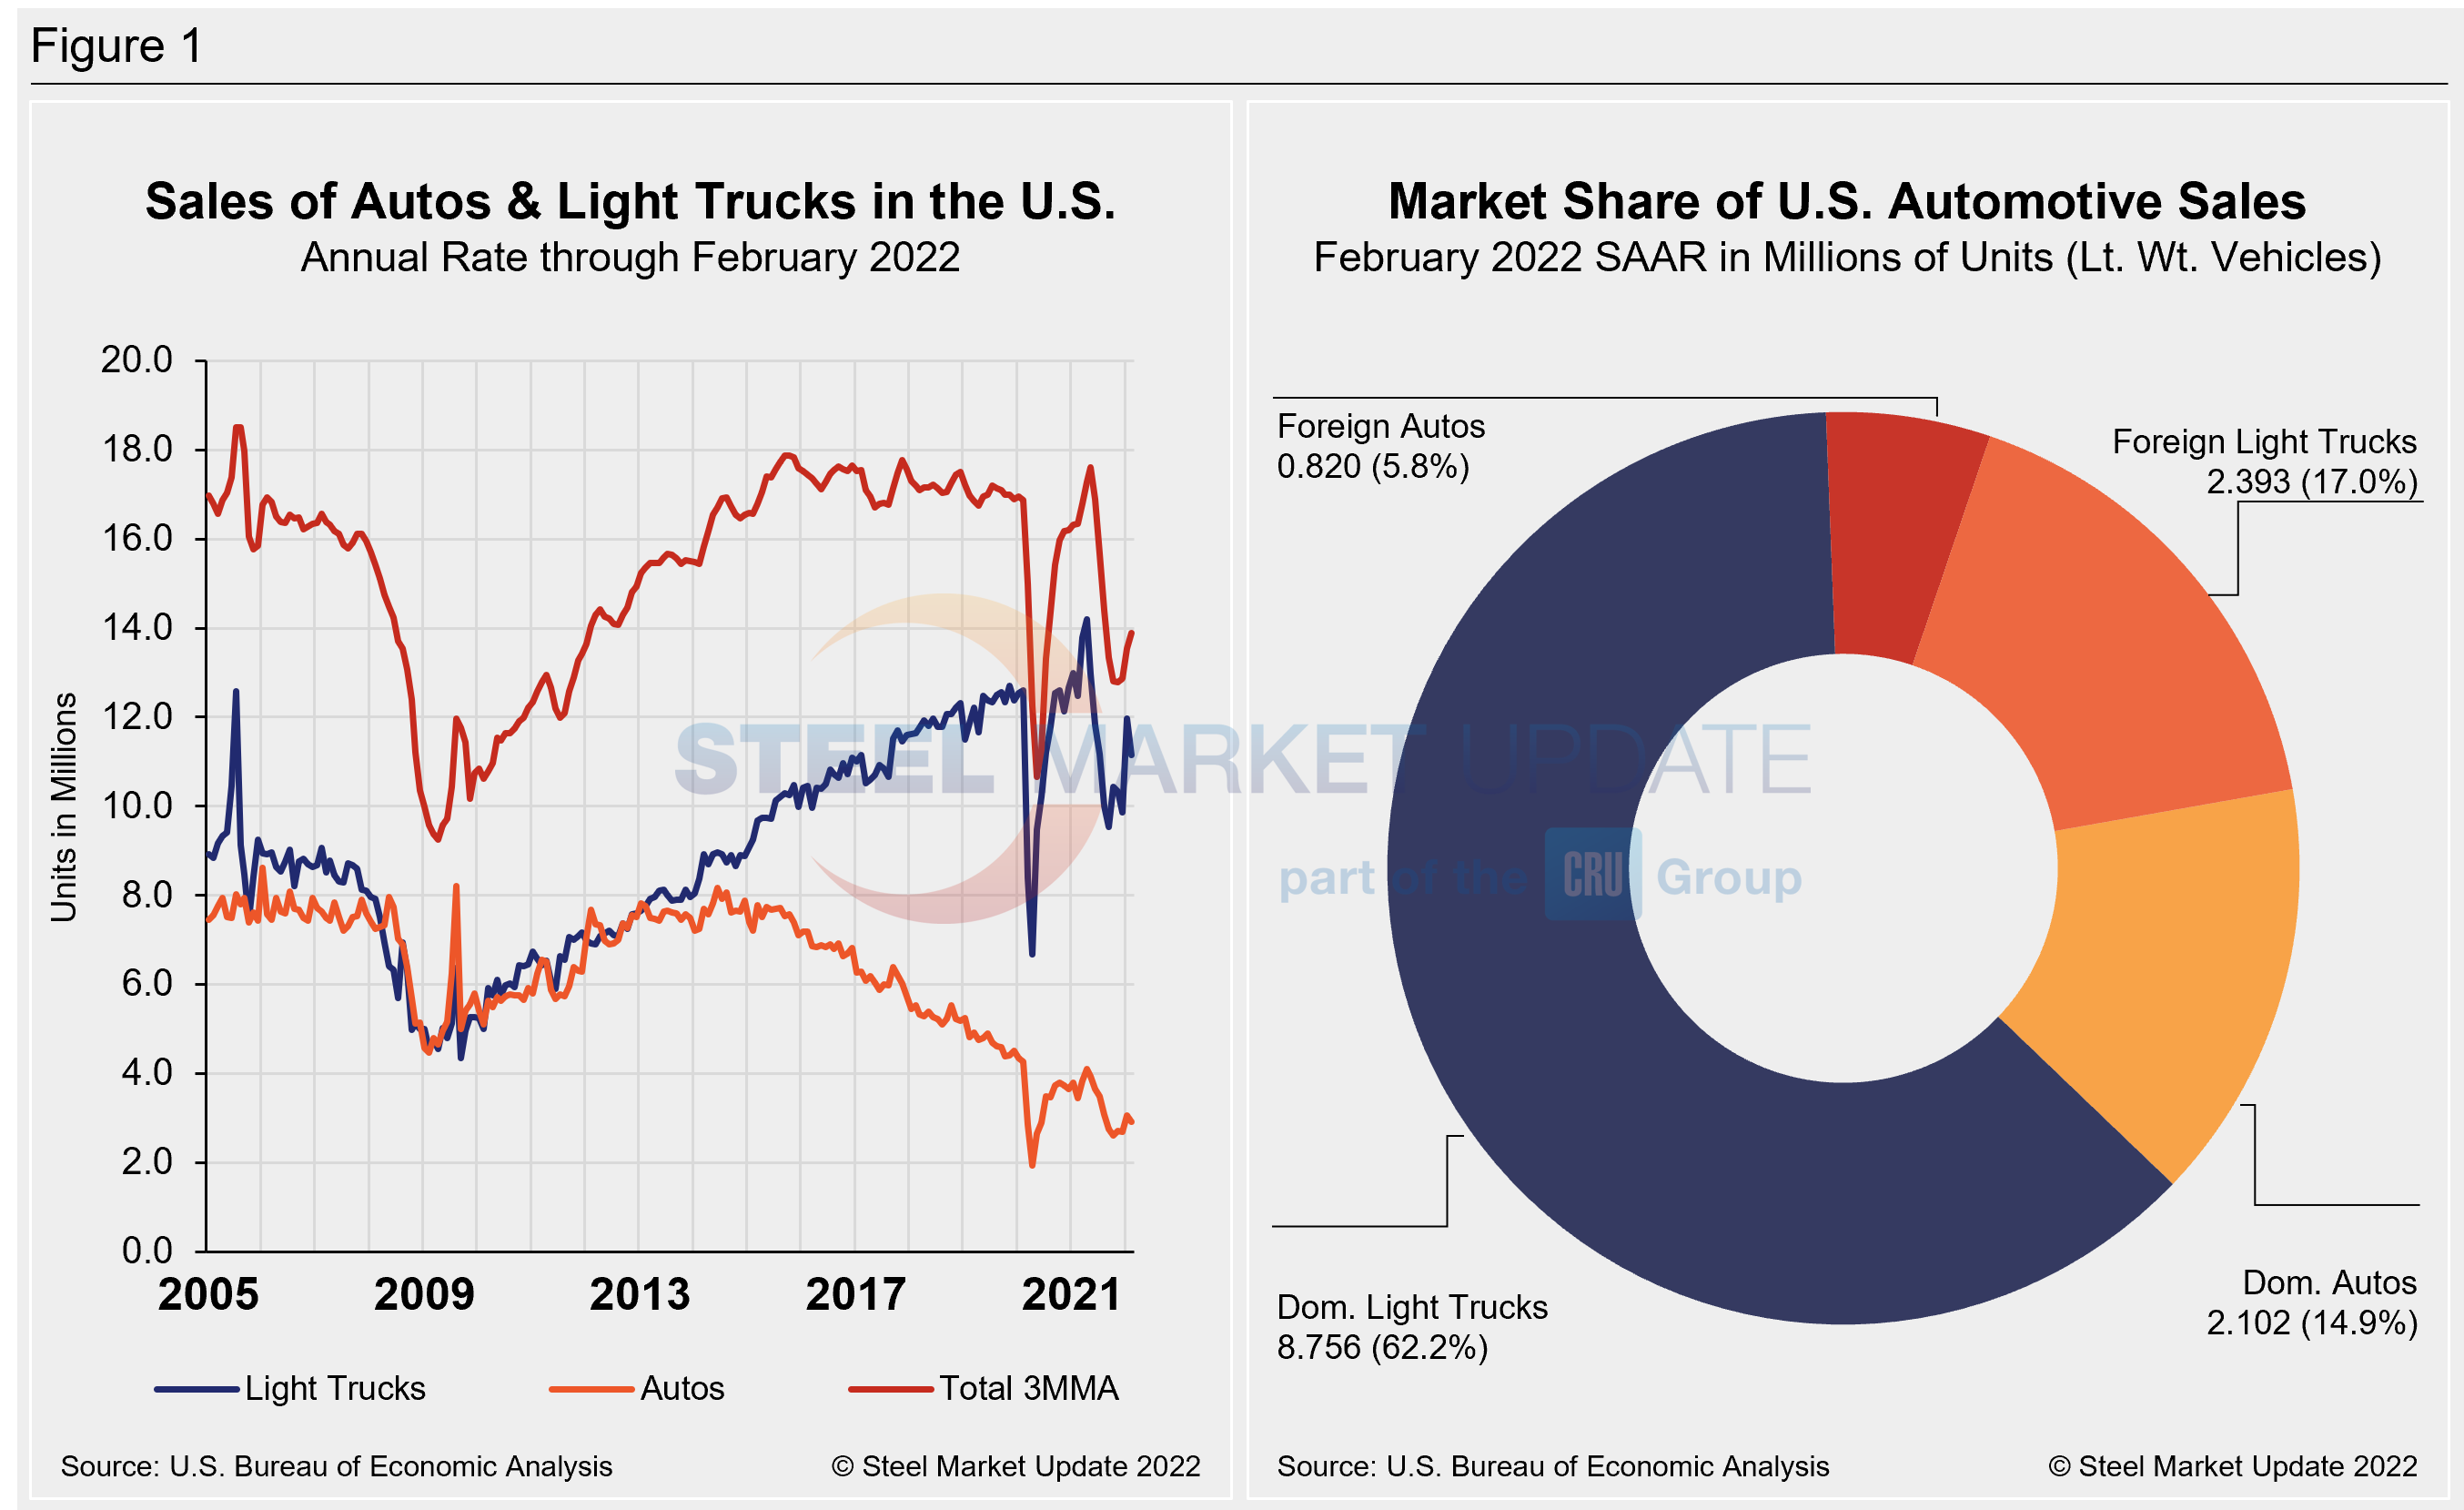
U.S. light vehicle sales fell by 12.0% year on year in February, to 1.05 million units. The annualized selling rate declined to 14.071 million units from 15.034 million units the month prior. This measure can be misleading, however, since supply rather than demand is driving sales and disrupting normal seasonality.
Average transaction prices in the U.S. eased slightly to $44,132 in February versus $44,600 in January, but were still up by 17.6% year on year. Incentives continued to head lower last month, to $1,245 per vehicle, compared to $1,319 the month prior. There was a slight recovery in fleet sales in February, but they remain well below pre-pandemic levels.
In Canada, light vehicle sales declined by 12.6% year on year in February, to 101,000 units. The selling rate slowed to 1.67 million units per year. There has been very little change in recent months as the market continues to battle against low inventories.
Mexican light vehicle sales were down in February, declining by 3.4% year on year to 79,000 units. The selling rate picked up to 1.06 million units annually, nominally the strongest since June 2021.
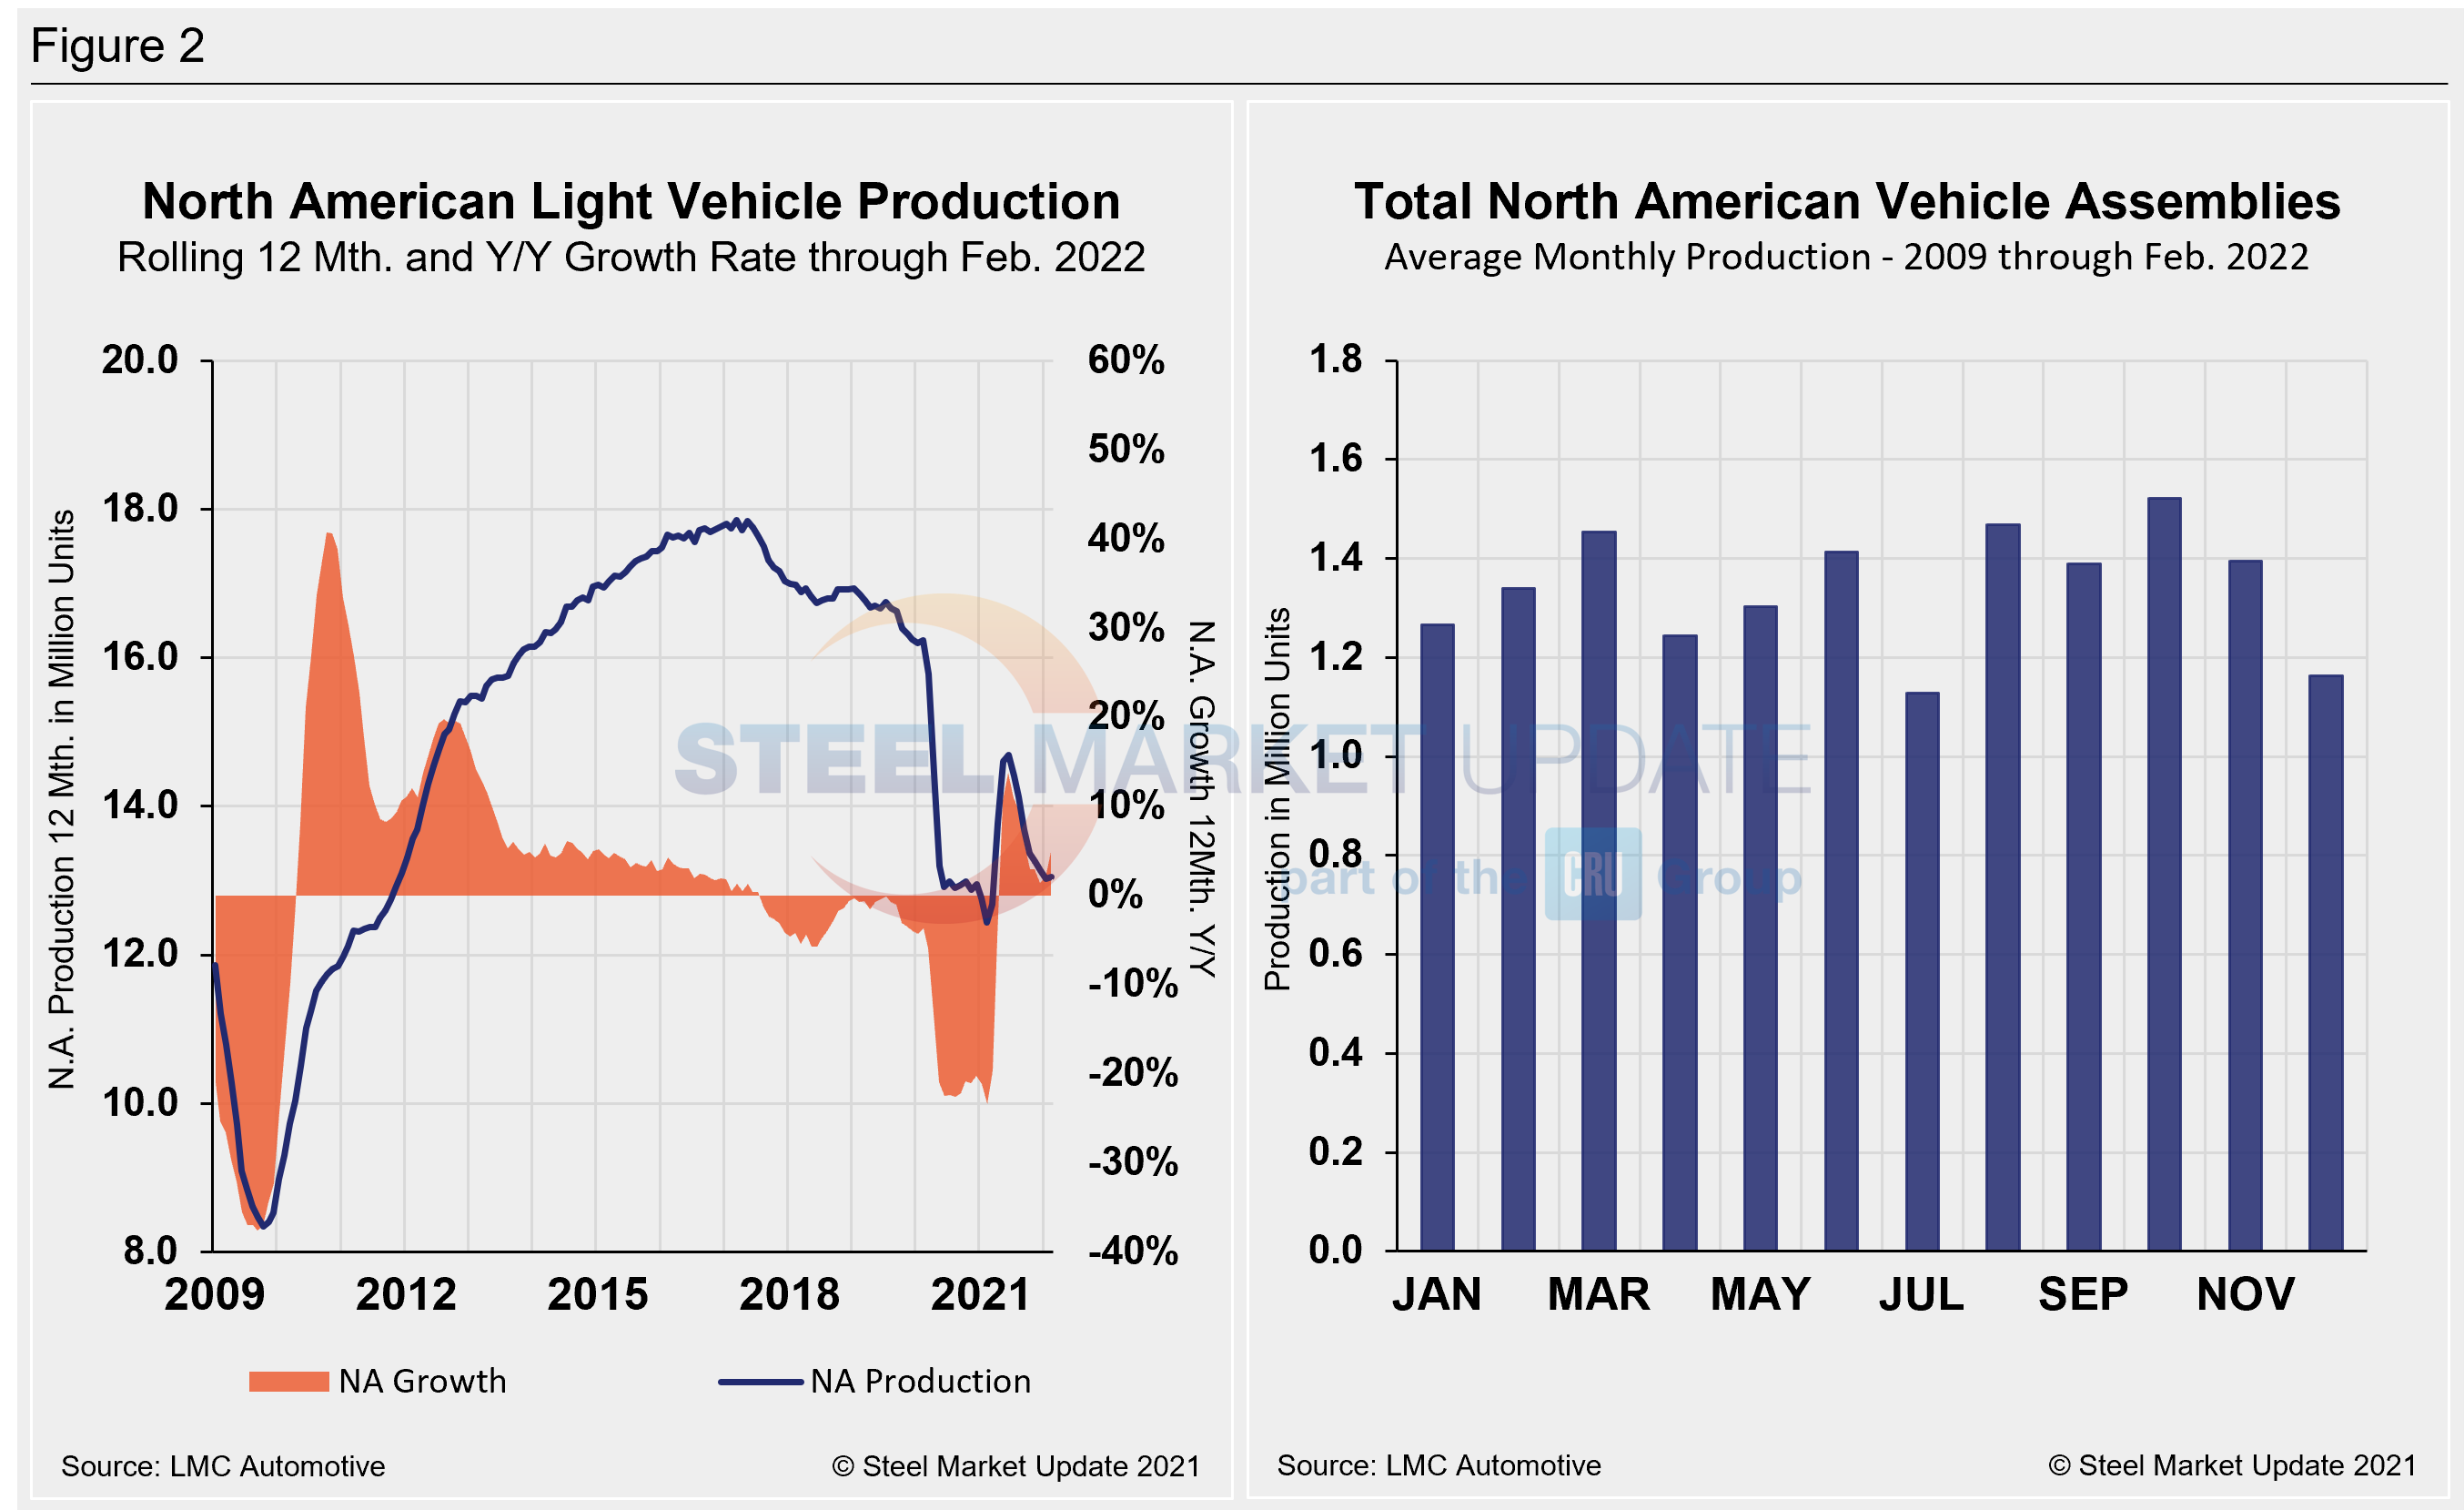
Below in Figure 1 is the long-term picture of sales of autos and light weight trucks in the U.S. from 2005 through February 2022, as well as the market share sales breakdown of last month’s 14.071 million vehicles at a seasonally adjusted annual rate. Figure 2 details the North American light vehicle production since 2009 on a rolling 12-month and year-over-year growth rate, as well as the average monthly production, including seasonality, over the same period.
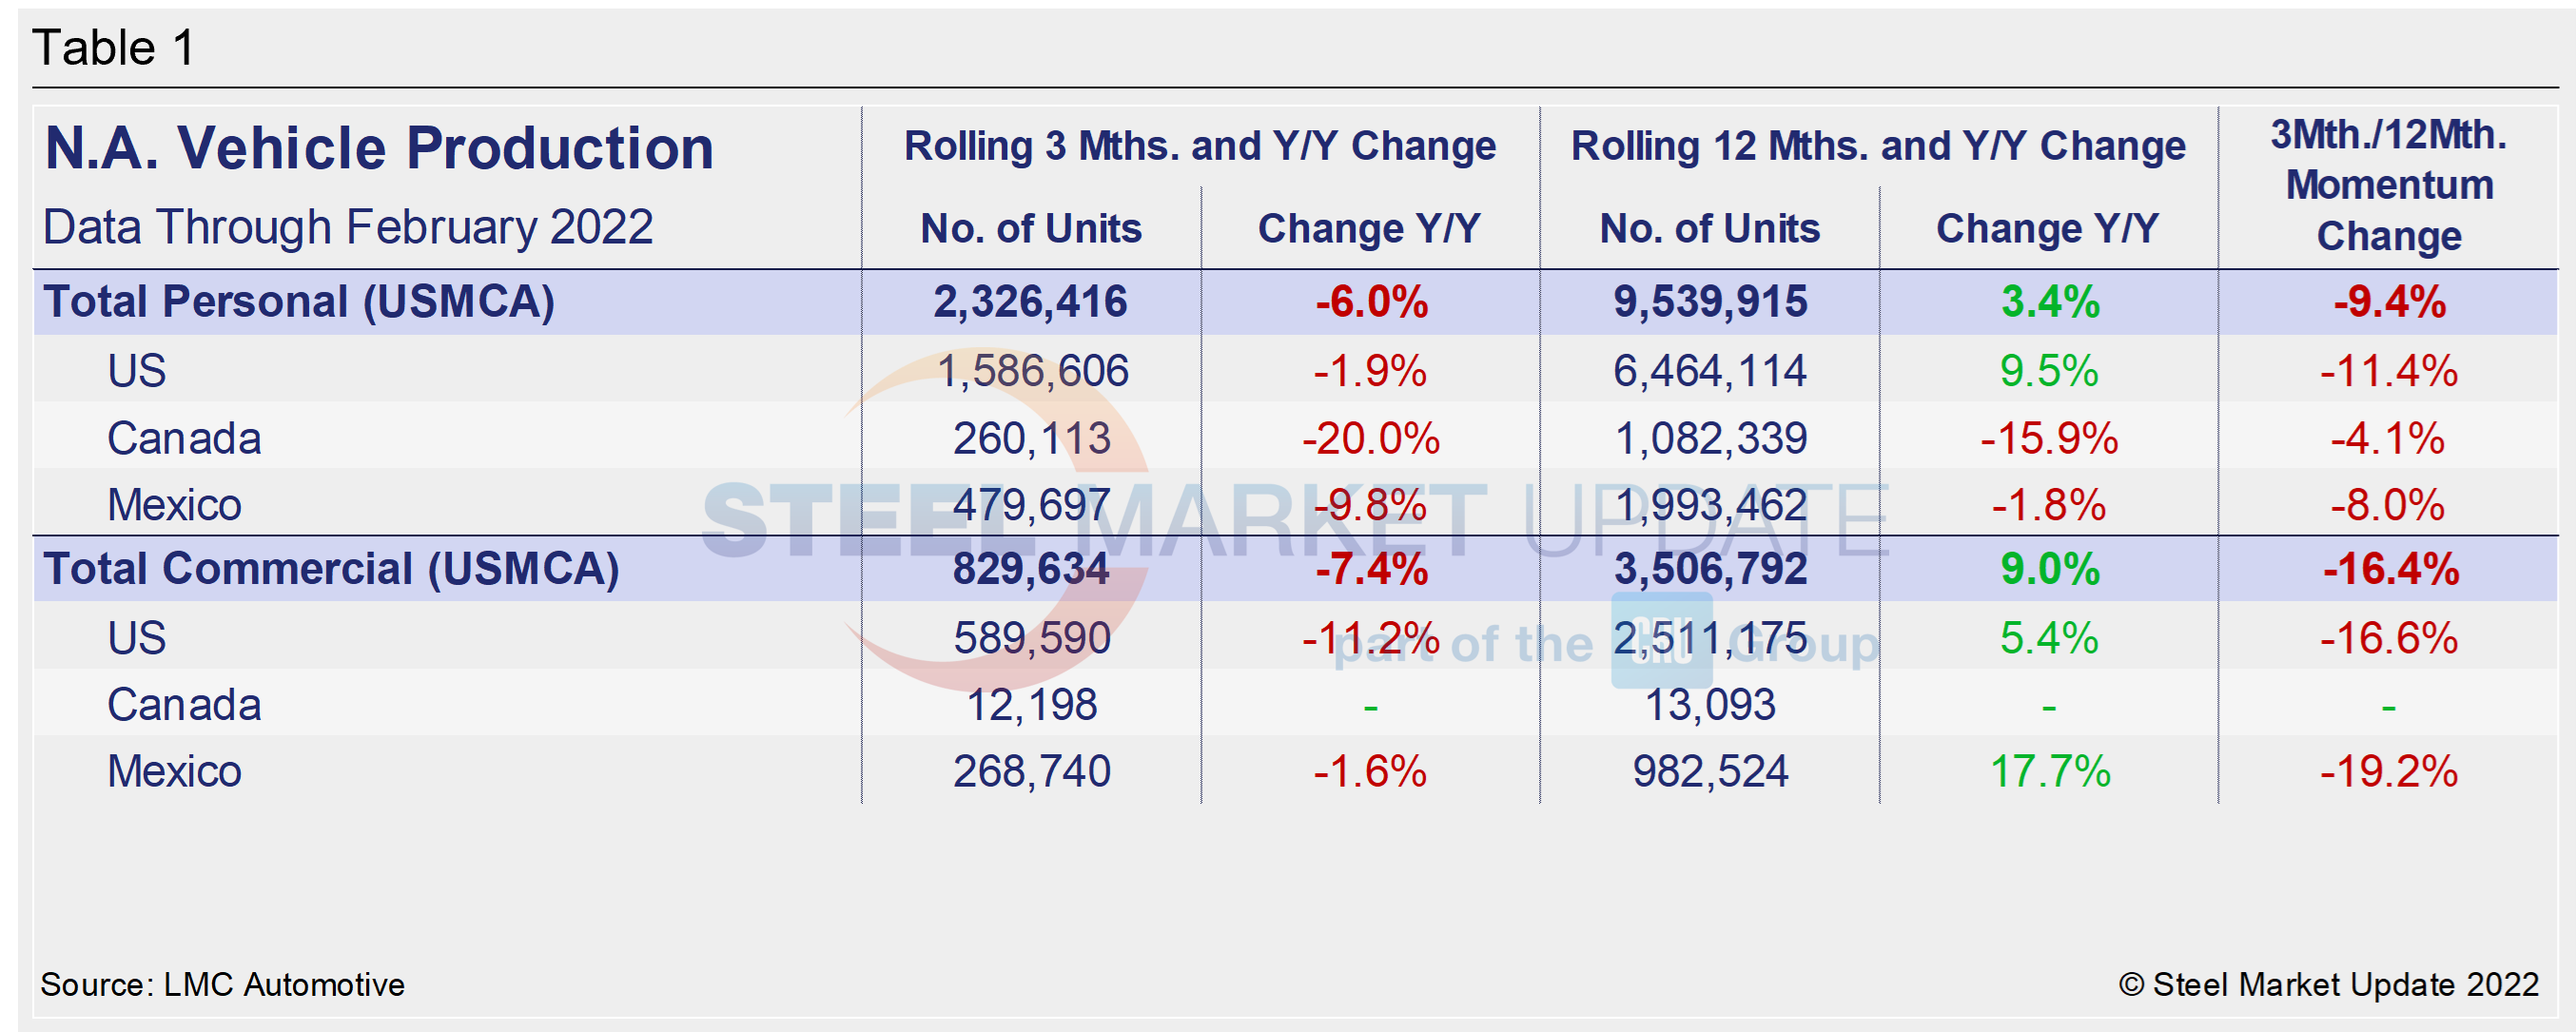
A short-term snapshot of assembly by nation and vehicle type is shown in the table below. It breaks down total North American personal and commercial vehicle production into the U.S, Canadian and Mexican components, along with the three- and 12-month growth rate for each. At the far right it shows the momentum for the total and for each of the three nations.
Although the initial rebound from the COVID-19 doldrums was impressive, the effect of the chip shortage has been even more damaging due to its prolonged nature. Through June, growth rates for personal and commercial light vehicles soared by 156.8% and 127.4%, respectively, but have since seen a nosedive as the chip shortage and supply-chain disruptions have persisted.
In three months through February, the growth rate for total personal vehicle assemblies in the USMCA was -6.0% year on year, but noticeably improved from -11.2% month on month. Growth for commercial and light vehicle assemblies was -7.4% and -3.5% over the same period. The decline in commercial assembly growth is underpinned by decreased demand for fleet vehicles, as automakers focus their limited microchips on the best-selling vehicles. The impact of the global semiconductor chip shortage on automotive production across North America has been devastating.
Personal Vehicle Production
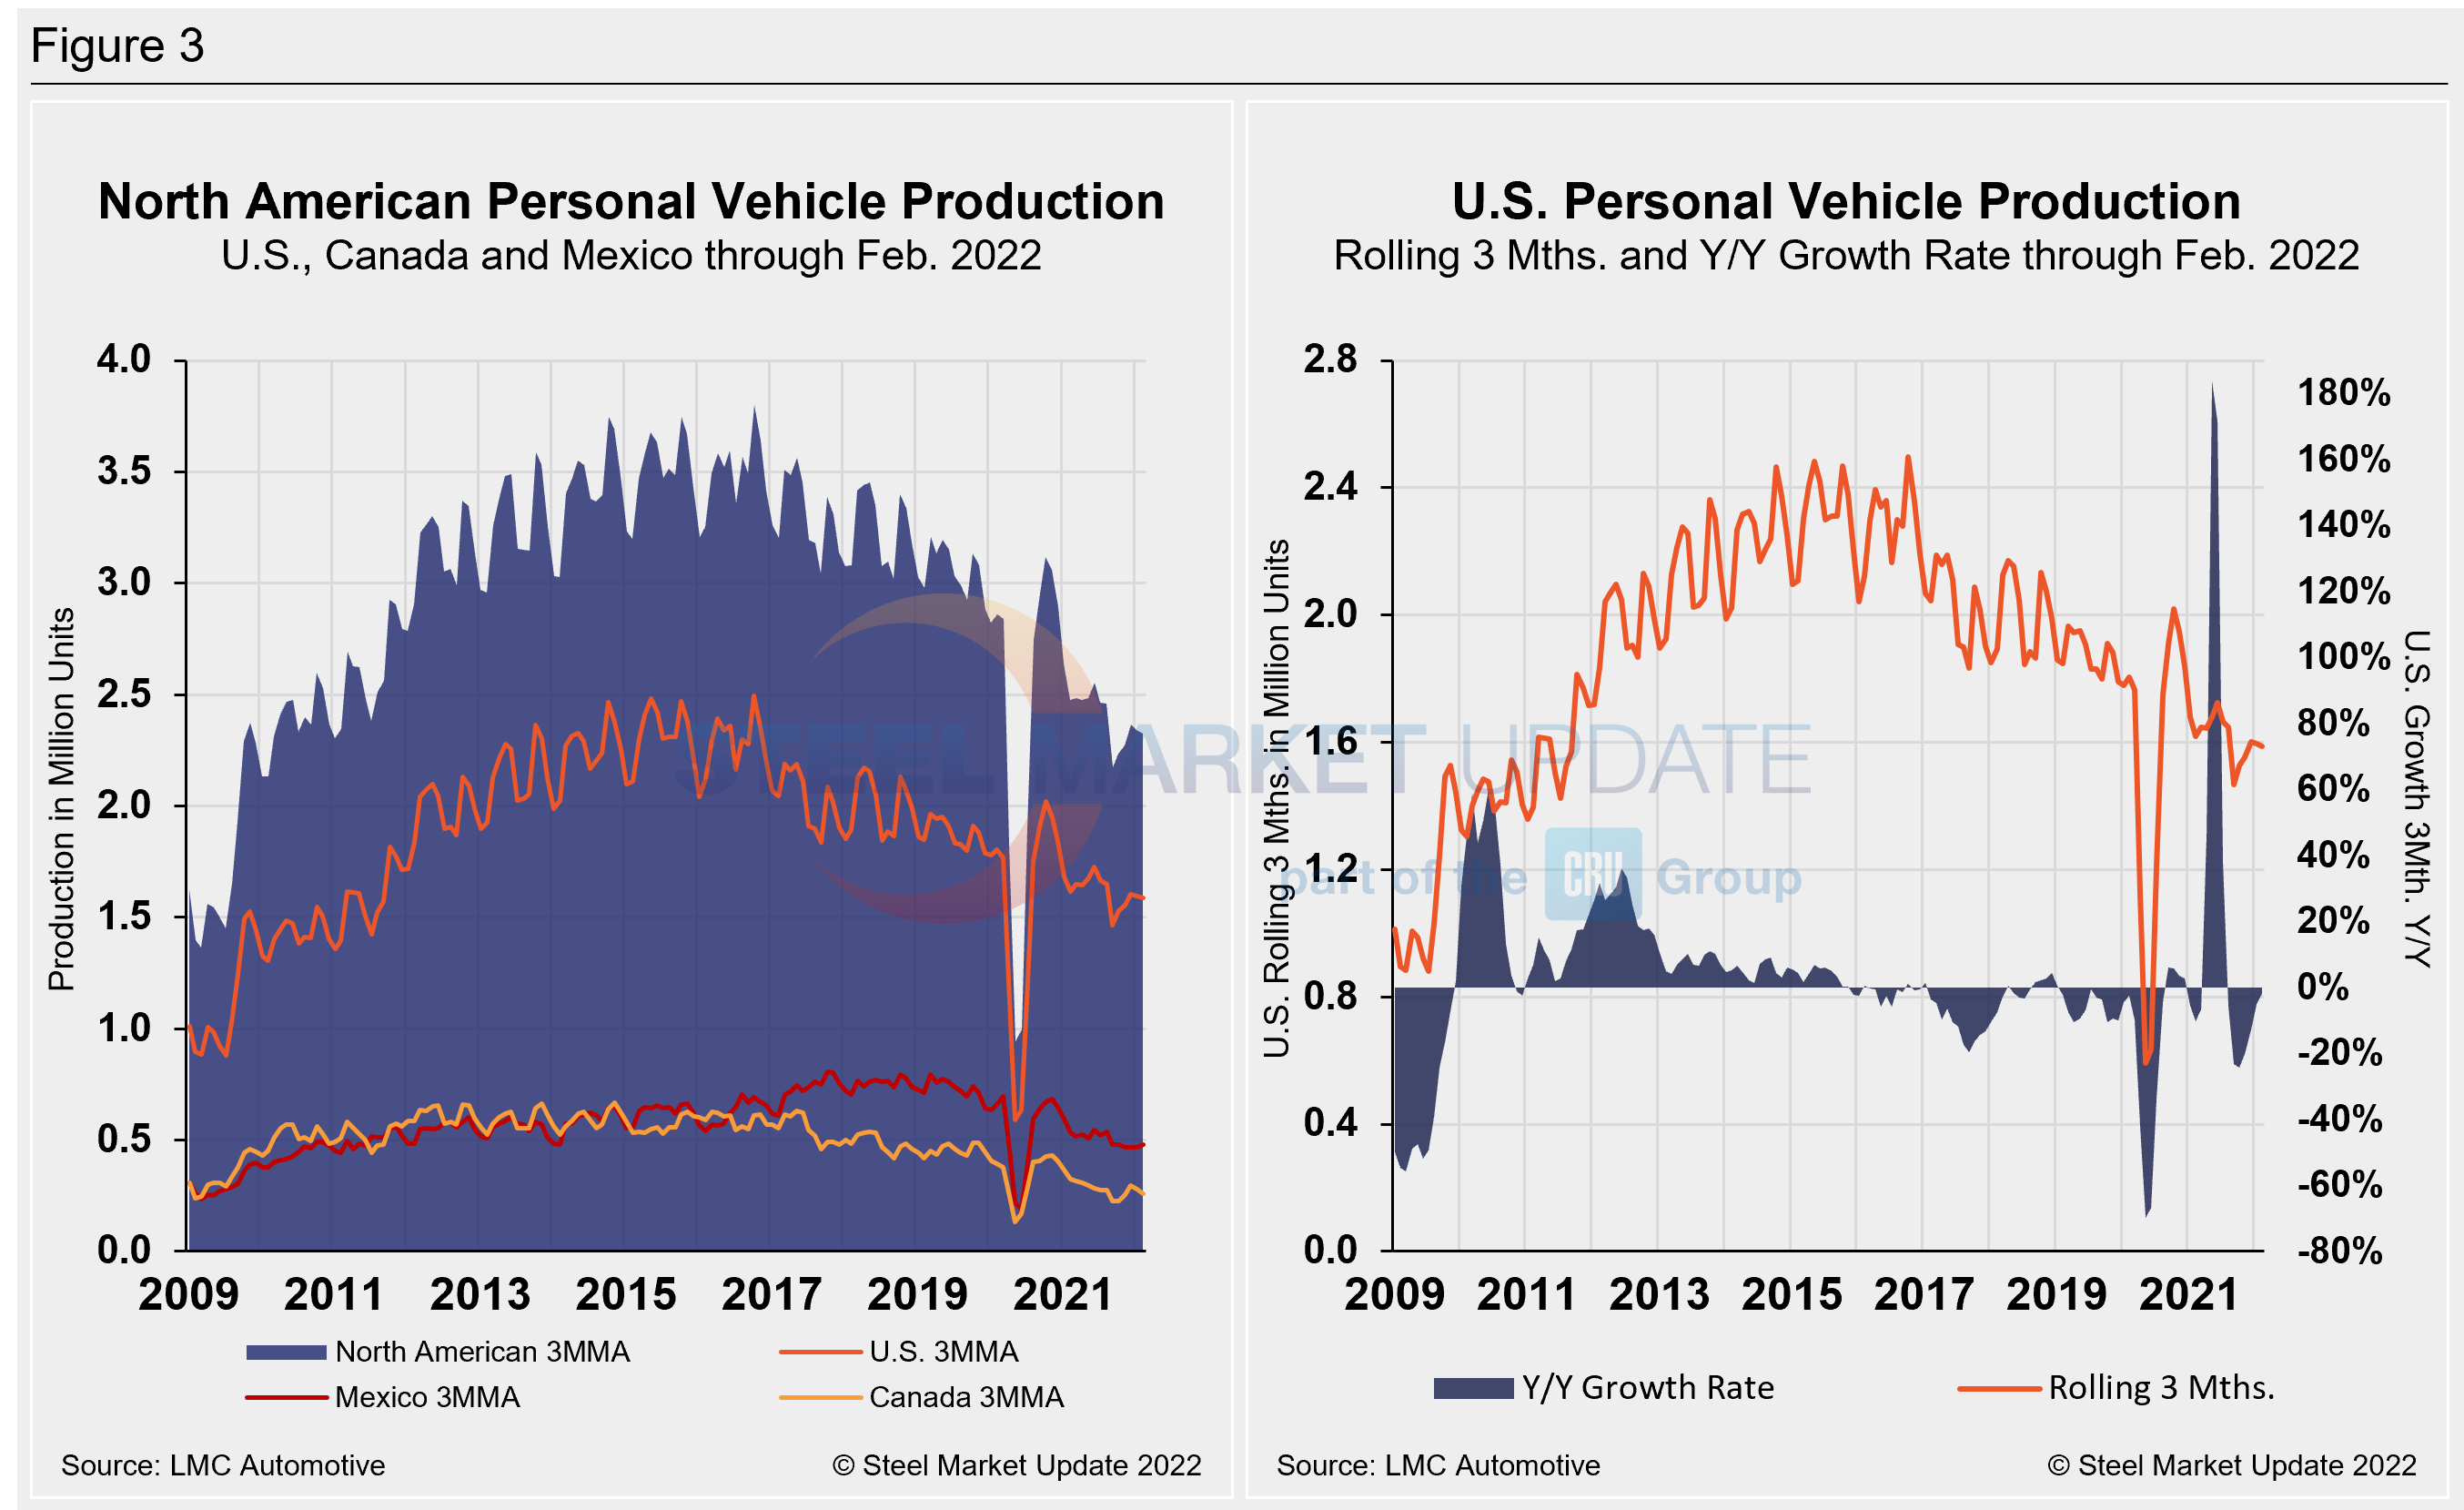
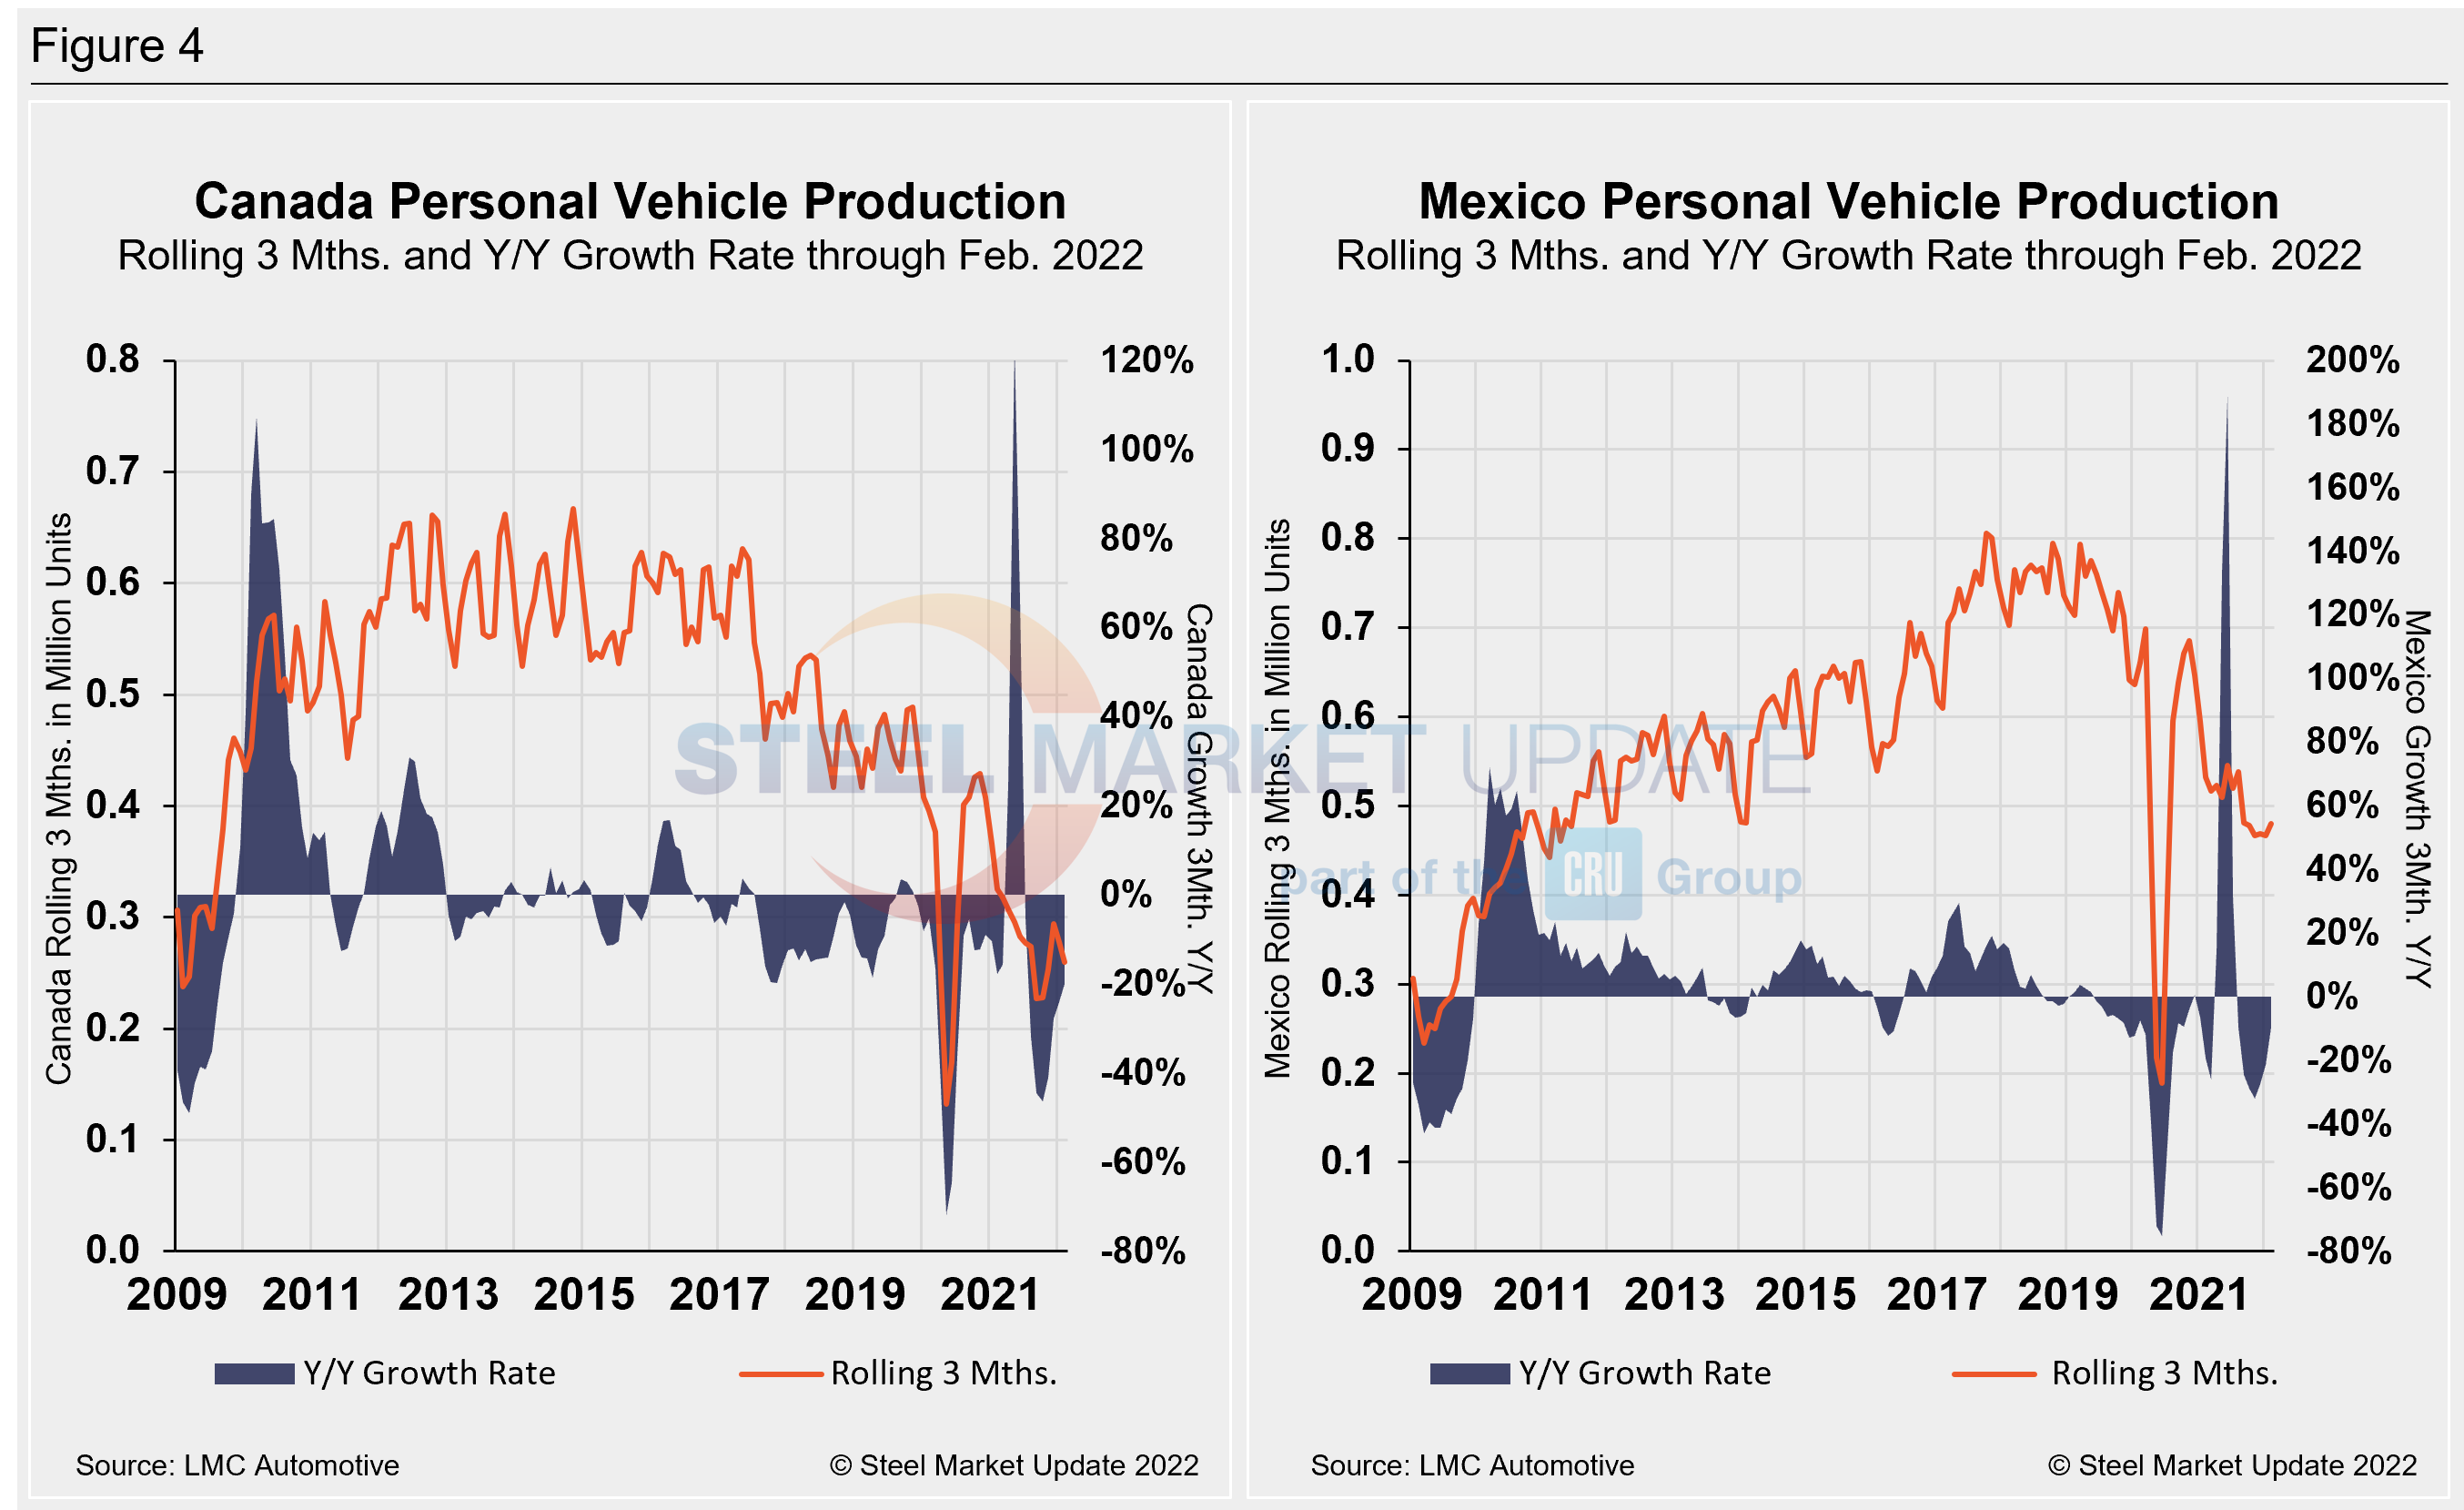
The longer-term picture on personal vehicle production across North America is shown below. The first chart in Figure 3 shows the total personal vehicle production for North America and the total for each nation. The production of personal vehicles in the U.S. and the year-over-year growth rate is displayed in the second chart. Figure 4 shows side-by-side the production of personal vehicles in Canada and Mexico and the year-over-year growth rate.
In terms of personal vehicle production, all three – U.S. Canada, and Mexico – saw gains in February, maintaining repeated growth in 2022 despite ongoing supply-chain limitations and work stoppages resulting from the border protests.
Canada saw the greatest percentage gain, up 37.5% or 25,587 more units when compared to the month prior. The U.S. saw the largest increase in total units, up 30,049 vehicles or 5.7% month on month. Mexican auto assemblies were also 1.7% or 2,872 higher in February versus the prior month.
The annual growth rate across the region in February was mixed. The U.S. saw the best gain at 5.7%, followed by Mexico at 3.7%. Canada’s annual growth rate fell by 8.1% during the period. Overall, the region saw an increase of 58,553 units in February, a 7.7% increase over January’s total.
Canada’s personal vehicle production share of the North American market slipped slighty to 11.2% month on month in February, while Mexico’s share rose from 20.0% to 20.6%. The U.S. was unchanged at a 68.2% share of the North American market in February.
Commercial Vehicle Production
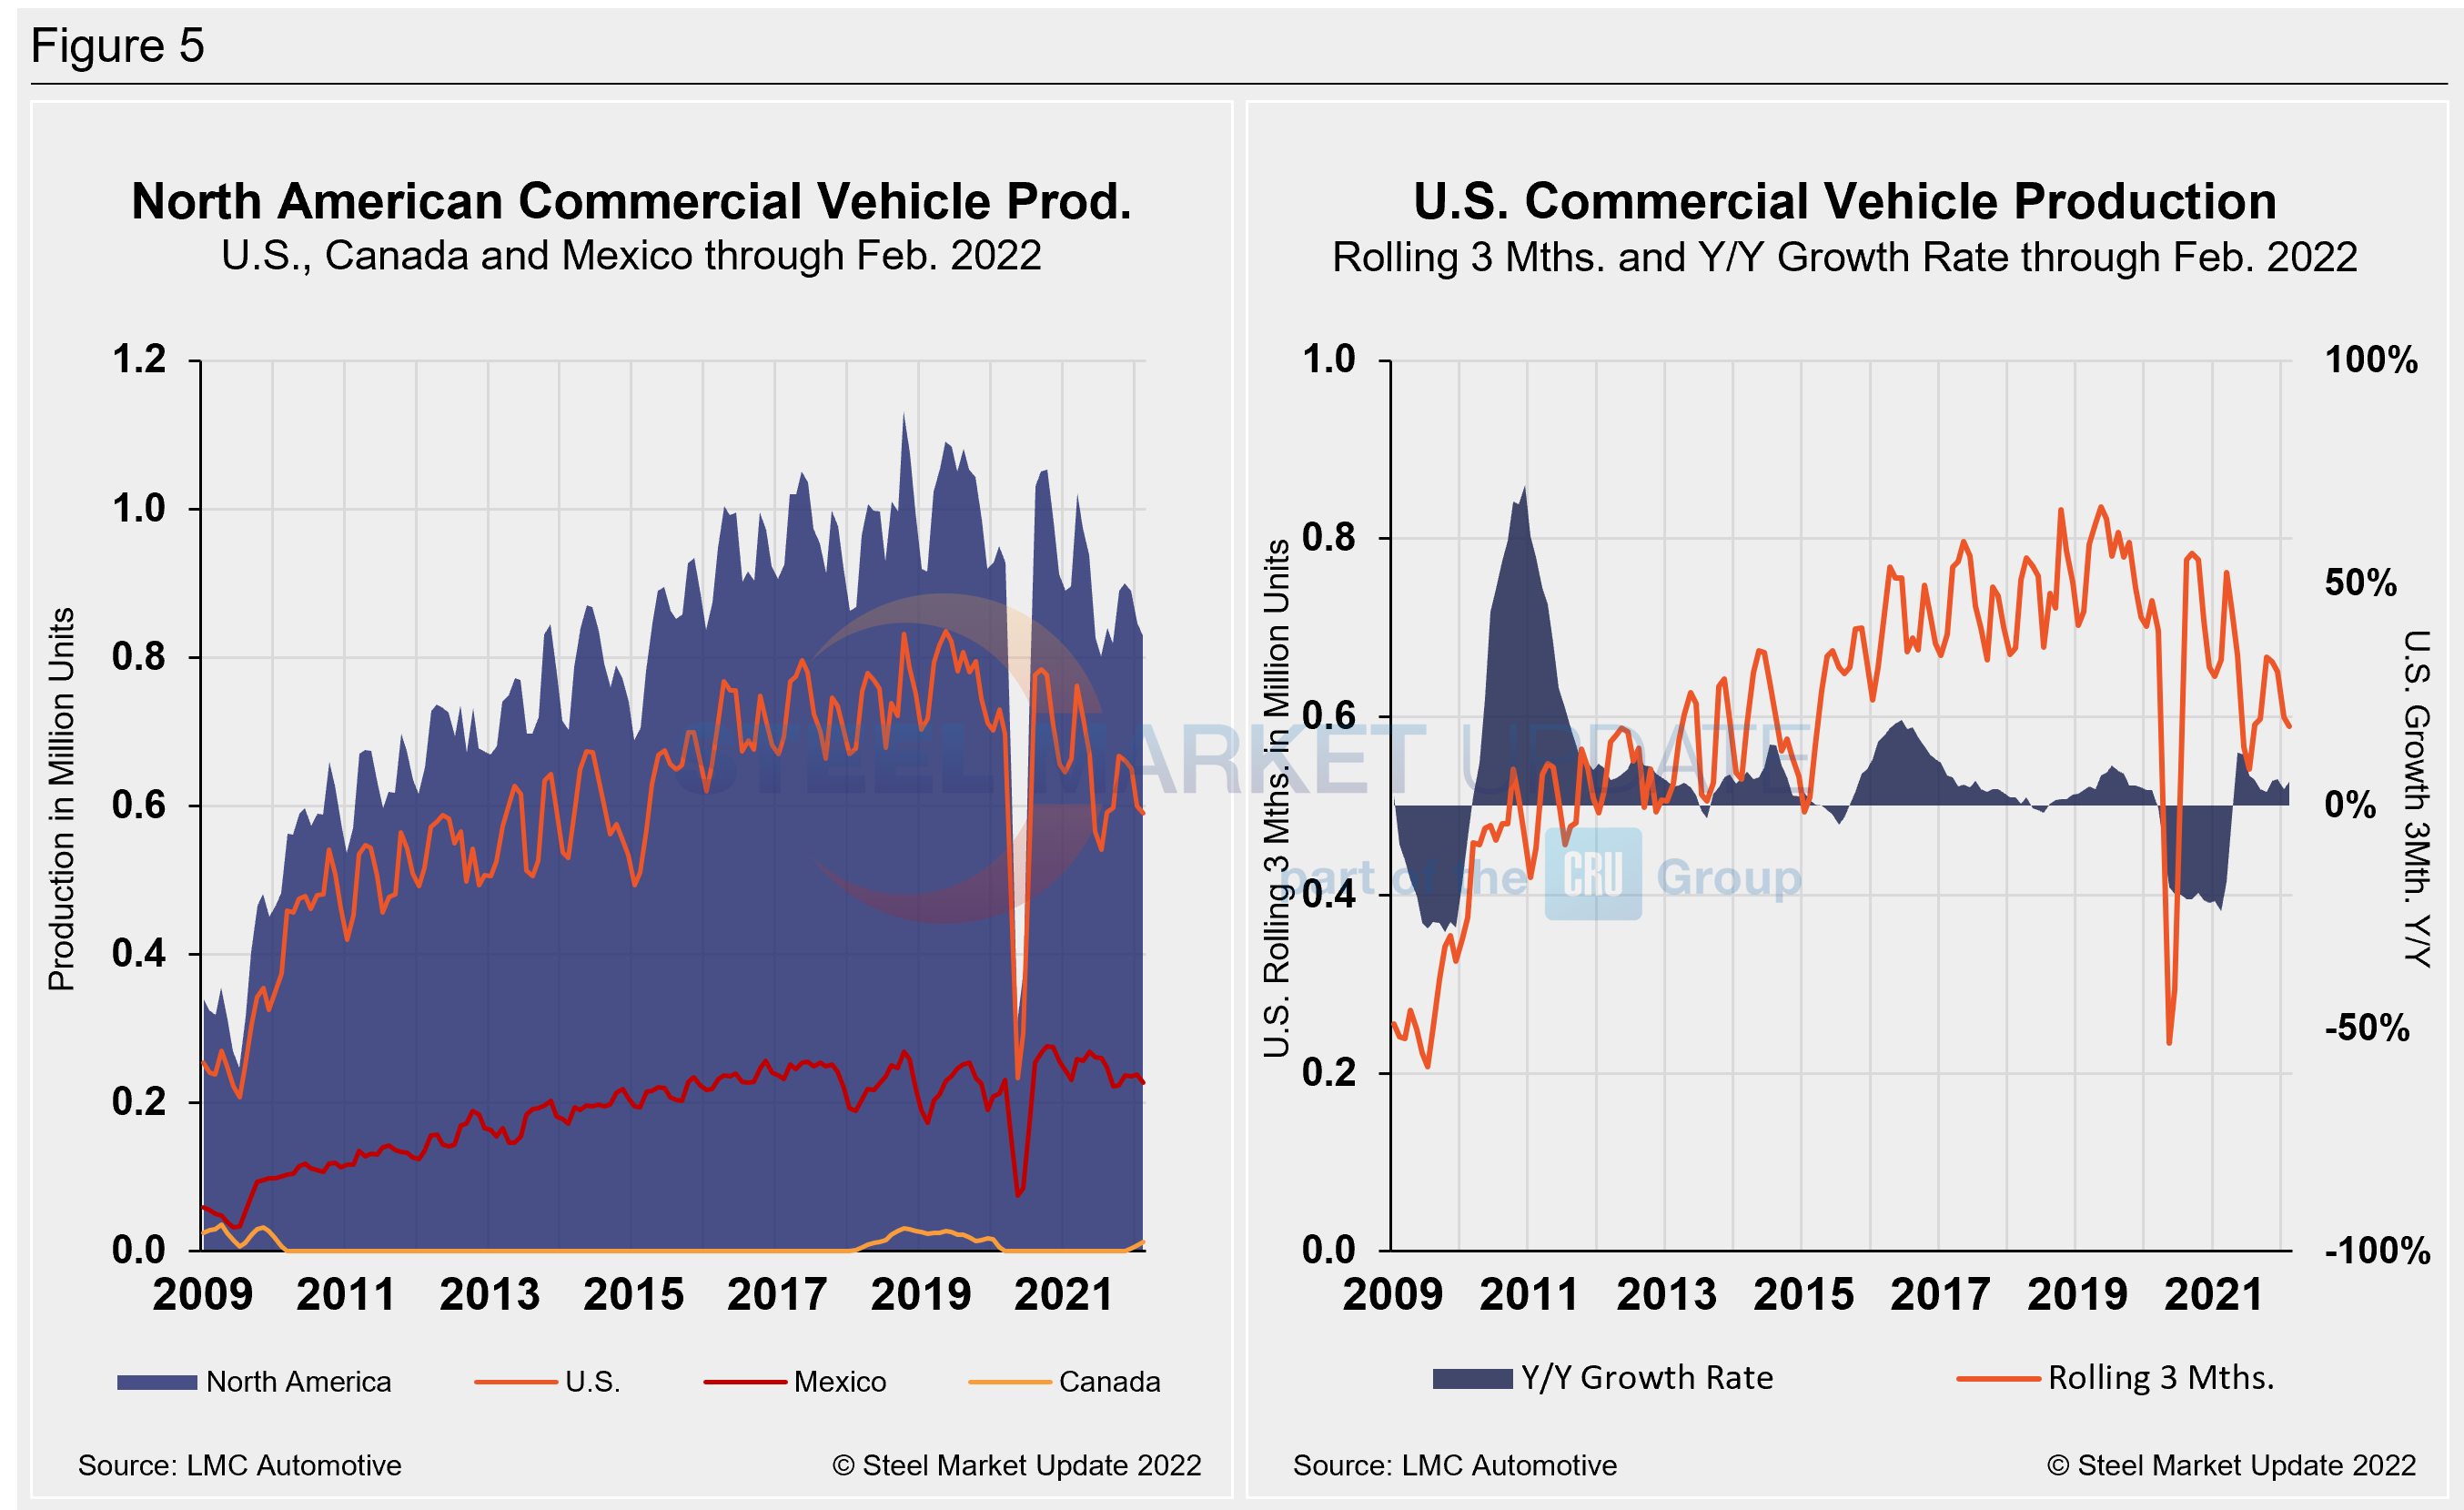
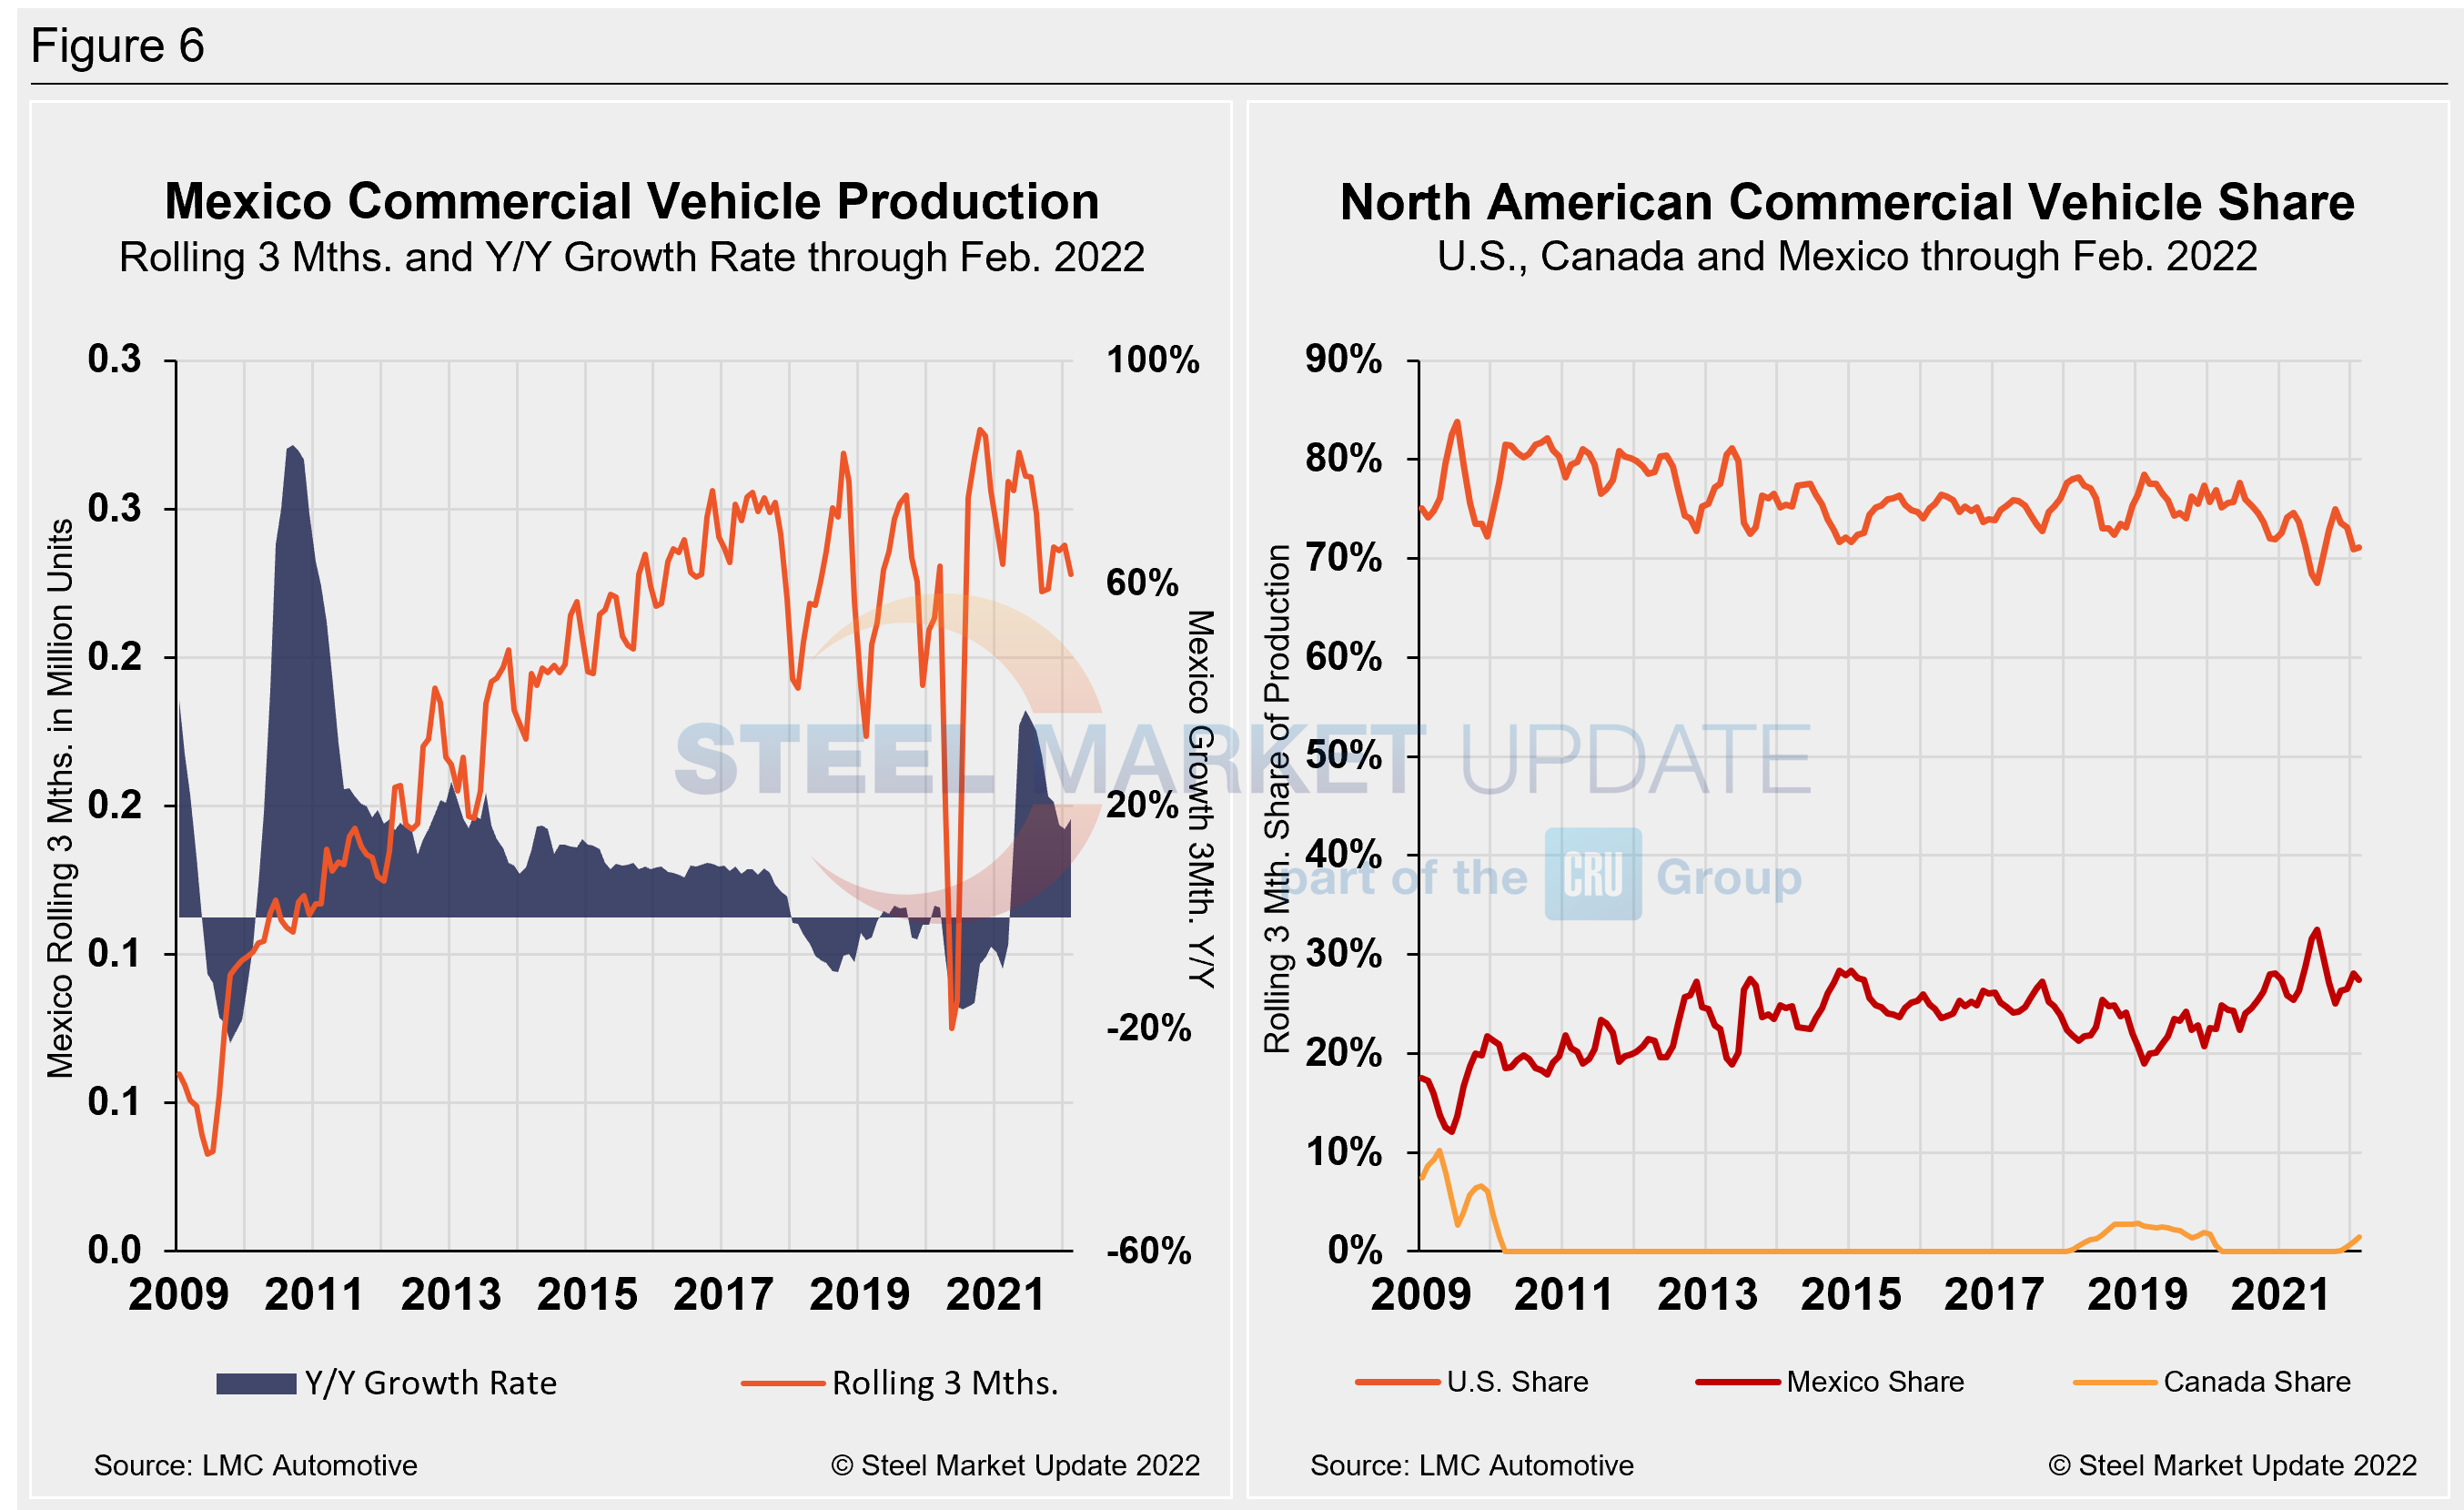
Total commercial vehicle production for North America and the total for each nation on a rolling three-month basis is shown below in the first chart in Figure 5, while the production of commercial vehicles in the U.S and the year-over-year growth rate is displayed in the second chart. Figure 6 shows the production of commercial vehicles and the year-over-year growth rate in Mexico displayed in the first chart, while the second chart shows the production share for each nation. Of note for the Canadian automotive sector, February marked Canada’s fourth straight month of commercial vehicle production after a 20-month production halt. The United States’ northern neighbor produced 5,218 light commercial vehicles in February, 23% above January’s 4,241 total.
North American commercial vehicle production rose 9.6% in February to 300,573 units. The upgrade of 23,946 units month on month was boosted by growth in U.S. and Canadian production. Mexico’s commercial production decelerated by 6.7% or 5,708 lesser units in February. The U.S. saw a 15.3% surge or 28,677 more units last month versus January.
The annual commercial production growth rate is now -1.4% for the region, a 2.1 percentage point improvement month on month, but well ahead of the -21.3% seen last September. The U.S. share was 71.1% in February, down 1.1 percentage points versus the month prior. Mexico’s share also slipped slightly to 27.5% month on month, down 0.6 of a percentage point, while Canada now has a 1.5% share of the market. Presently, Mexico exports just under 80% of its light vehicle production, while the U.S and Canada are the highest volume destinations for Mexican exports.
Editor’s Note: This report is based on data from LMC Automotive for automotive assemblies in the U.S., Canada and Mexico. The breakdown of assemblies is “Personal” (cars for personal use) and “Commercial” (light vehicles less than 6.0 metric tons gross vehicle weight rating; heavy trucks and buses are not included). In this report, we describe light vehicle sales in the U.S. and report in detail on assemblies in the three regions of North America.
By David Schollaert, David@SteelMarketUpdate.com


