

Market Data

April 6, 2022
Employment by Industry: March Growth Continues
Written by David Schollaert
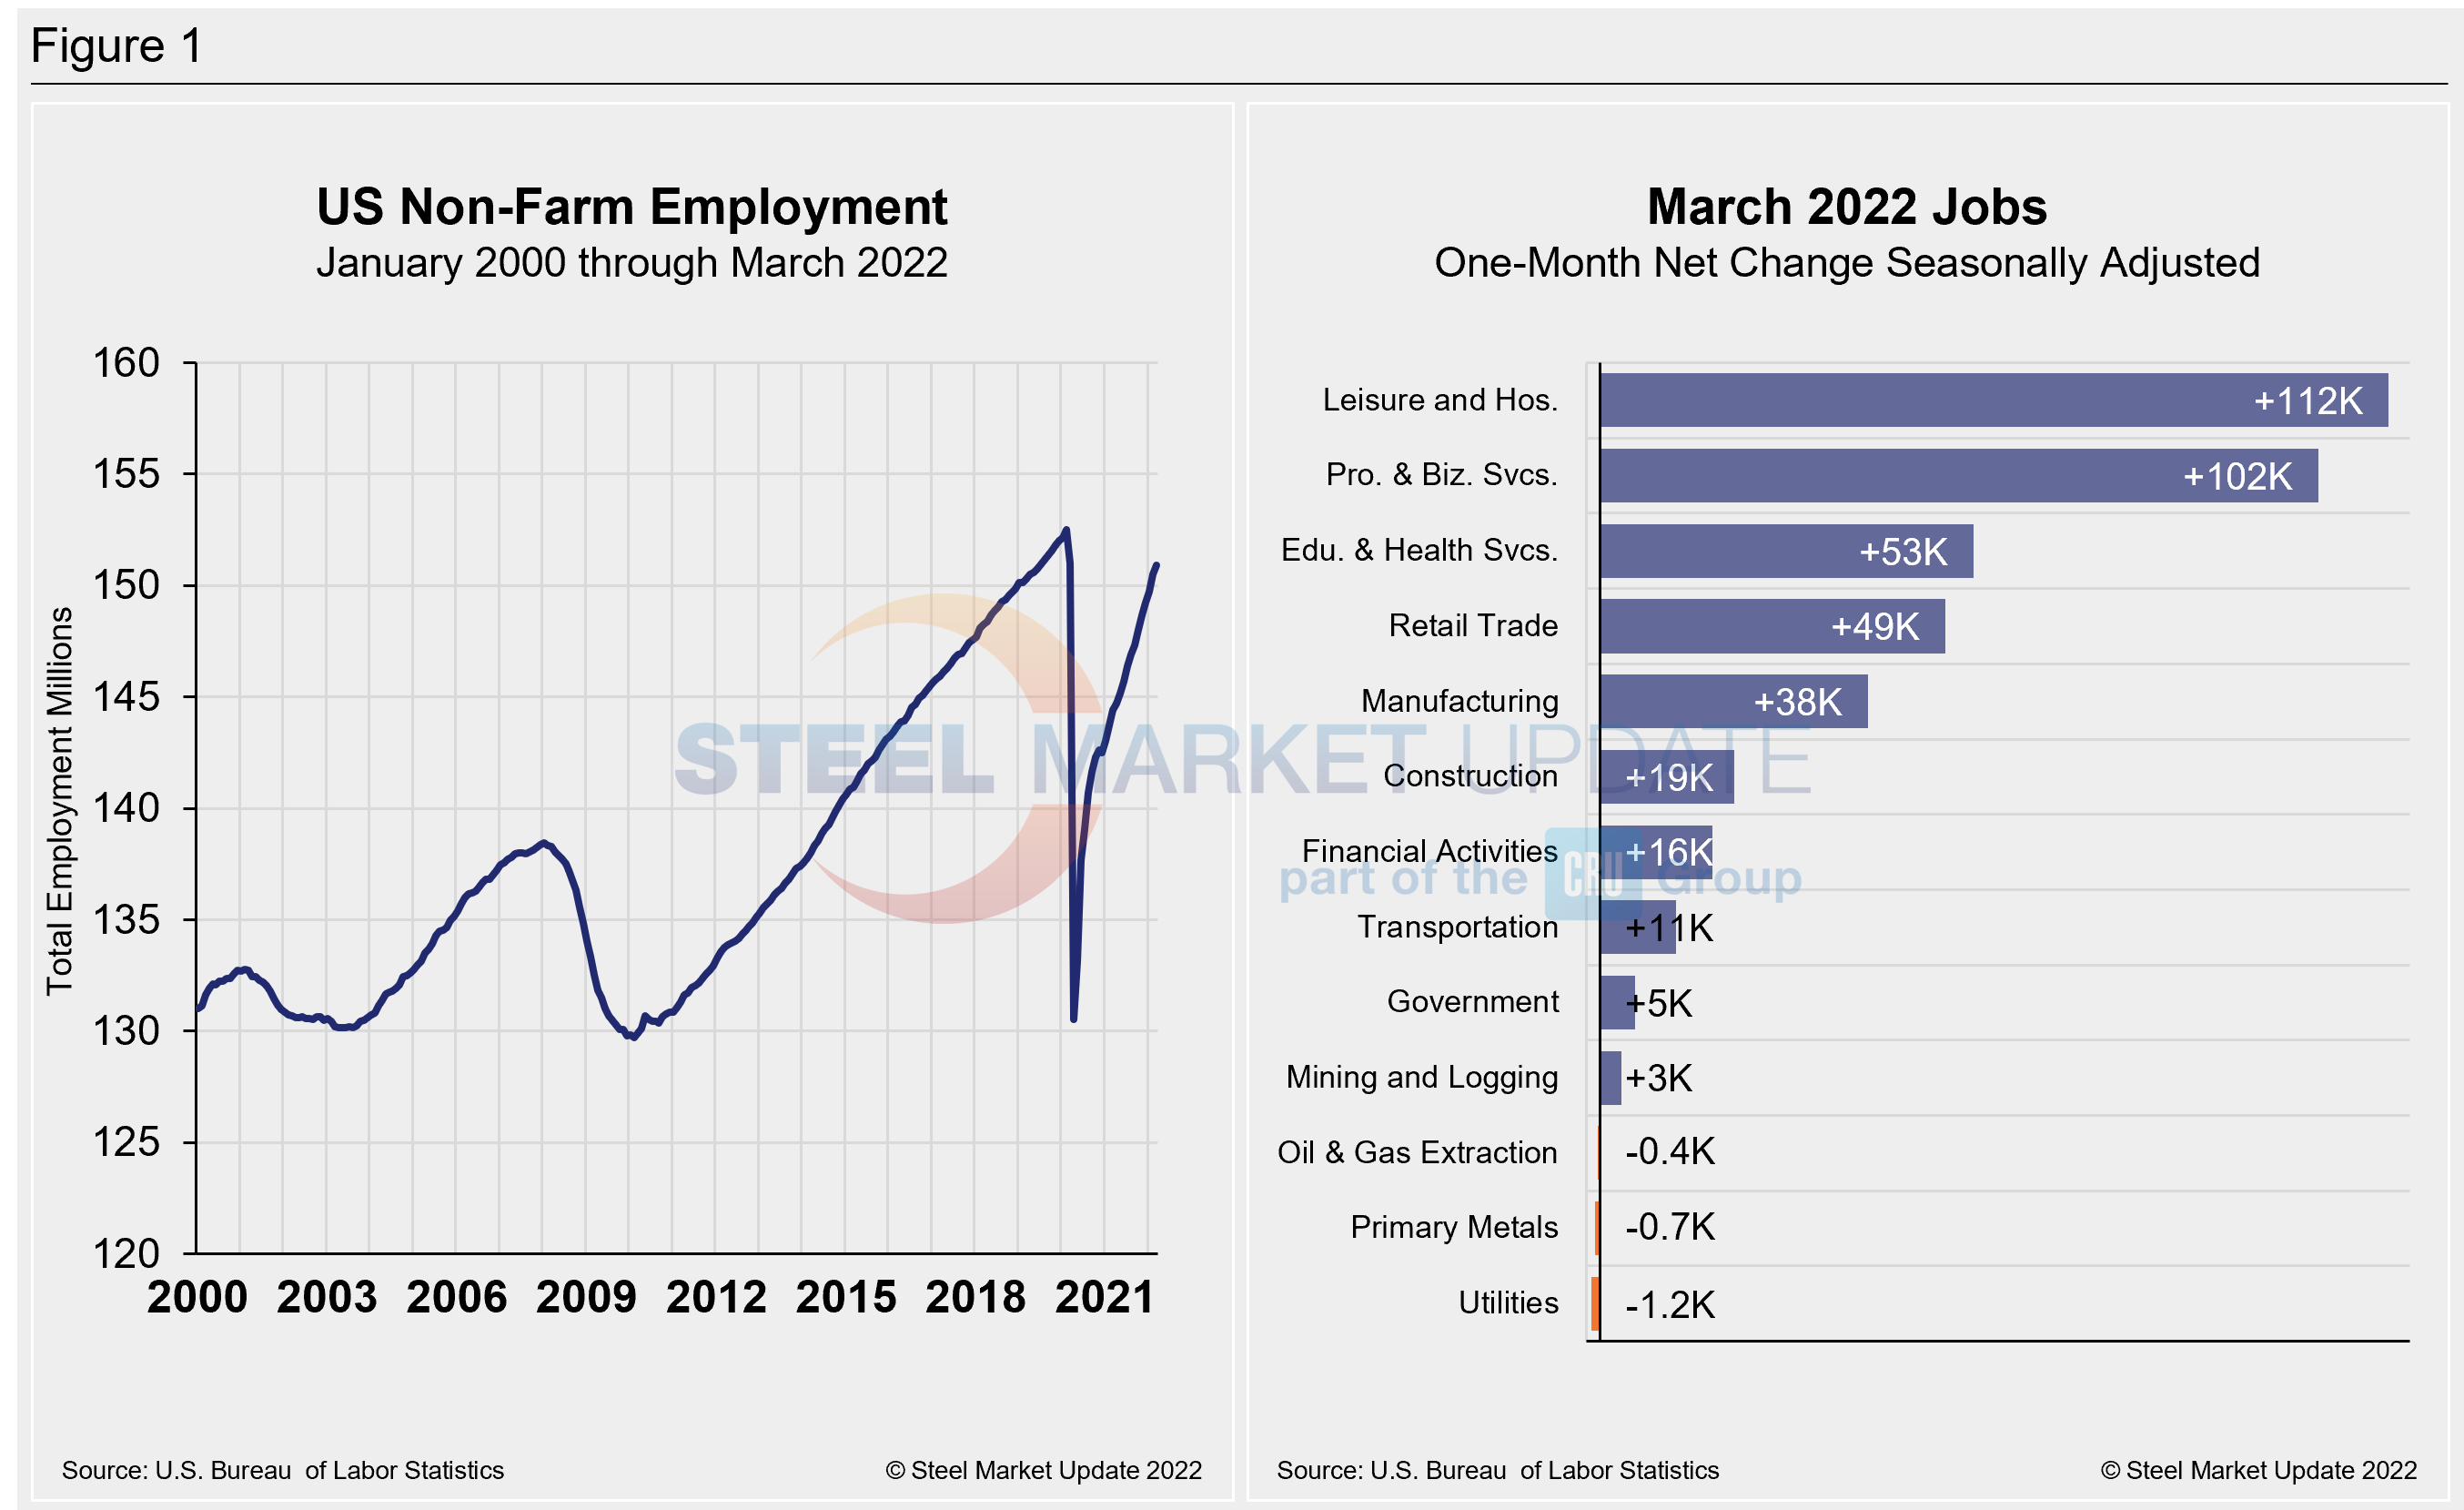
The US labor market expanded at a strong pace in March, adding 431,000 new jobs and bringing the unemployment rate to a new, pandemic-era low of 3.6%, the Bureau of Labor Statistics reported.
Though payroll gains were lower than economists had expected, they still rounded up a strong first quarter for the US labor market with an average monthly gain of more than half a million jobs. March was the 15th straight month of robust job gains, according the BLS figures released last Friday.
The latest BLS data indicated that the economy is now just 1.6 million jobs, or just 1%, short of where it was in February 2020, before the pandemic hit.
Leisure and hospitality, which includes hotels, restaurants, and amusement parks, added a net 112,000 jobs last month. That sector, one of the hardest-hit during the worst of Covid-19 shutdowns, has posted 15 straight months of net job gains of at least 100,000. And it has driven mich of the economy’s post-shutdown job recovery. Still, employment in leisure and hospitality has fallen by 1.5 million, or 8.7%, since February 2020.
Professional and business services sector also posted a robust March, with a net addition of 102,000 positions. Transportation and warehousing saw little change over the month, with a loss of 500 jobs.
Shown below in Figure 1 is the total number of people employed in the nonfarm economy as well as the month-on-month net change in total jobs in March.
Designed on rolling time periods of 1 month, 3 months, 1 year, and 2 years, the table below breaks total employment into service industries and goods-producing industries, and then into private and government employees. Most of the goods-producing employees work in manufacturing and construction. Comparing service and goods-producing industries in March shows both increased by just 0.3%. Despite steady month-on-month gains, good-producing remains just behind pre-pandemic levels. Note, the subcomponents of both manufacturing and construction shown in this table don’t add up to the total because we have only included those with the most relevance to the steel industry.
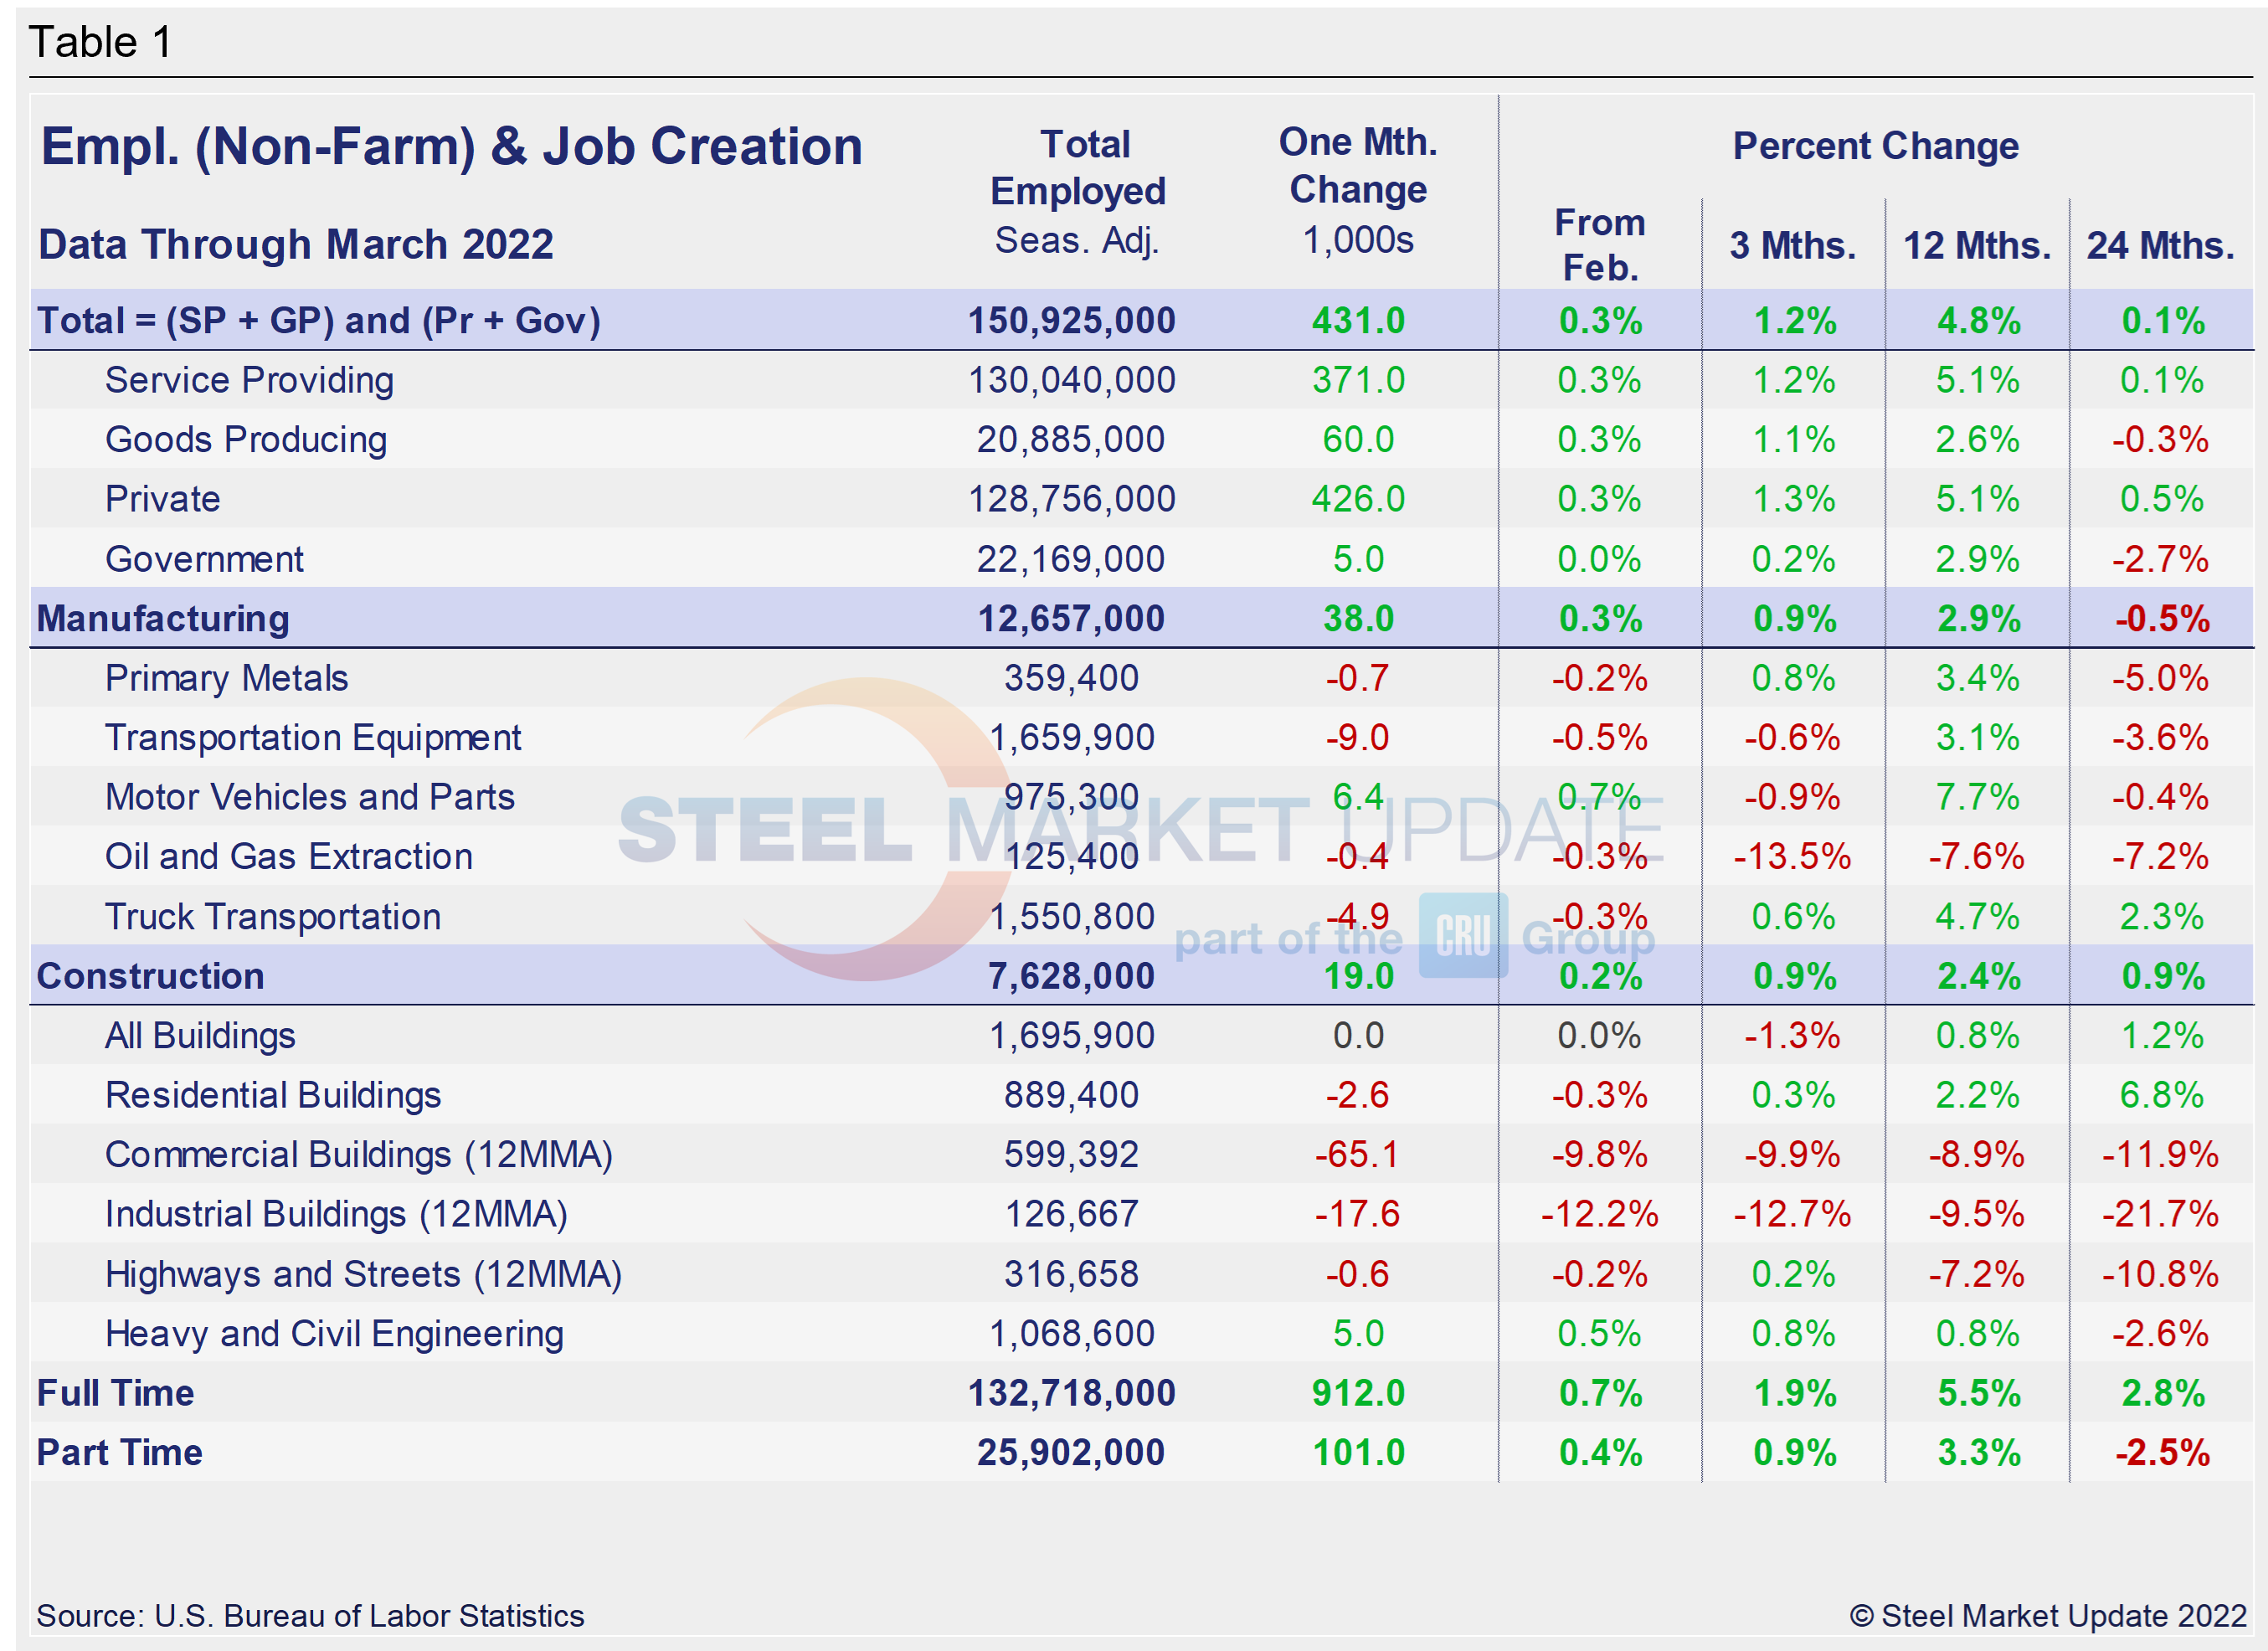
Comparing March to February, manufacturing employment was up 0.3%, a slightly slower pace than 0.4% growth the month prior. Construction saw a 0.2% gain last month after growing by 1.2% in February. The construction sector, which has been driven by the residential market, fell in March, posting a 0.3% decline following a 0.9% gain the month prior. Gains have been held back by struggling commercial and industrial building sectors. Despite the overall improvement, the inconsistencies in some of the subcomponents reflect the obstacles still facing the US economy and domestic job creation. The three-month and 12-month comparisons show a decent recovery but still lag the 24-month pre-pandemic comparisons. In the year-over-year contrast, manufacturing is up 2.9% and construction is up 2.4%. Further growth is expected as the marketplace recovers from Q2 2020, when the economy nearly collapsed following the outbreak of the COVID-19 pandemic.
Manufacturing employment added 38,000 jobs in March, up slightly from February, while construction employment gained 19,000 new jobs – a noticeable decline from the 60,000 new jobs created the month prior. The boost in February, likely driven by the withdrawal of the emergency vaccine mandate, didn’t maintain the strong growth trend in March.
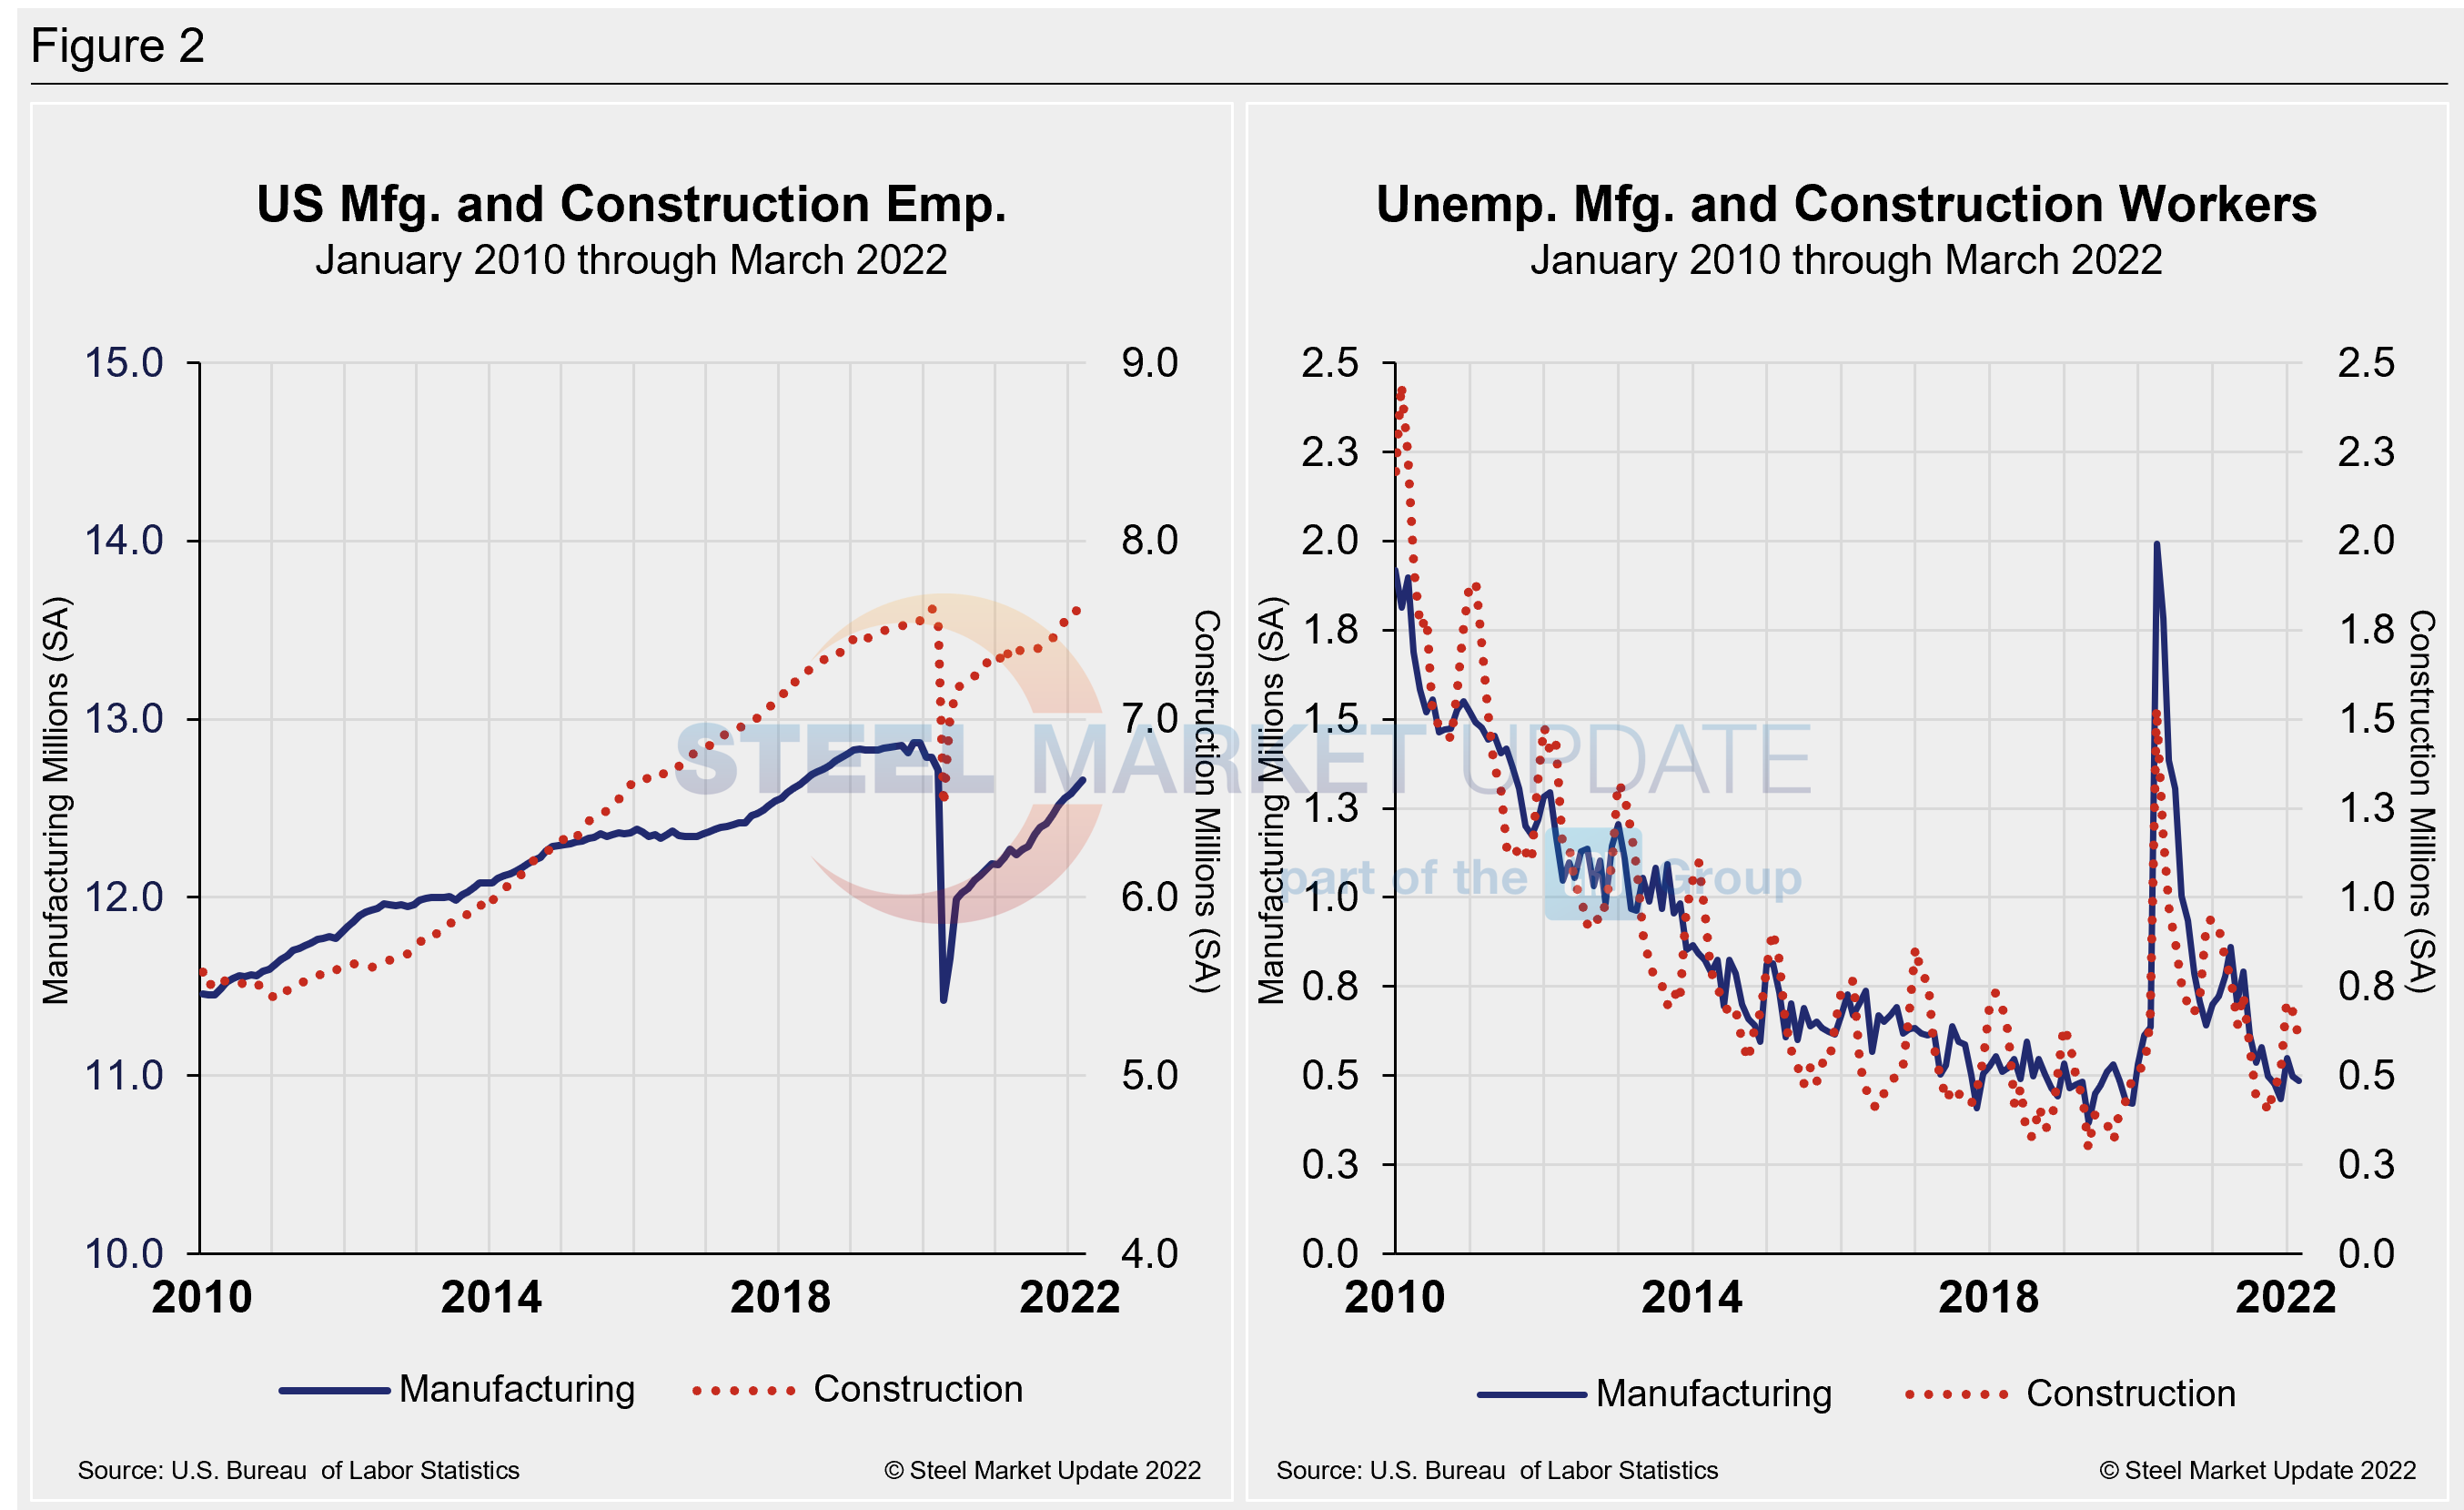
Construction and manufacturing unemployment fell in March for the second straight month. Construction unemployment fell 11.5% month on month, from 677,000 in February to 598,000 in March. Manufacturing’s unemployed fell from 497,000 in February to 485,000 last month, a 2.4% decline month on month. Both sectors have been heavily impacted by supply-chain disruptions and labor force constraints, on top of seasonality. Withdrawal of the vaccine mandate by the White House in late January boosted employment in these sectors, especially construction. Further growth should be seen in the coming months as a result.
The history of employment and unemployment in manufacturing and construction since January 2010 is shown below side-by-side in Figure 2, seasonally adjusted.
According to human resources consulting firm Challenger, Gray and Christmas Inc. most job cuts (5,301) in March were due to store, unit, or plant closing. Another 3,278 cuts were due to vaccine refusal, bringing the total number of cuts for this reason to 18,099 since June 2021. Of those, 14,422 were recorded in 2022.
For the fourth straight month, health care/products, which includes hospitals, health care products manufacturers, and other care-related entities, announced the most job cuts with 4,995. For the year, companies in this sector have announced 13,923, up 161% from the 5,333 announced through the same period last year.
Financial services announced the second-most job cuts this year with 5,903, followed by the services sector with 4,965. Warehousing companies announced 4,531 cuts in 2022.
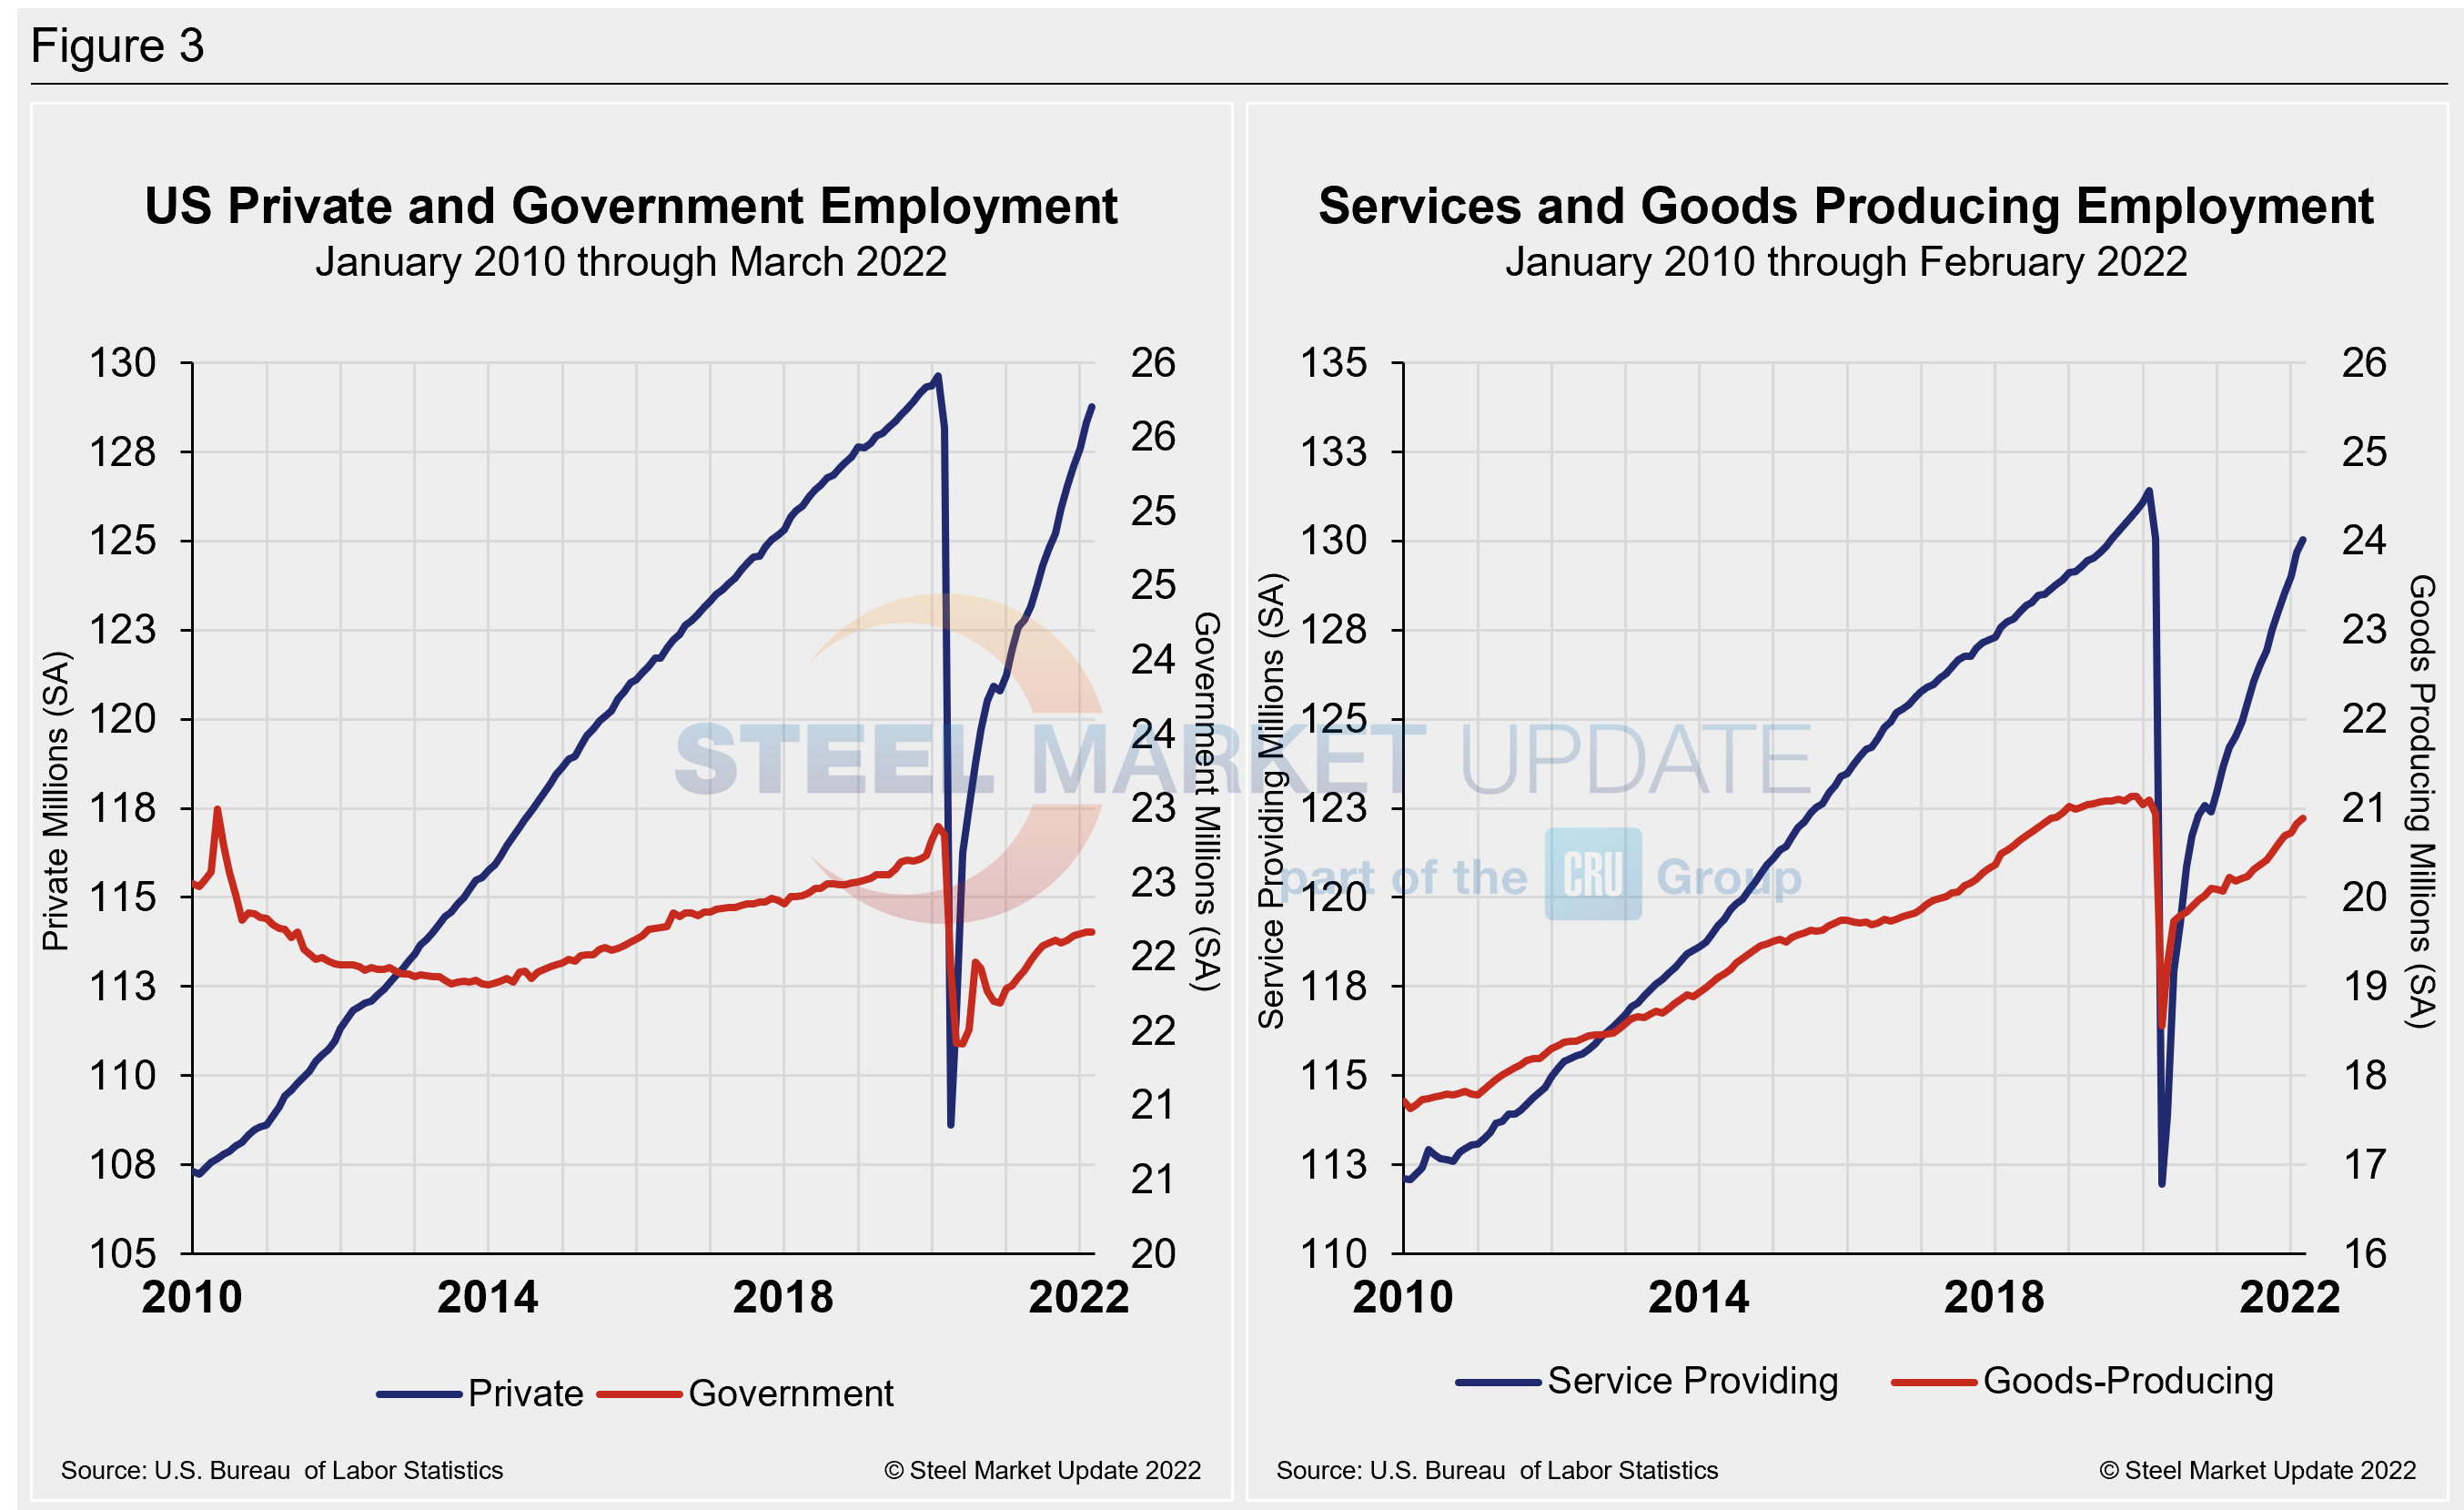
Figure 3 details employment comparisons between private and government jobs, as well as services and goods-producing jobs.
Explanation: On the first or second Friday of each month, the Bureau of Labor Statistics releases the employment data for the previous month. Data is available at www.bls.gov. The BLS employment database is a reality check for other economic data streams such as manufacturing and construction. It is easy to drill down into the BLS database to obtain employment data for many subsectors of the economy. The important point about all these data streams is not necessarily the nominal numbers, but the direction in which they are headed.
By David Schollaert, David@SteelMarketUpdate.com


