

Market Data

April 6, 2022
US Job Creation Maintains Momentum in March
Written by David Schollaert
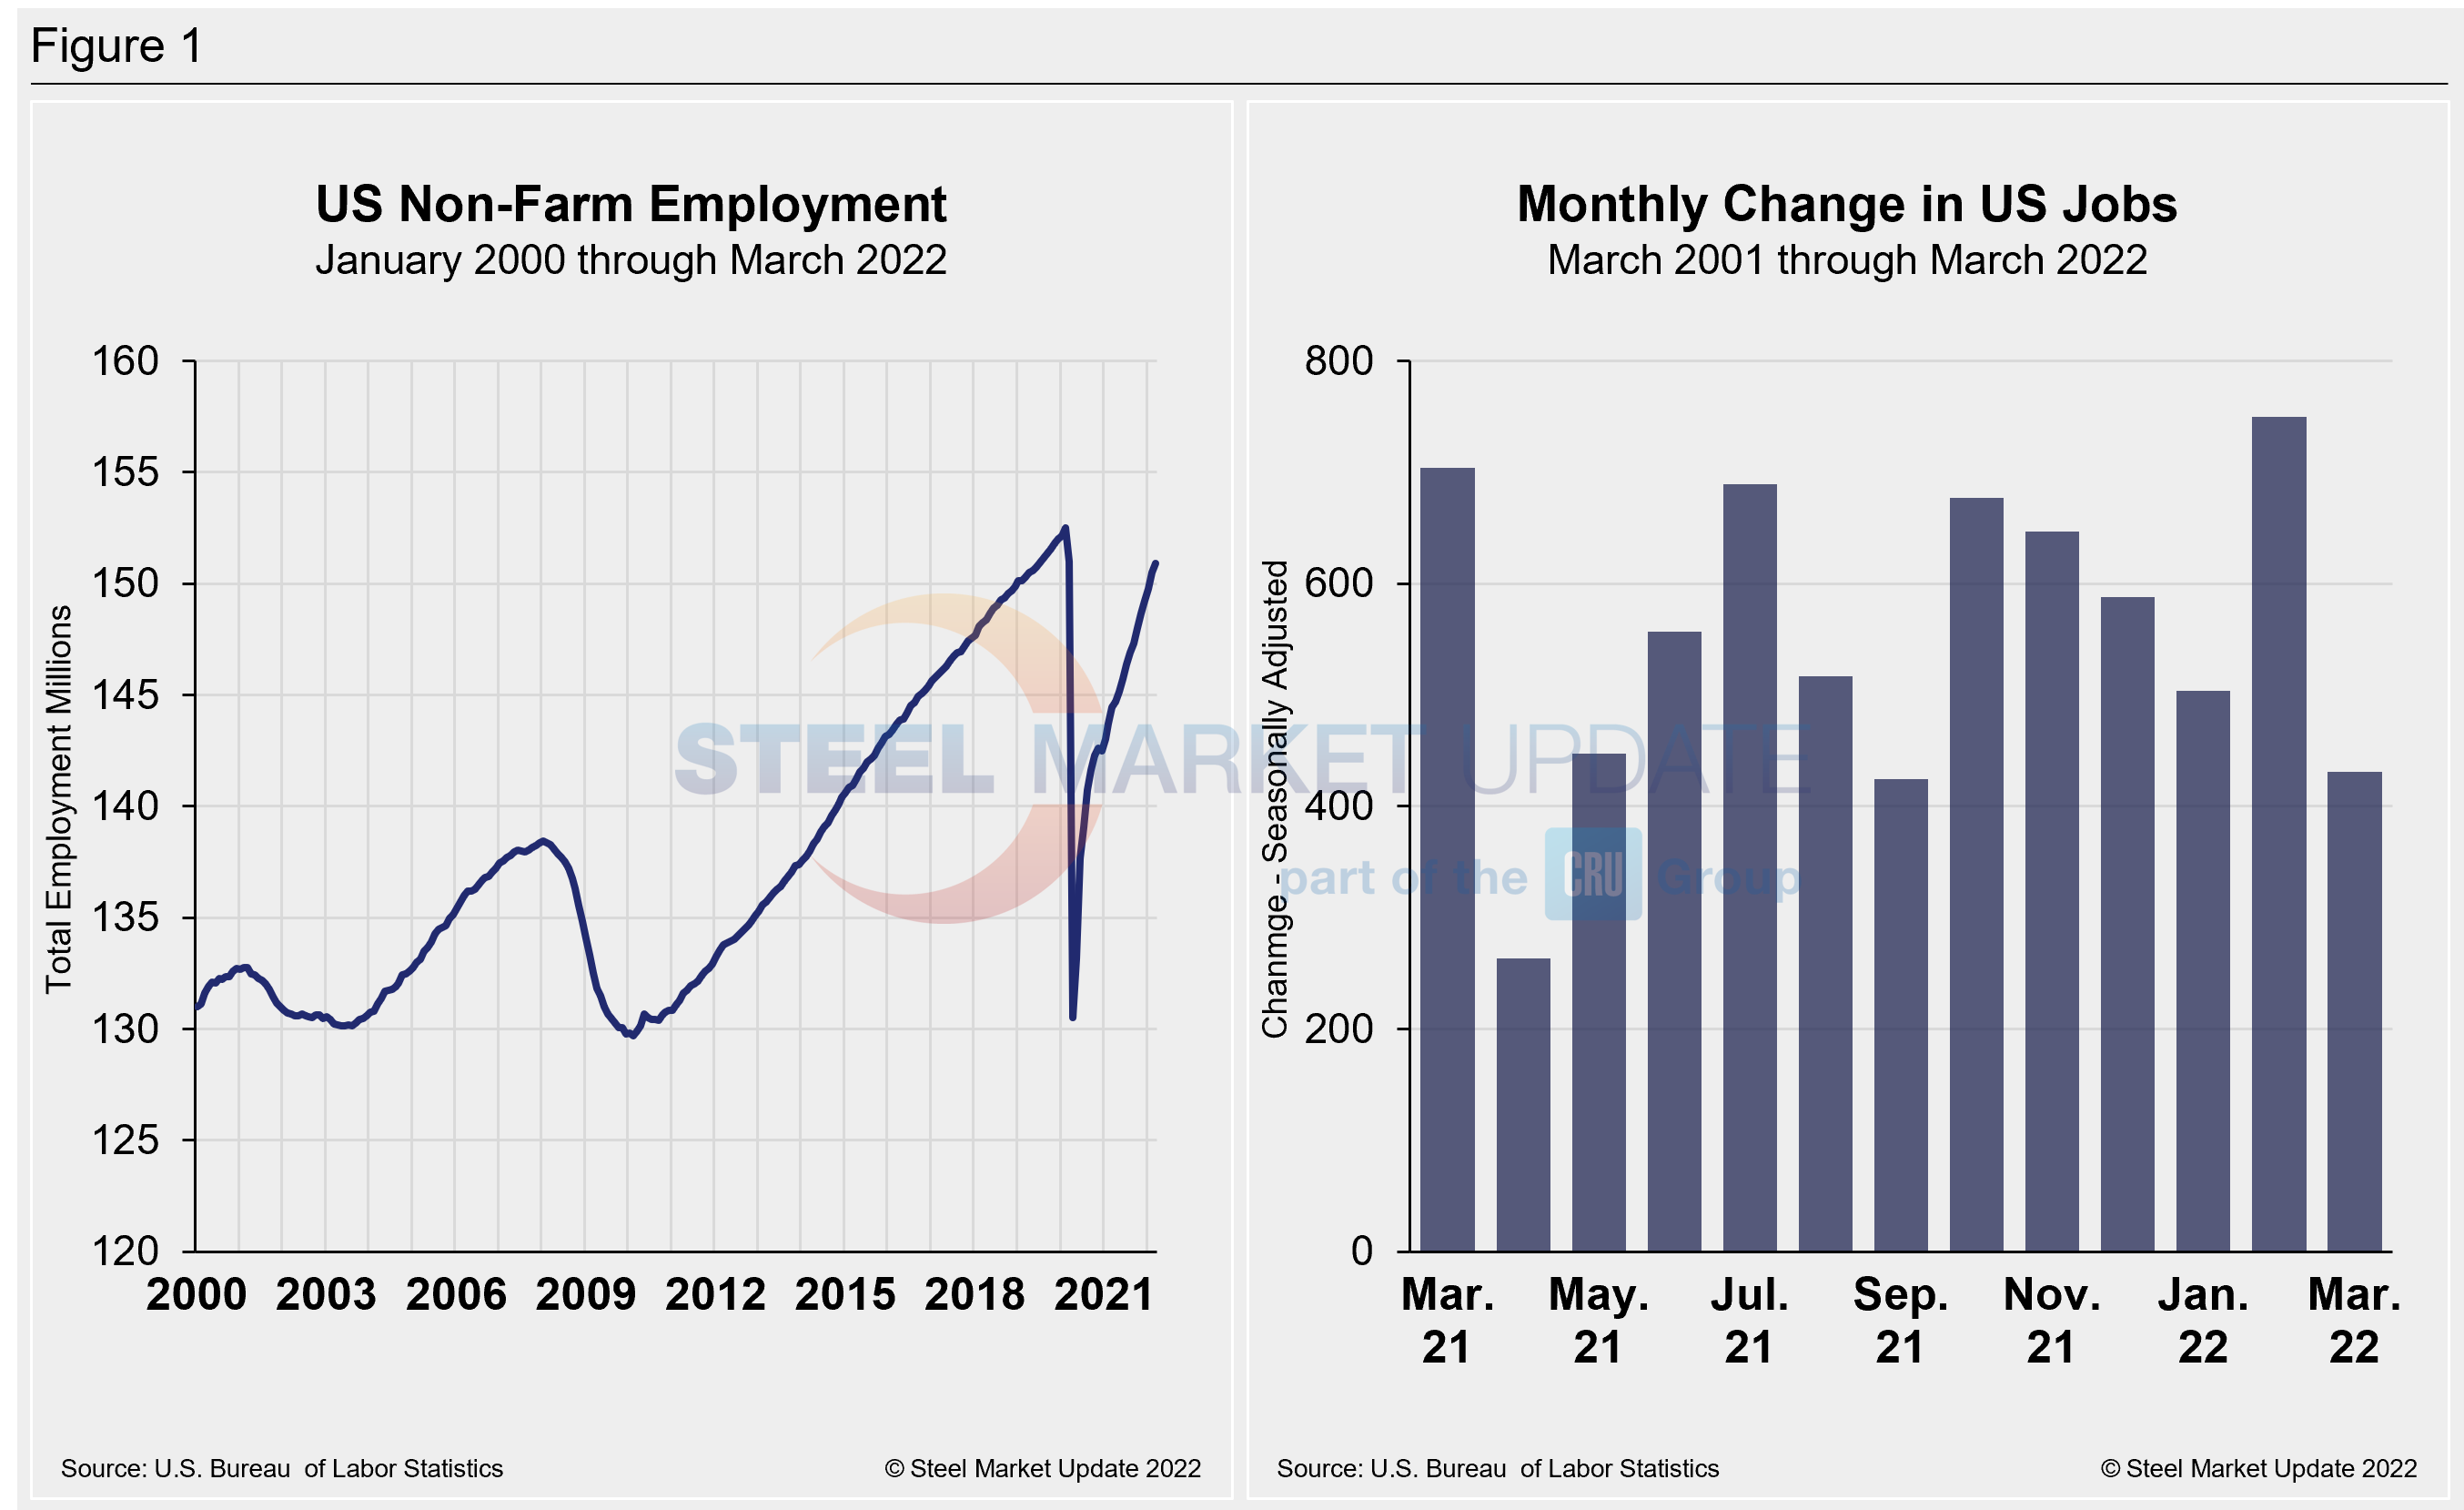
US job growth was strong in March. The hiring pace was boosted by consumer demand and declining COVID-19 caseloads. Employers added 431,000 jobs last month, bringing the unemployment rate down to 3.6% from 3.8% a month earlier. That rate is just a touch higher than levels right before the pandemic hit in 2020, according to the Labor Department.
Following a near record in February and the biggest gain in seven months, March’s gains suggest that many workers who had been kept out of the labor force have been returning as pandemic-related factors eased.
Leisure and hospitality led the way, accounting for roughly a quarter of the overall jobs added. Travel, live entertainment, indoor dining, museums, historical sites, bars, and other drinking places all had major job increases. The economy has recovered more than 90% of the 22 million jobs lost at the peak of the pandemic’s lockdowns in the spring of 2020 — a far swifter rebound than forecasters initially expected.
The labor force participation rate reached 62.4%, the highest pandemic-era total, and just a percentage point below the level on the eve of the pandemic. Side-by-side in Figure 1 below is a snapshot of the pace of hiring since March 2021 and the total number of nonfarm workers employed in the US since 2000.
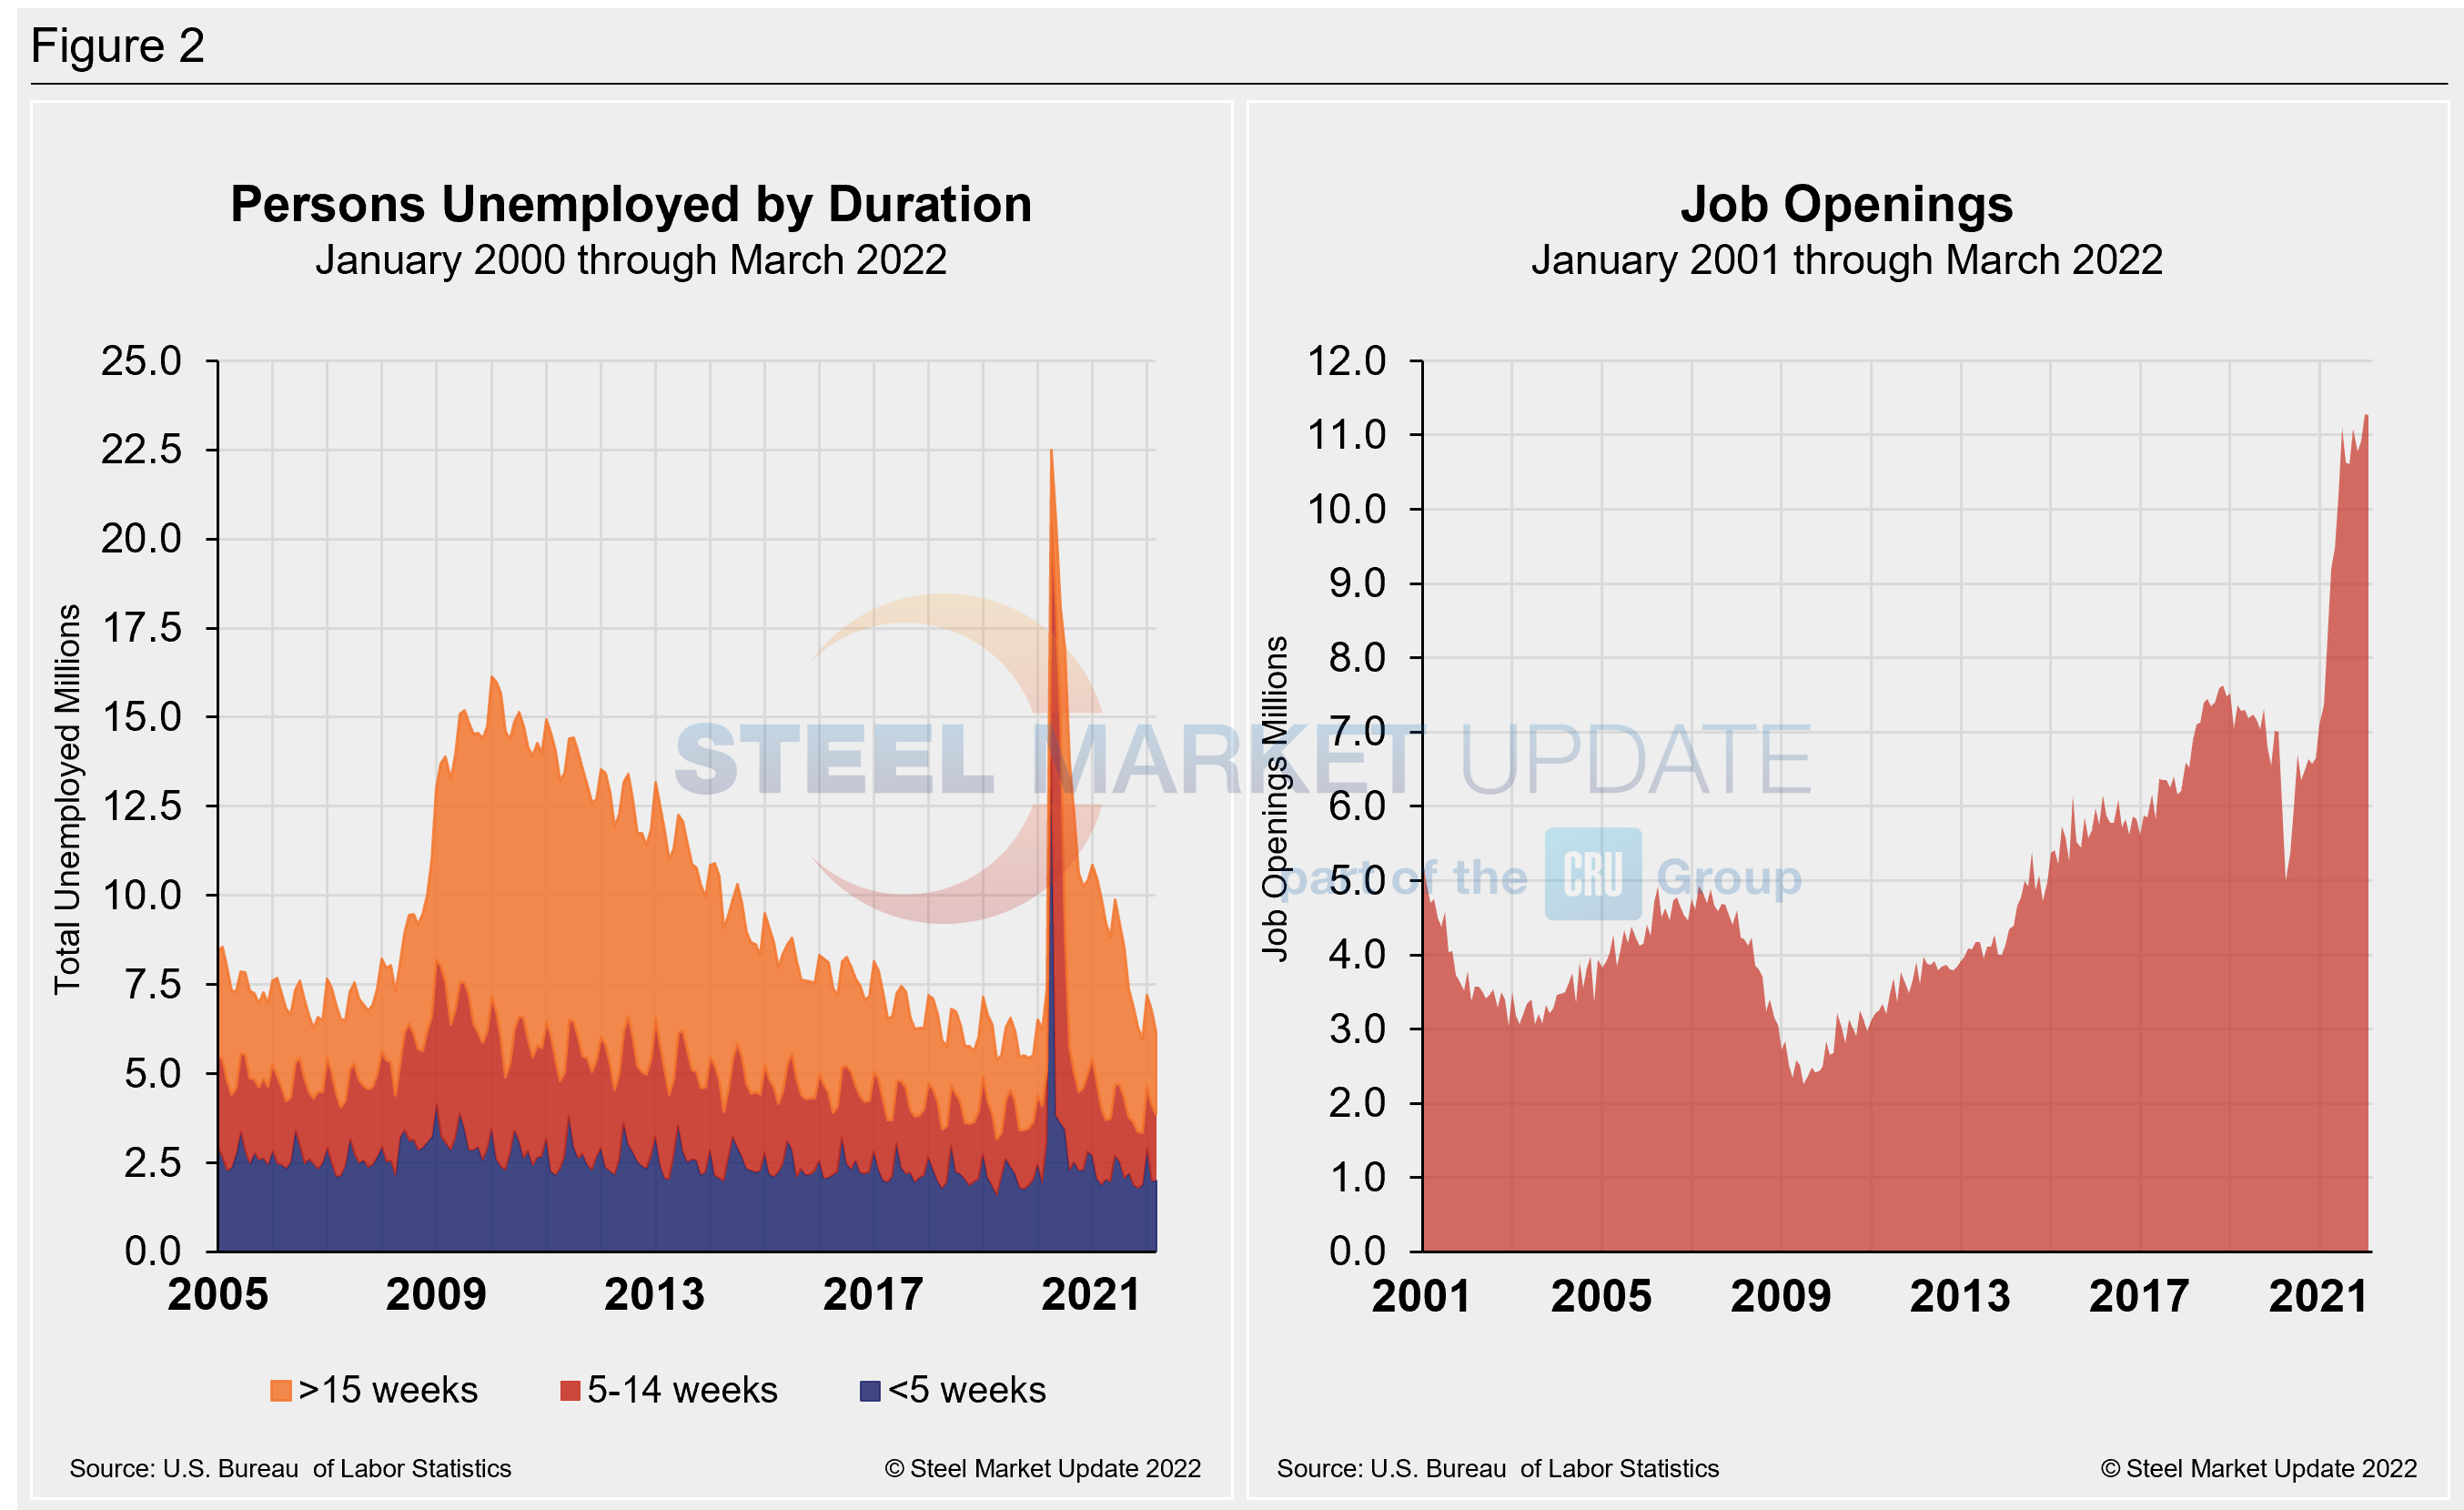
The number of long-term unemployed (out of work for at least 27 consecutive weeks) fell by 274,000 to 1.4 million in March versus February. That figure accounted for 23.9% of the total unemployed in the month. This measure is down from a recent high of 4.0 million last year but is 307,000 higher than in February 2020.
The historic picture for the duration of unemployment since January 2000 is broken down into <5 weeks, 5 to 14 weeks, and >15 weeks in Figure 2. The total number of unemployed was 6.186 million at the end of March, a decrease of 596,000 compared to February. The result pushed the unemployment total below pre-pandemic levels for the first time – 32,000 fewer unemployed persons than in February 2020.
March’s results show that roughly 16.318 million more people now have jobs compared to the 22.5 million thrown out of work during the worst of the pandemic in April of 2020. As of April 3, 37.4% had been unemployed for more than 15 weeks, 29.9% for 5 to 14 weeks, and 32.4% for less than 5 weeks.
As part of March’s employment report, the Labor Department released its monthly report on job openings, layoffs, and quitting through the last day of February. The data serve as an indicator of how much demand there is for workers in the US economy and the extent to which employers are still struggling with labor shortages nearly two years removed from the worst of the pandemic.
February’s job openings held at near-record levels, suggesting that workers remain in high demand and are still quitting more often. There were about 11.3 million job openings in February, essentially the same as the month before and down slightly from a record in December. The number of hires overall edged up by 263,000 last month, to about 6.7 million.
The charts below (Figure 2) detail the total persons unemployed by duration from 2005 through March 2022 and the total job openings over the same period.
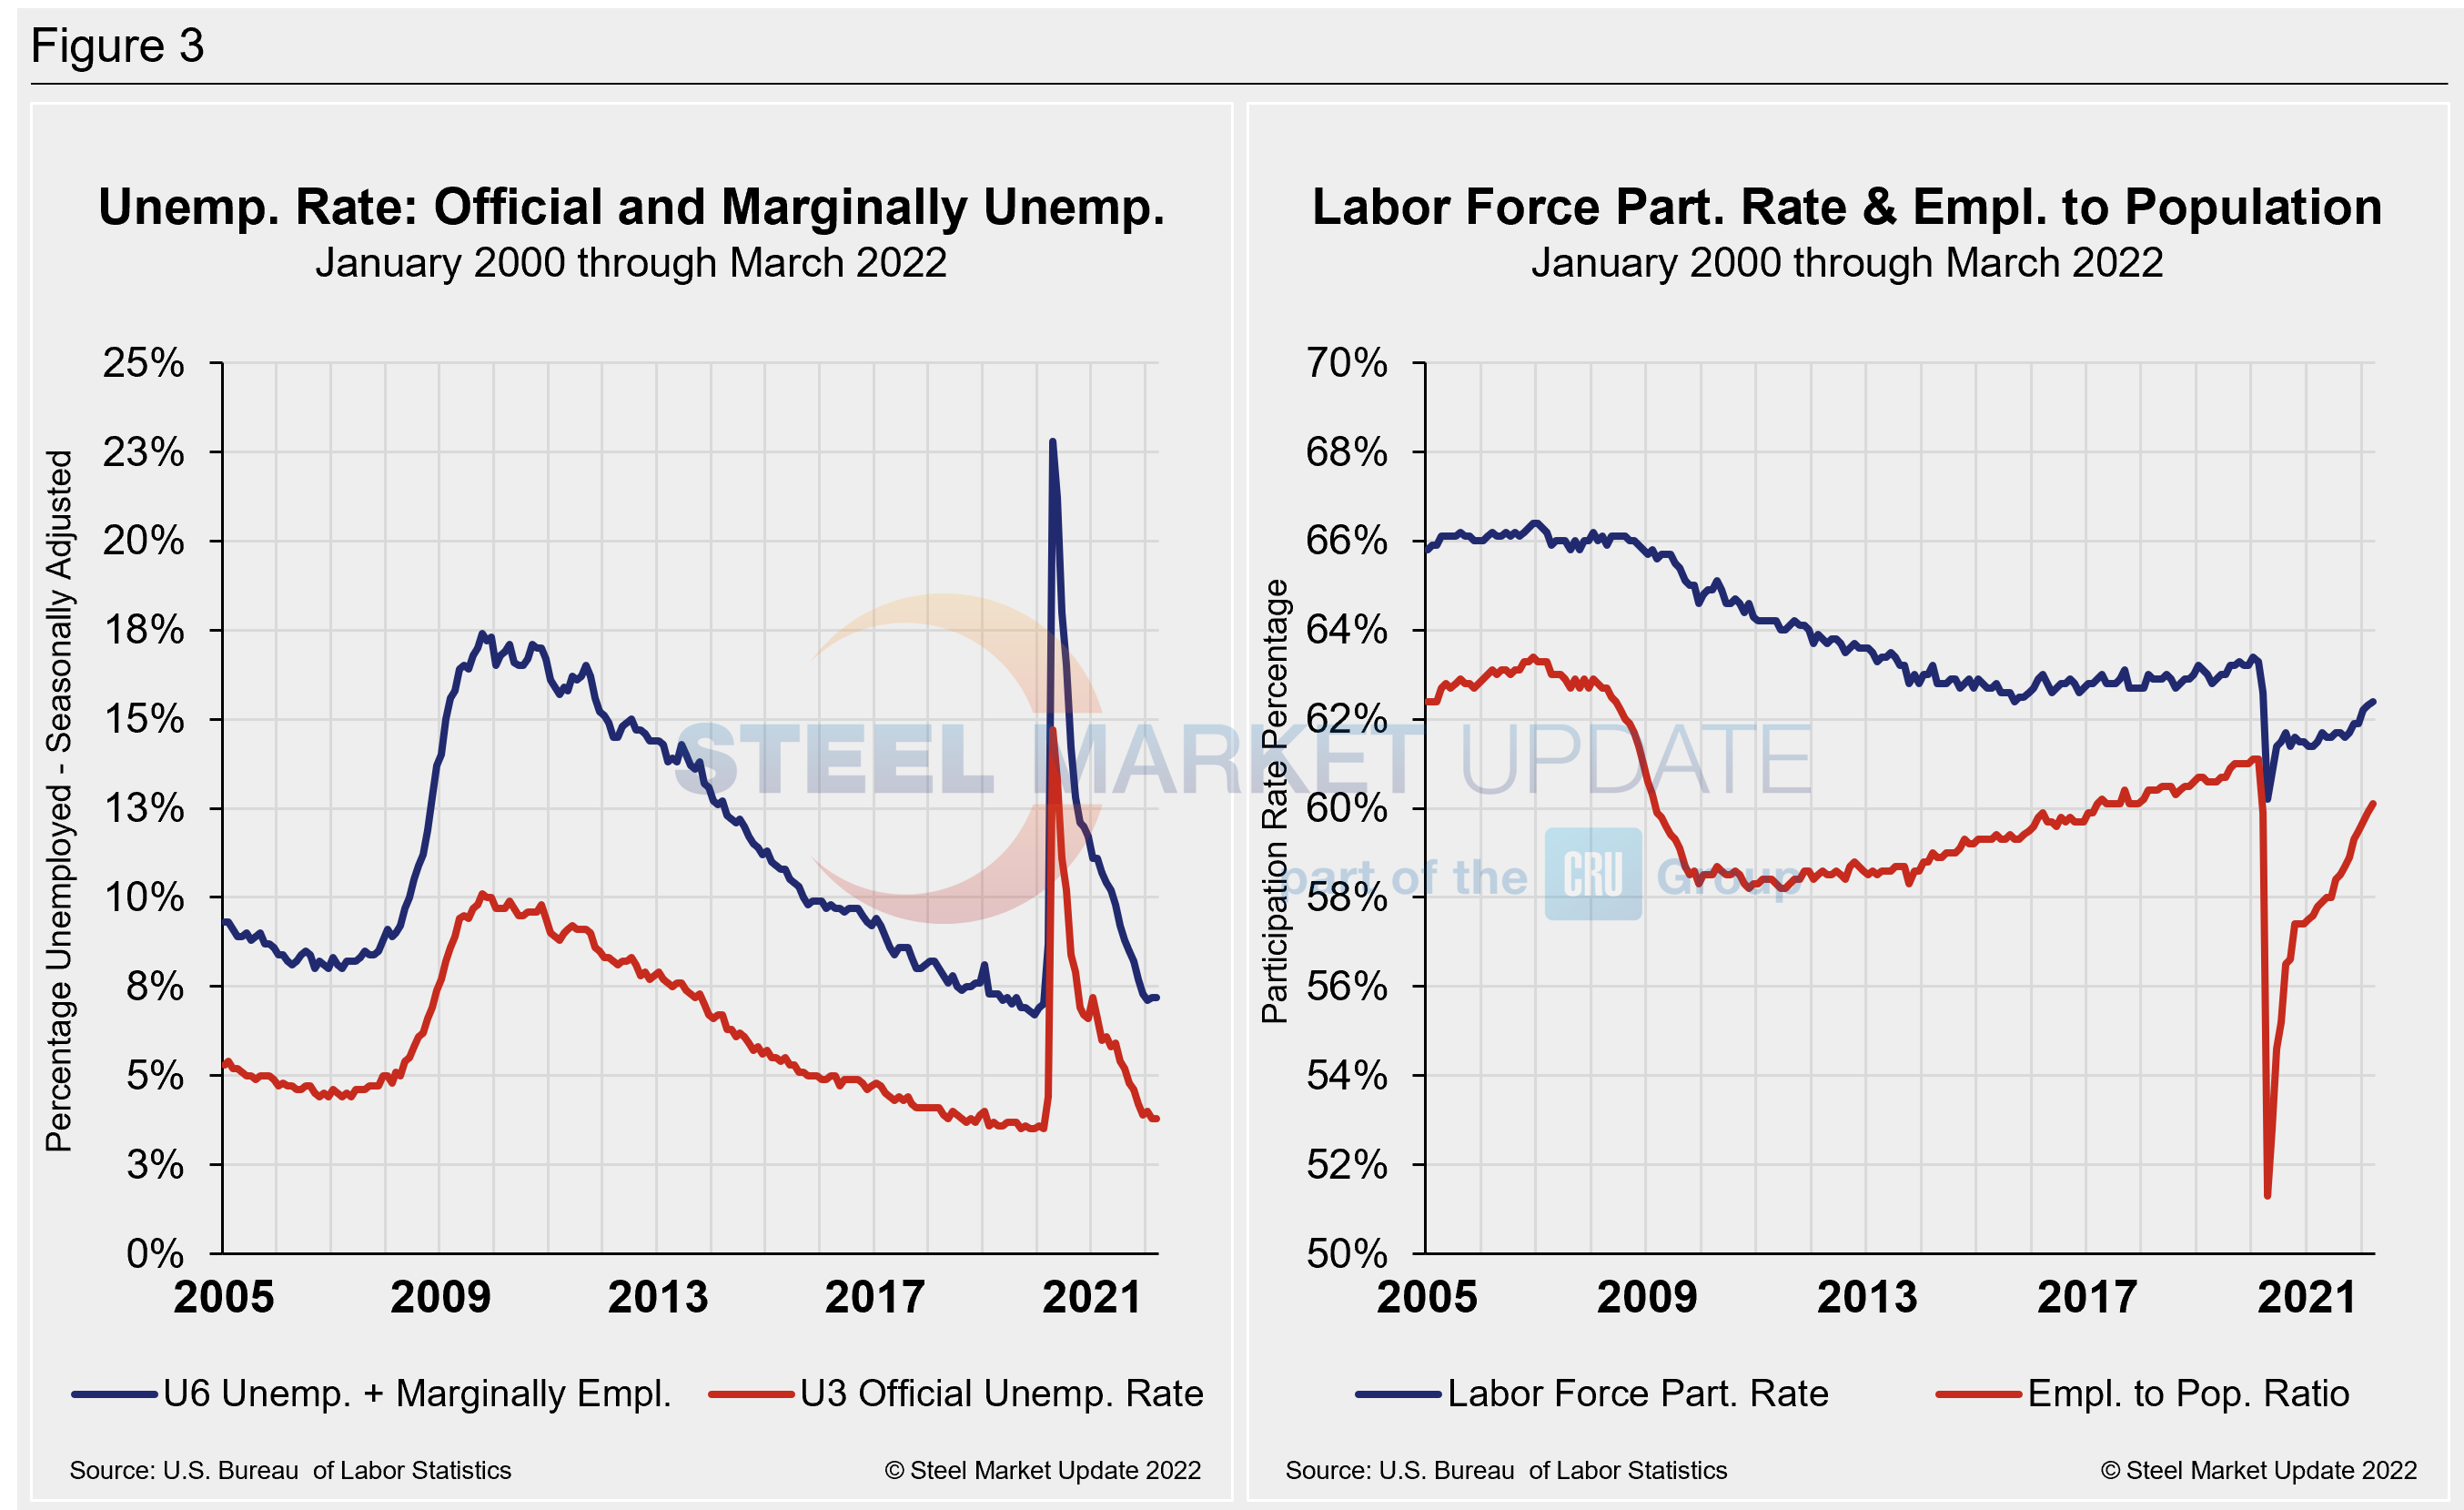
The official unemployment rate, U3, reported in the Bureau of Labor Statistics Household survey (see explanation below), increased from 3.5% in February 2020 to 14.7% in April 2020. Since April 2020, it has trended down at a slow pace, bottoming out at 3.9% in December, before edging up to 4.0% in January. In February, the U3 rate dipped to 3.8% and has held there in March, the lowest mark in two years. U6, a more encompassing measure of unemployment that includes discouraged workers and those holding part-time jobs for economic reasons, grew and was unchanged in March at 7.2%.
Another gauge, and a more definitive view, are the number employed as a percentage of the population. Last month, the employment-to-population ratio was 60.1%, a marginal increase from February and the fourth straight month of growth. The repeated gains highlight the challenges many companies continue to report in filling openings.
Figure 3 details side-by-side parallels of the unemployment rate (both the U3 and U6 rates) since 2005 as well as the labor force participation rate and employment to population ratio over the same period.
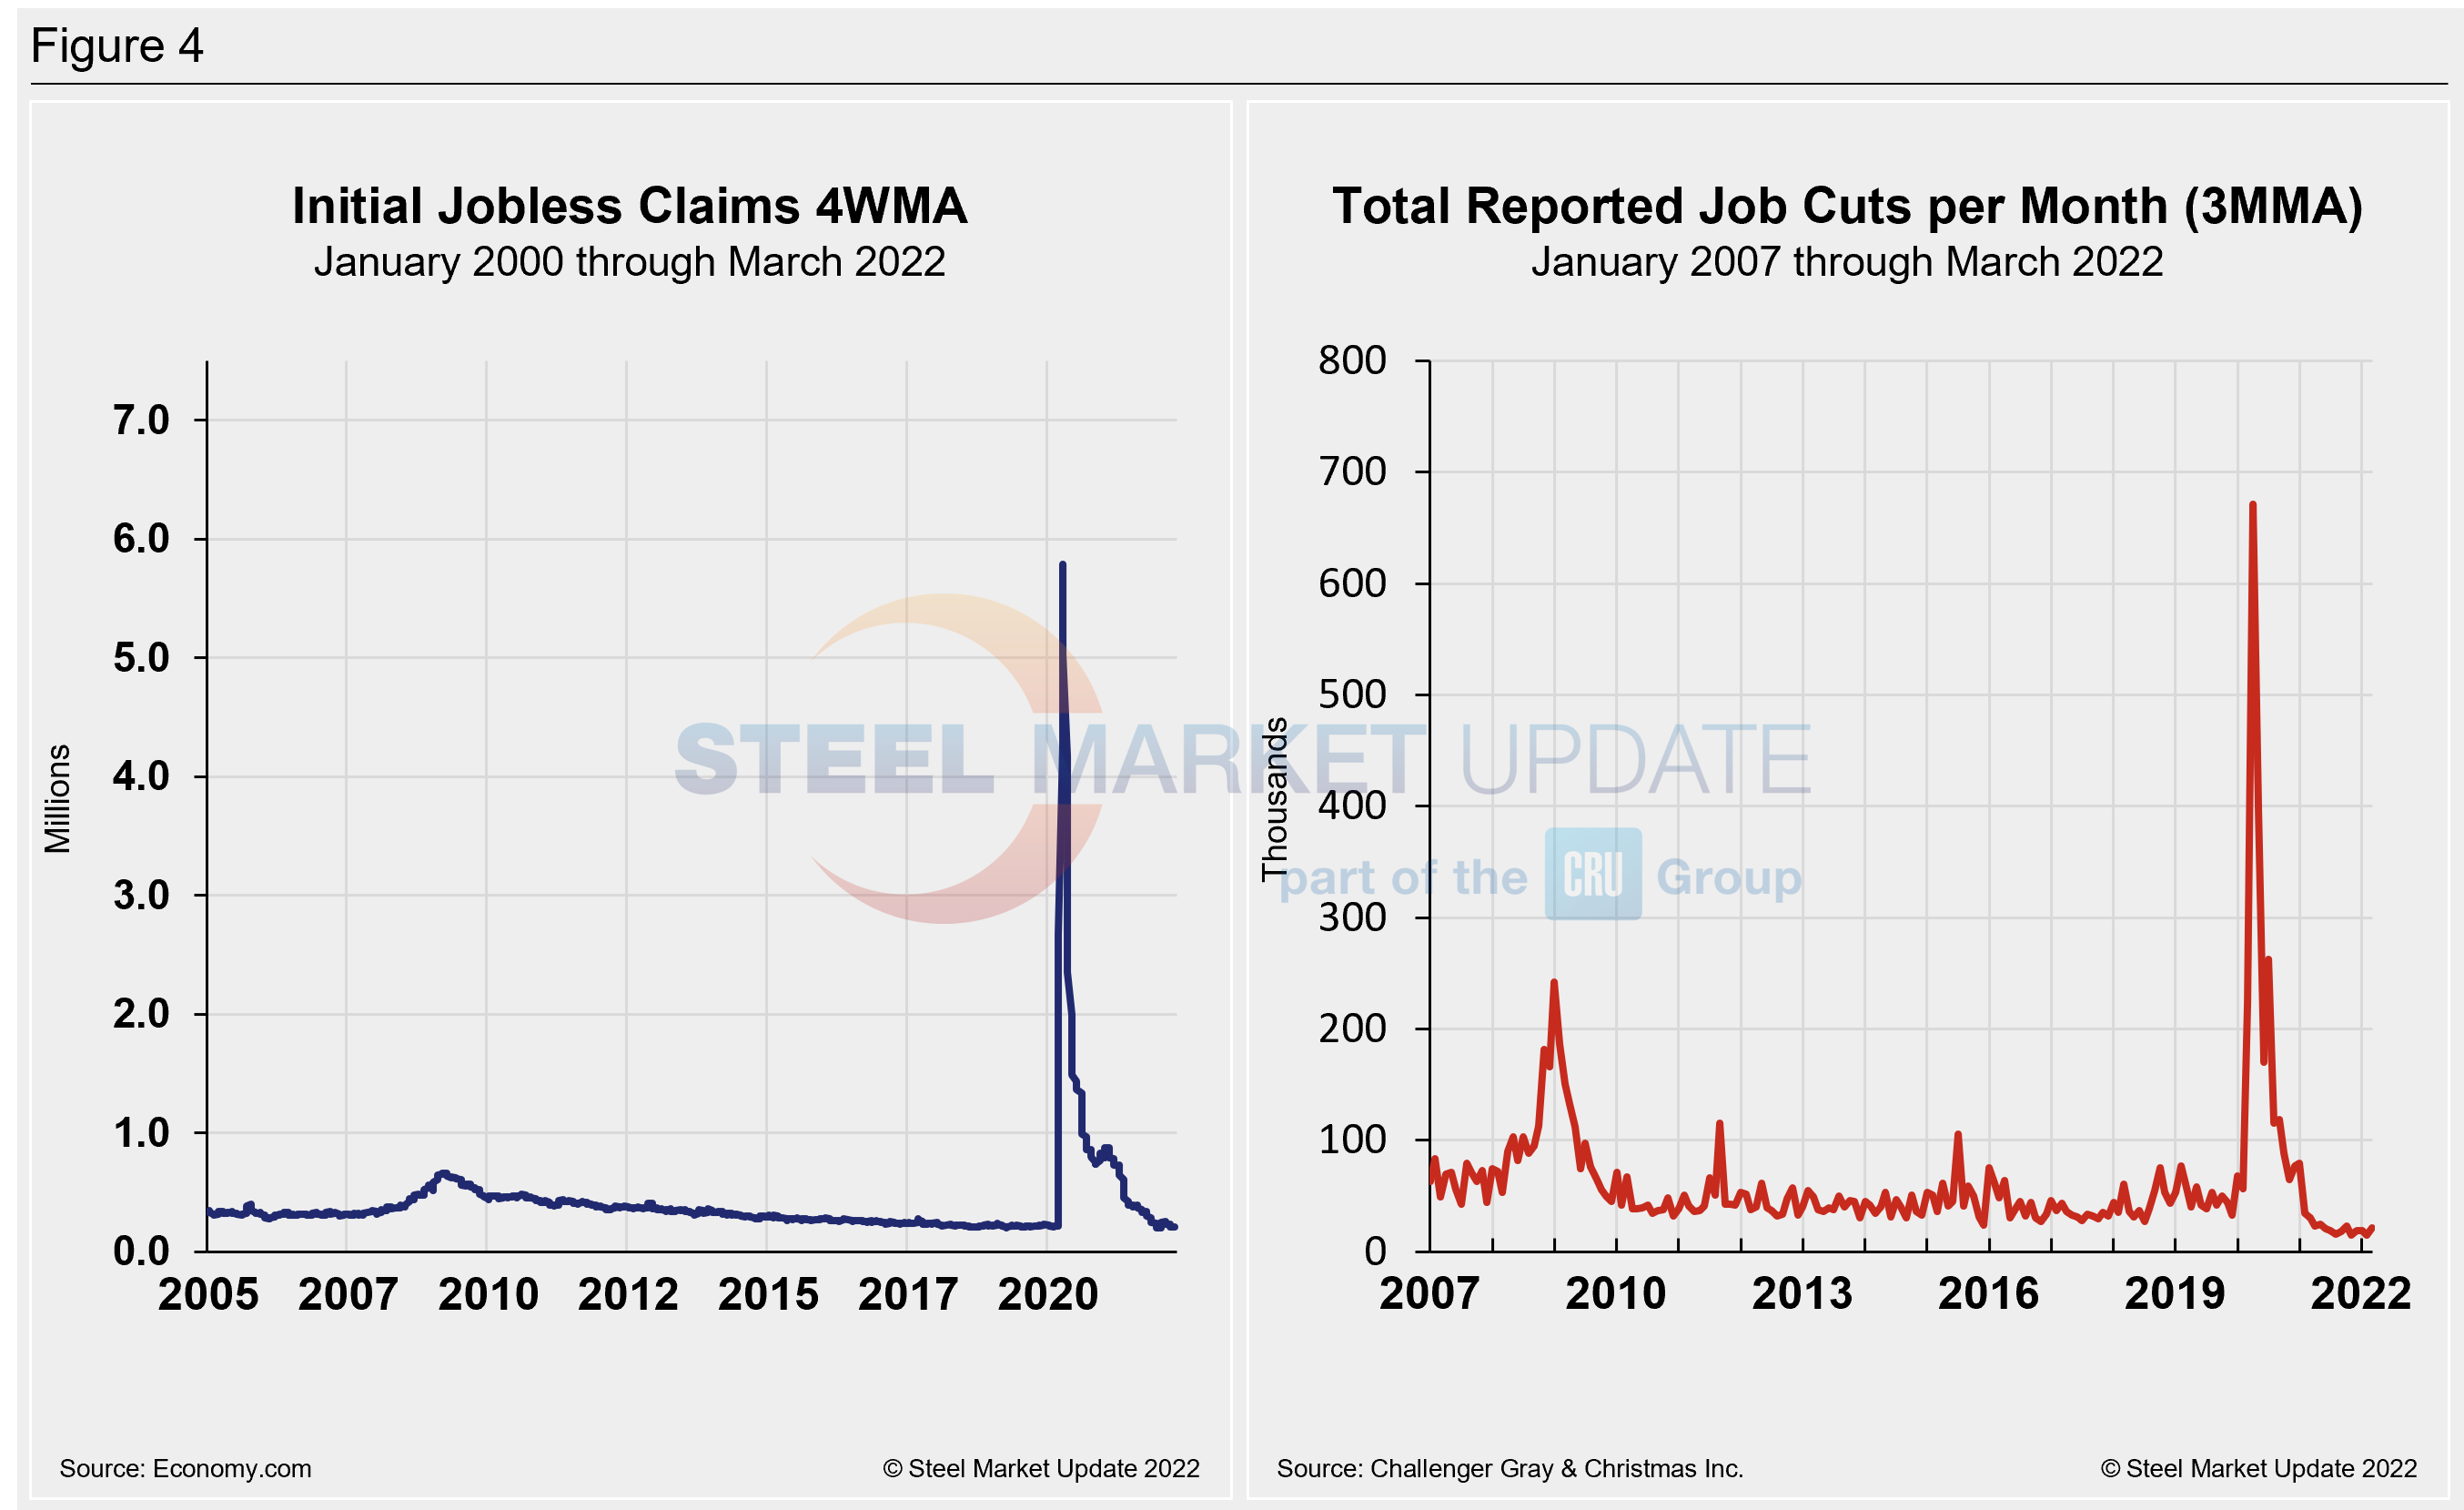
Initial claims for unemployment insurance, which are reported weekly by the Department of Labor, rose by 14,000 to 202,000 in the week ended March 26, following a 27,000 decrease the week prior.
“The rise reverses only some of the decline in the prior week that put new filings among the lowest since September 1969,” reported Economy.com. “The four-week moving average in initial claims fell by 3,500 to 208,500. Businesses are reluctant to lay off workers because of the difficulty in filling open positions.”
Continuing claims for unemployment insurance benefits dropped by 35,000 to 1.307 million in the week ended March 19, the report noted, while the insured unemployment rate slipped from 1% to 0.9%.
Human resources consulting firm Challenger, Gray and Christmas Inc. produces a monthly employment update for the US. It reported that job cuts in March totaled 21,387, up from 15,245 announced the prior month. That is the highest monthly total since October 2021, when 22,822 cuts were announced.
March’s total is 30% lower than the same year-ago period when 30,603 cuts were announced. But employers have announced plans to hire 105,224 workers.
In the first quarter of 2022, employers announced 55,696 cuts, down 62% from the 144,686 cuts announced through the same period in 2021. It is the lowest quarterly total since the third quarter of 2021, when 52,560 cuts were recorded.
“There appears to be a return of a healthier churn in the labor market,” said Challenger. “Some US Employers report hiring is getting easier, particularly with the incentives many companies put in place to attract and retain talent. Meanwhile, inflation impacts and war concerns are causing workers who were depending on savings or investments to seek out paid employment.”
The government announced the highest number of hiring plans with 17,337, followed by retail with 16,166. Food manufacturers and suppliers announced plans to hire 15,490 last month, the highest February total on record.
Figure 4 shows the four-week moving average of new claims since January 2005, seasonally adjusted. It also shows the total, reported job cuts per month, according to Challenger, on a three-month moving average.
Explanation: On the first Friday of each month, the Bureau of Labor Statistics releases the employment data for the previous month. Data is available at www.bls.gov. The BLS reports on the results of two surveys. The Establishment survey reports the actual number employed by industry. The Household survey reports on the unemployment rate, participation rate, earnings, average workweek, the breakout into full-time and part-time workers and lots more details describing the age breakdown of the unemployed, reasons for and duration of unemployment.
By David Schollaert, David@SteelMarketUpdate.com


