

Market Data

May 6, 2022
Employment by Industry: Manufacturing Expands in April, Construction Holds
Written by David Schollaert
The US labor market expanded at a rapid pace in April, adding 428,000 new jobs, matching the downwardly revised 428,000 increase in March. The result kept the unemployment rate unchanged month-on-month (MoM) at the pandemic-era low of 3.6%, the Bureau of Labor Statistics reported.
Payroll gains were better than economists had expected amid an increasingly tight labor market and despite surging inflation and fears of a slowdown. April was the 16th straight month of robust job gains, according to the BLS figures released last Friday.
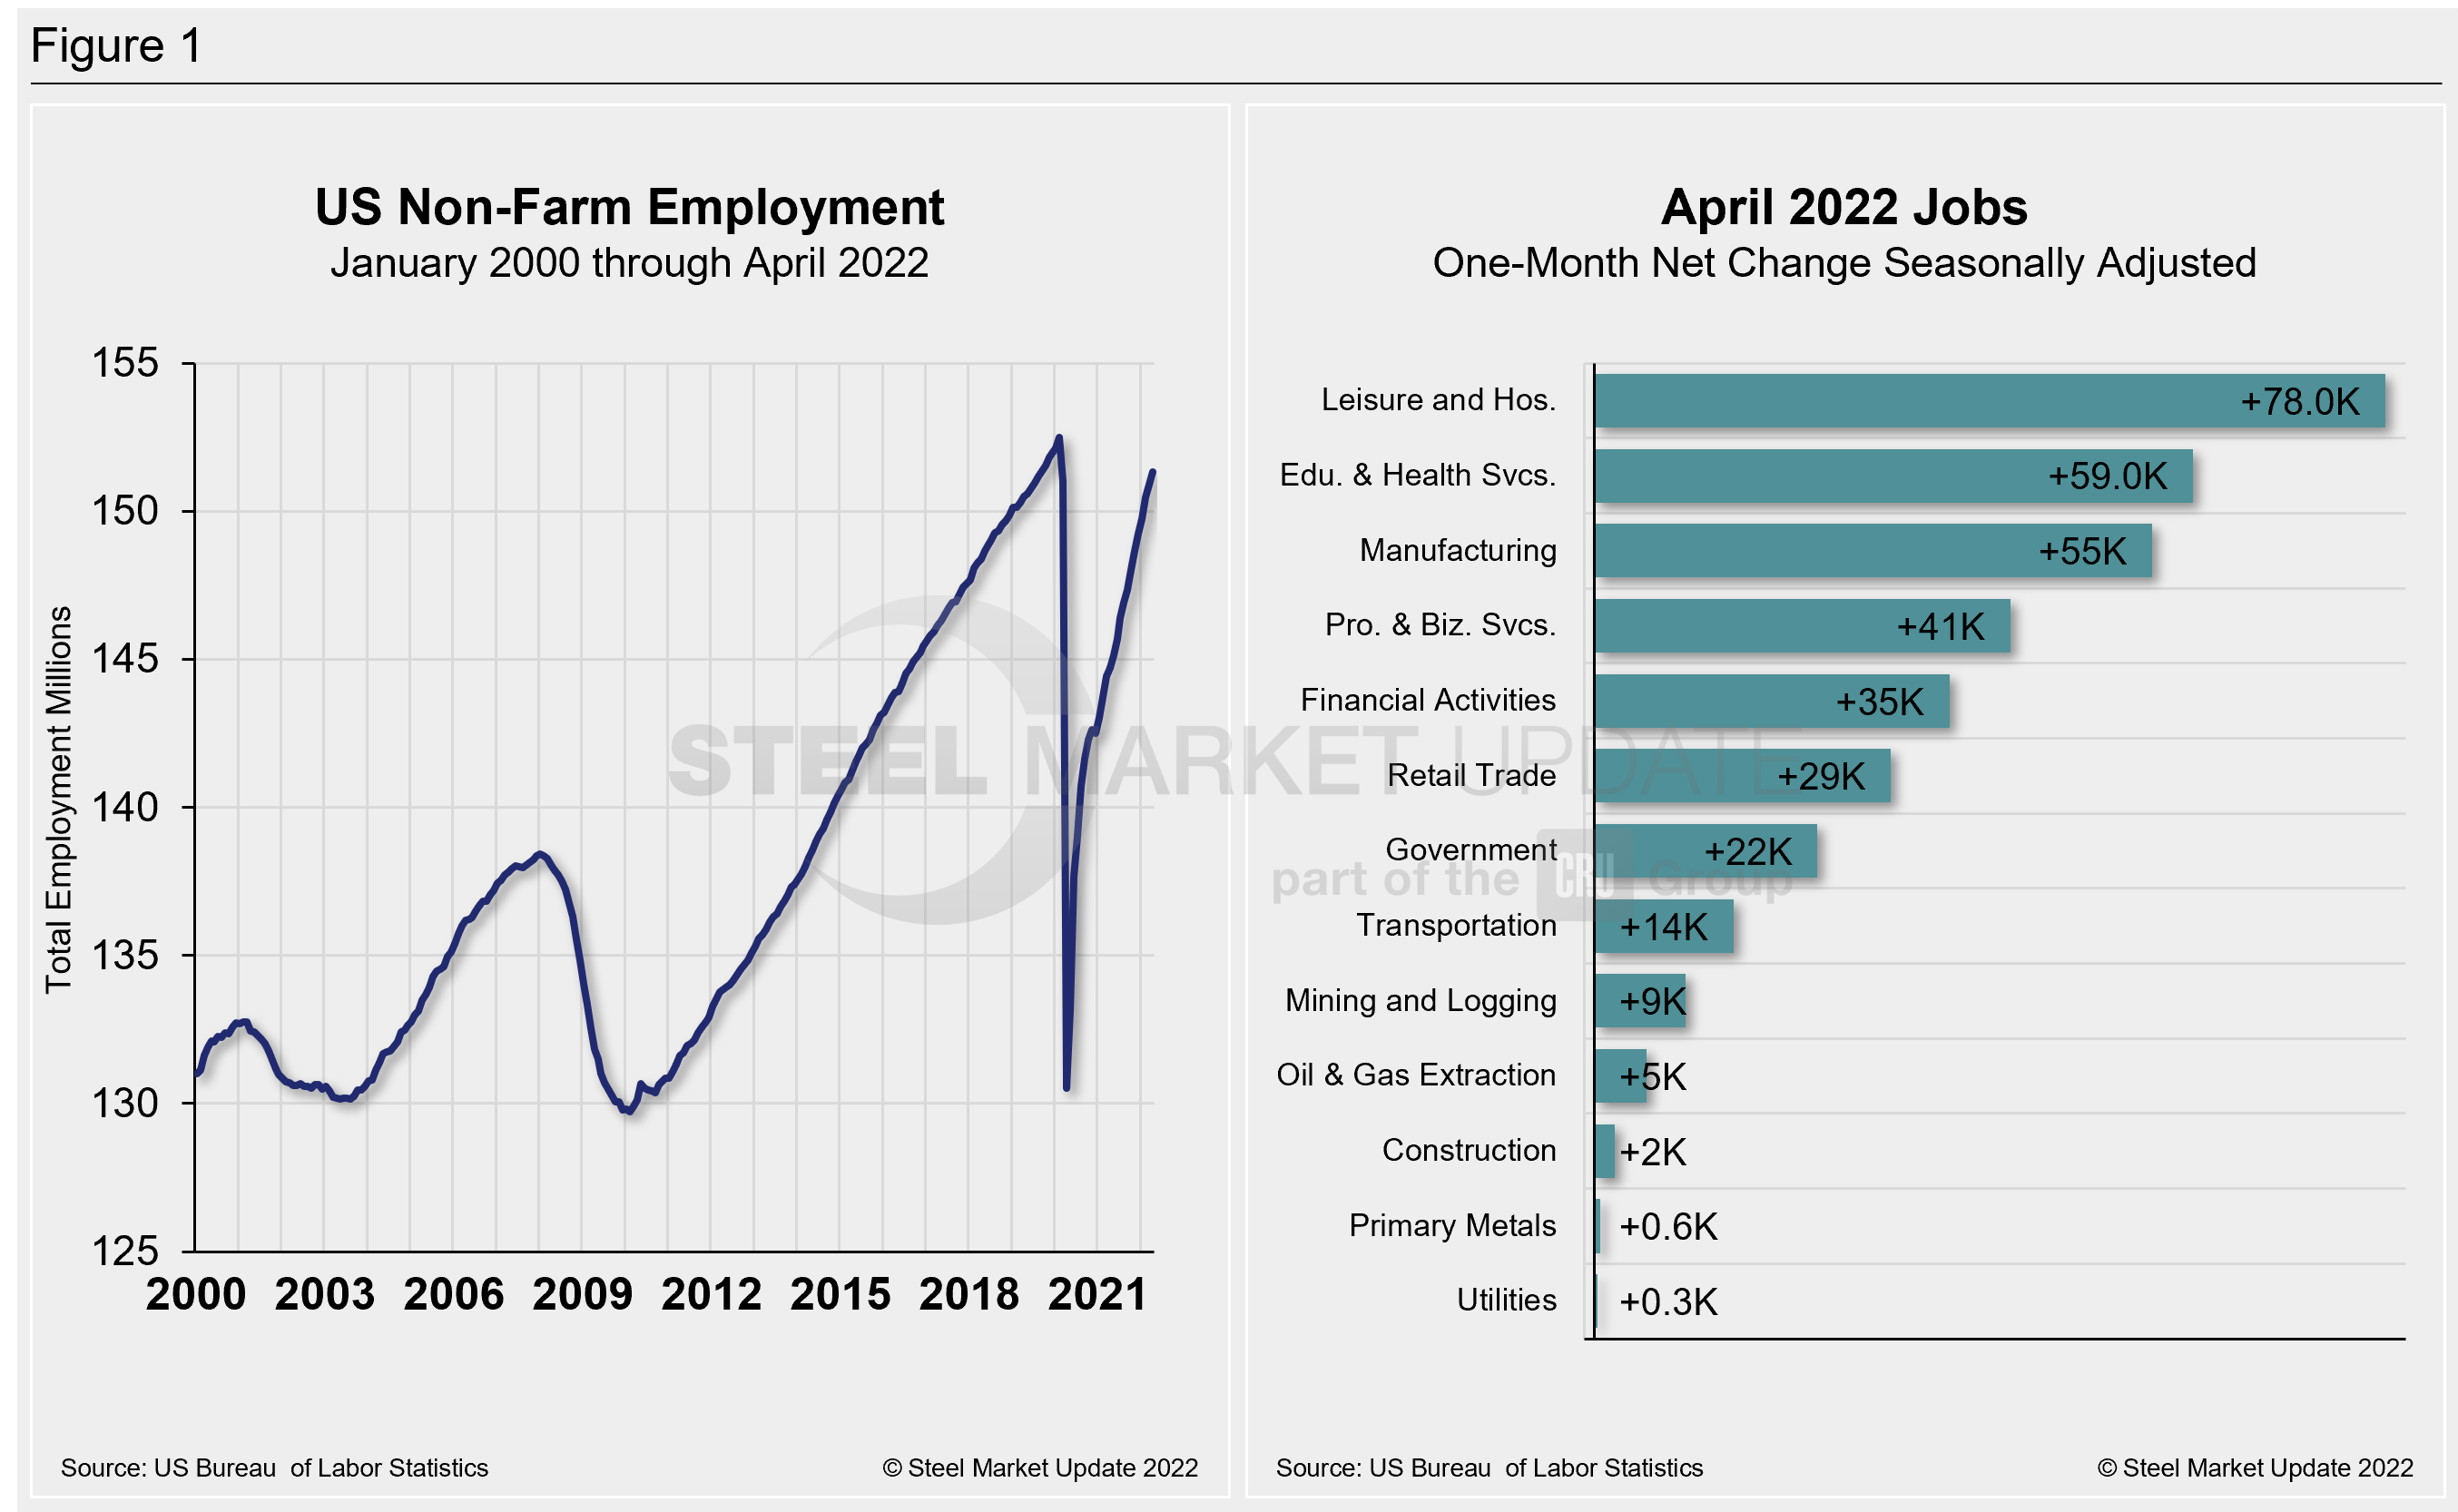
Job growth was “widespread”, according to the labor department, with the leisure and hospitality sector accounting for the largest monthly gain with 78,000 new positions. Manufacturing jobs increased by 55,000, while those for transportation and warehousing rose by 52,000. Construction positions were little changed, while retail jobs grew by 29,000.
Professional and business services added 41,000 to payrolls, while financial activities and health care saw increases of 35,000 and 34,000, respectively.
Shown below in Figure 1 is the total number of people employed in the nonfarm economy as well as the month-on-month net change in total jobs in April.
Designed on rolling time periods of 1 month, 3 months, 1 year, and 2 years, the table below breaks total employment into service industries and goods-producing industries, and then into private and government employees. Most of the goods-producing employees work in manufacturing and construction. Comparing service and goods-producing industries in April shows both increased by just 0.3%. The steady month-on-month gains have pushed both above pre-pandemic levels. Note, that the subcomponents of both manufacturing and construction shown in this table do not add up to the total because we have only included those with the most relevance to the steel industry.
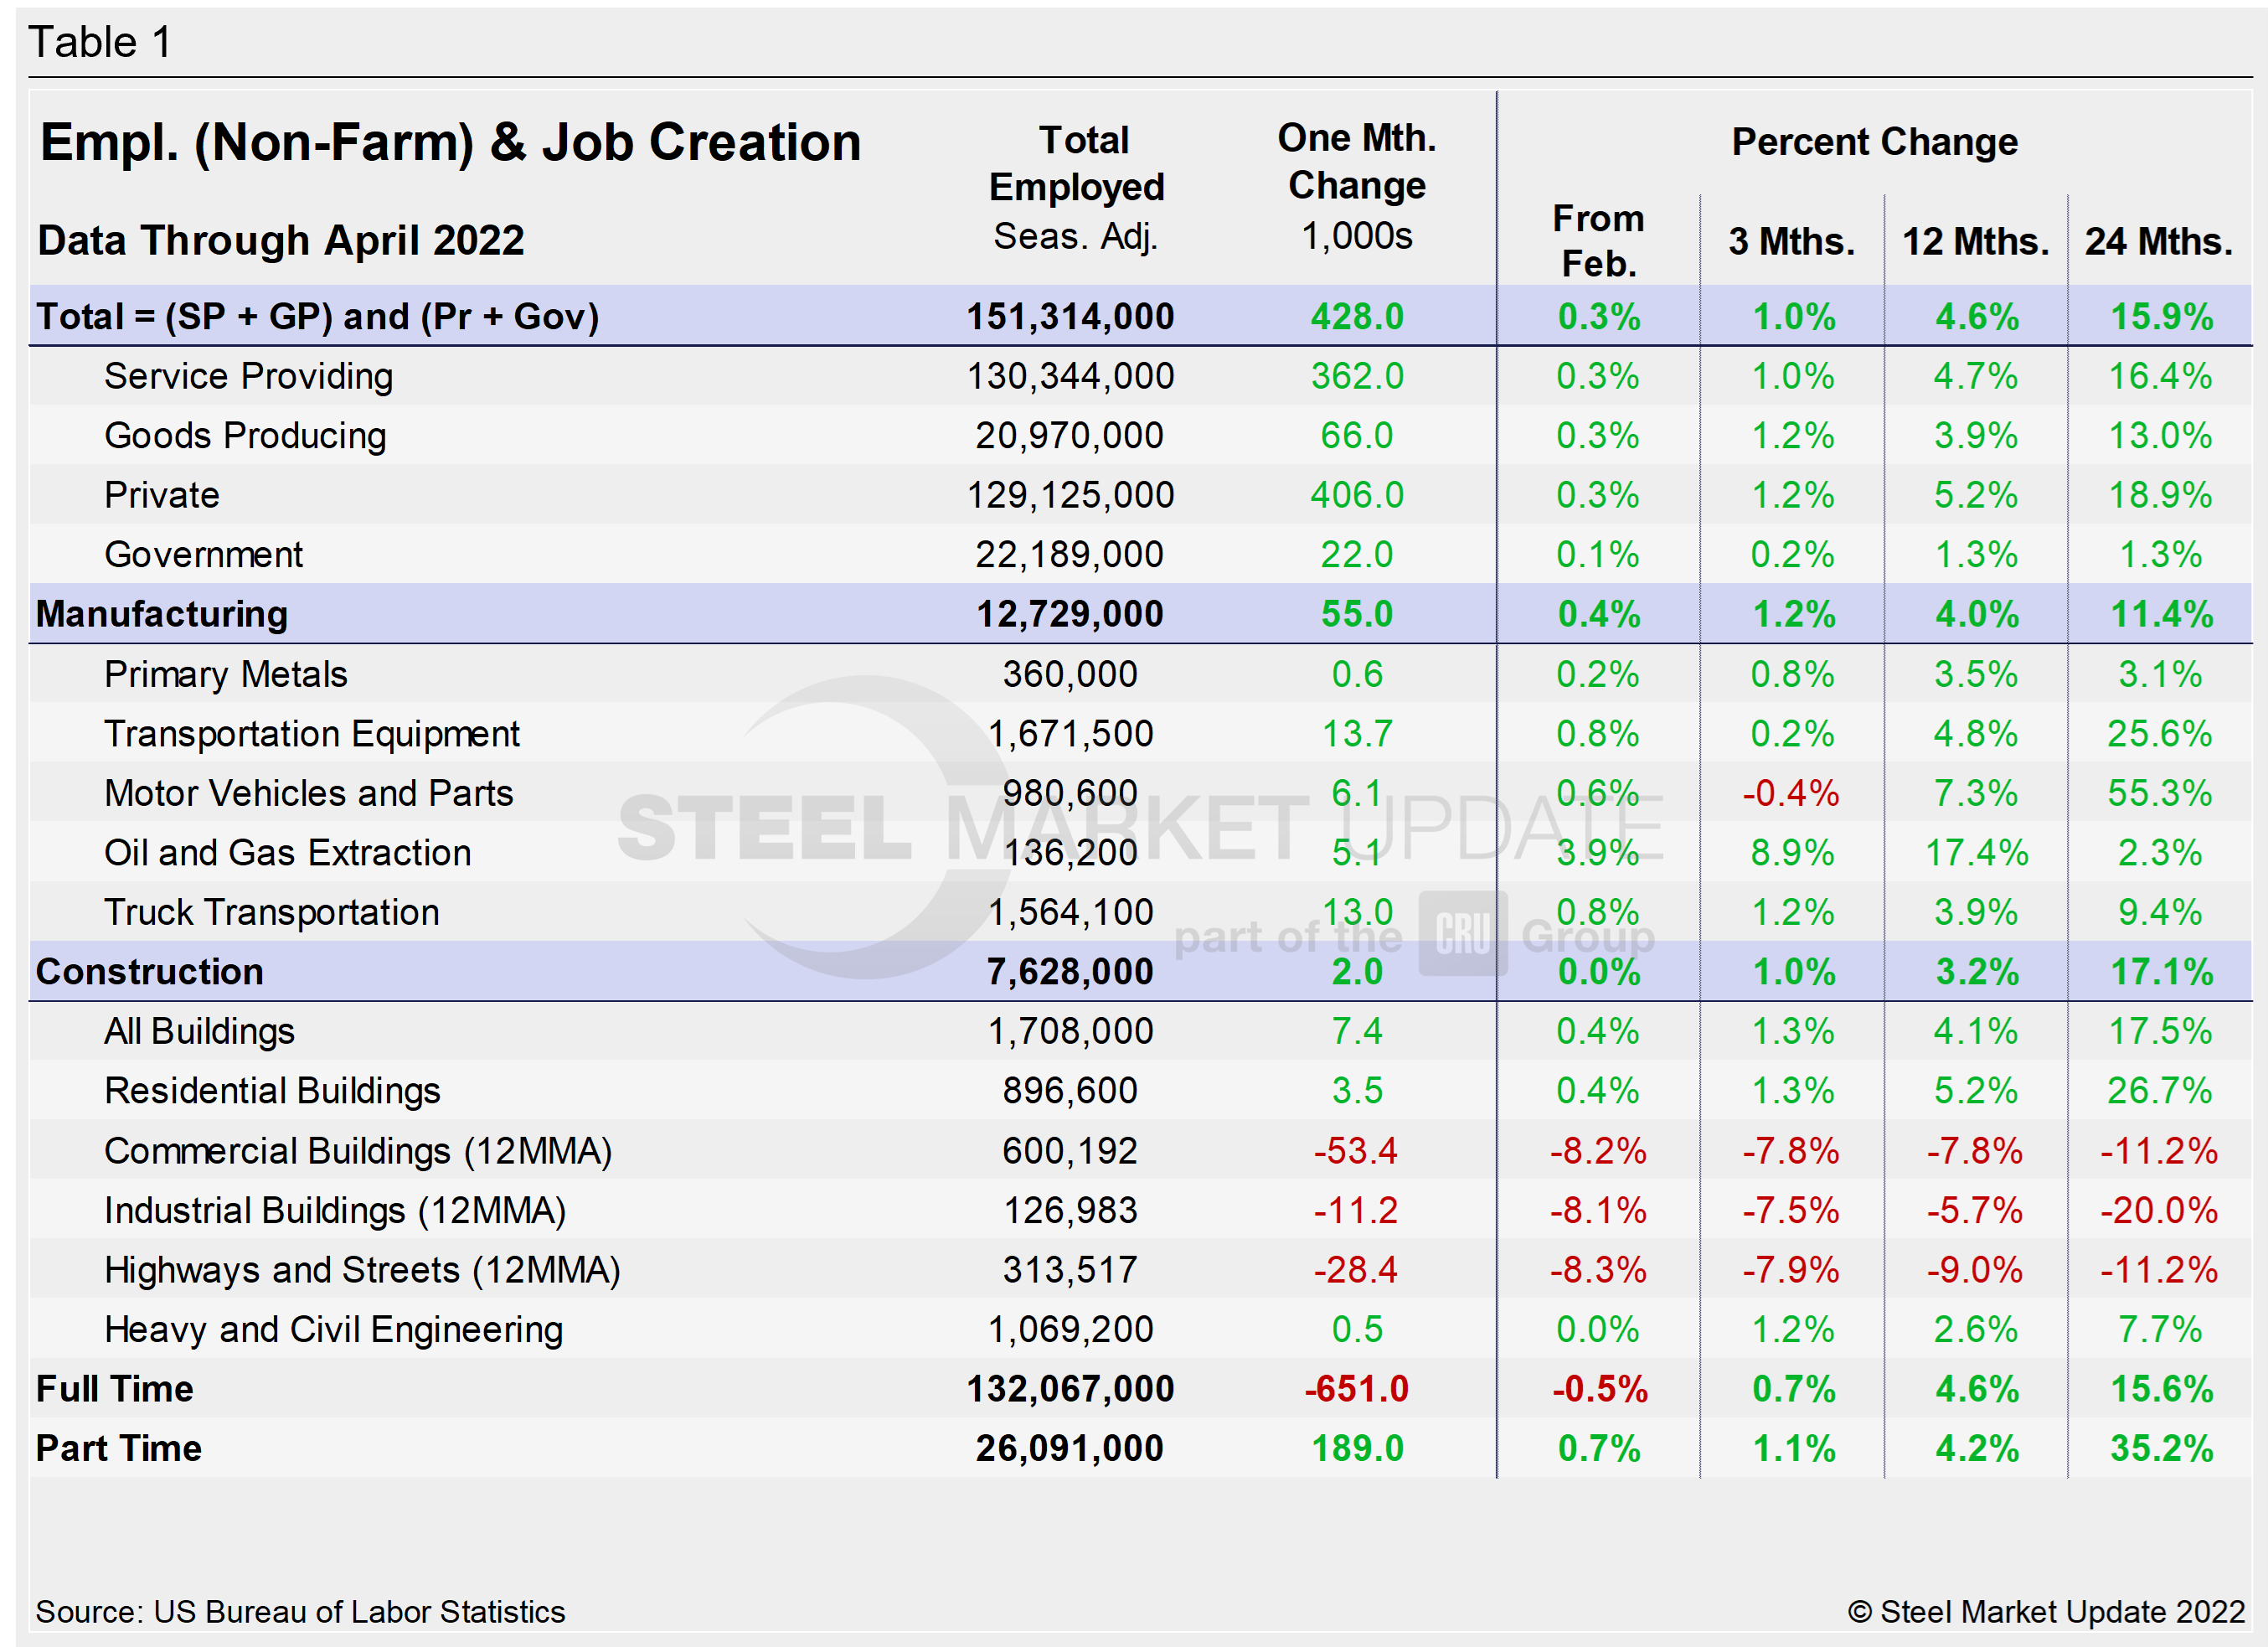
Comparing April to March, manufacturing employment was just 0.1 percentage point higher, slightly better than the 0.3% growth the month prior. Construction was unchanged MoM after growing by just 0.2% in March. The construction sector, which has been driven by the residential market, edged up 0.4% in April after posting a 0.3% decline in March. Gains have been held back by a slowdown commercial and industrial buildings, as well as less activity when it comes to highways and streets. Despite the overall improvement, the inconsistencies in some of the subcomponents reflect the obstacles still facing the US economy and domestic job creation.
The three-month and 12-month comparisons show a decent recovery. But some still lag the 24-month pre-pandemic comparisons. In the year-over-year contrast, manufacturing is up 4% and construction is up 3.2%. Further growth is expected as the marketplace recovers from Q2 2020, when the economy nearly collapsed following the outbreak of the Covid-19 pandemic.
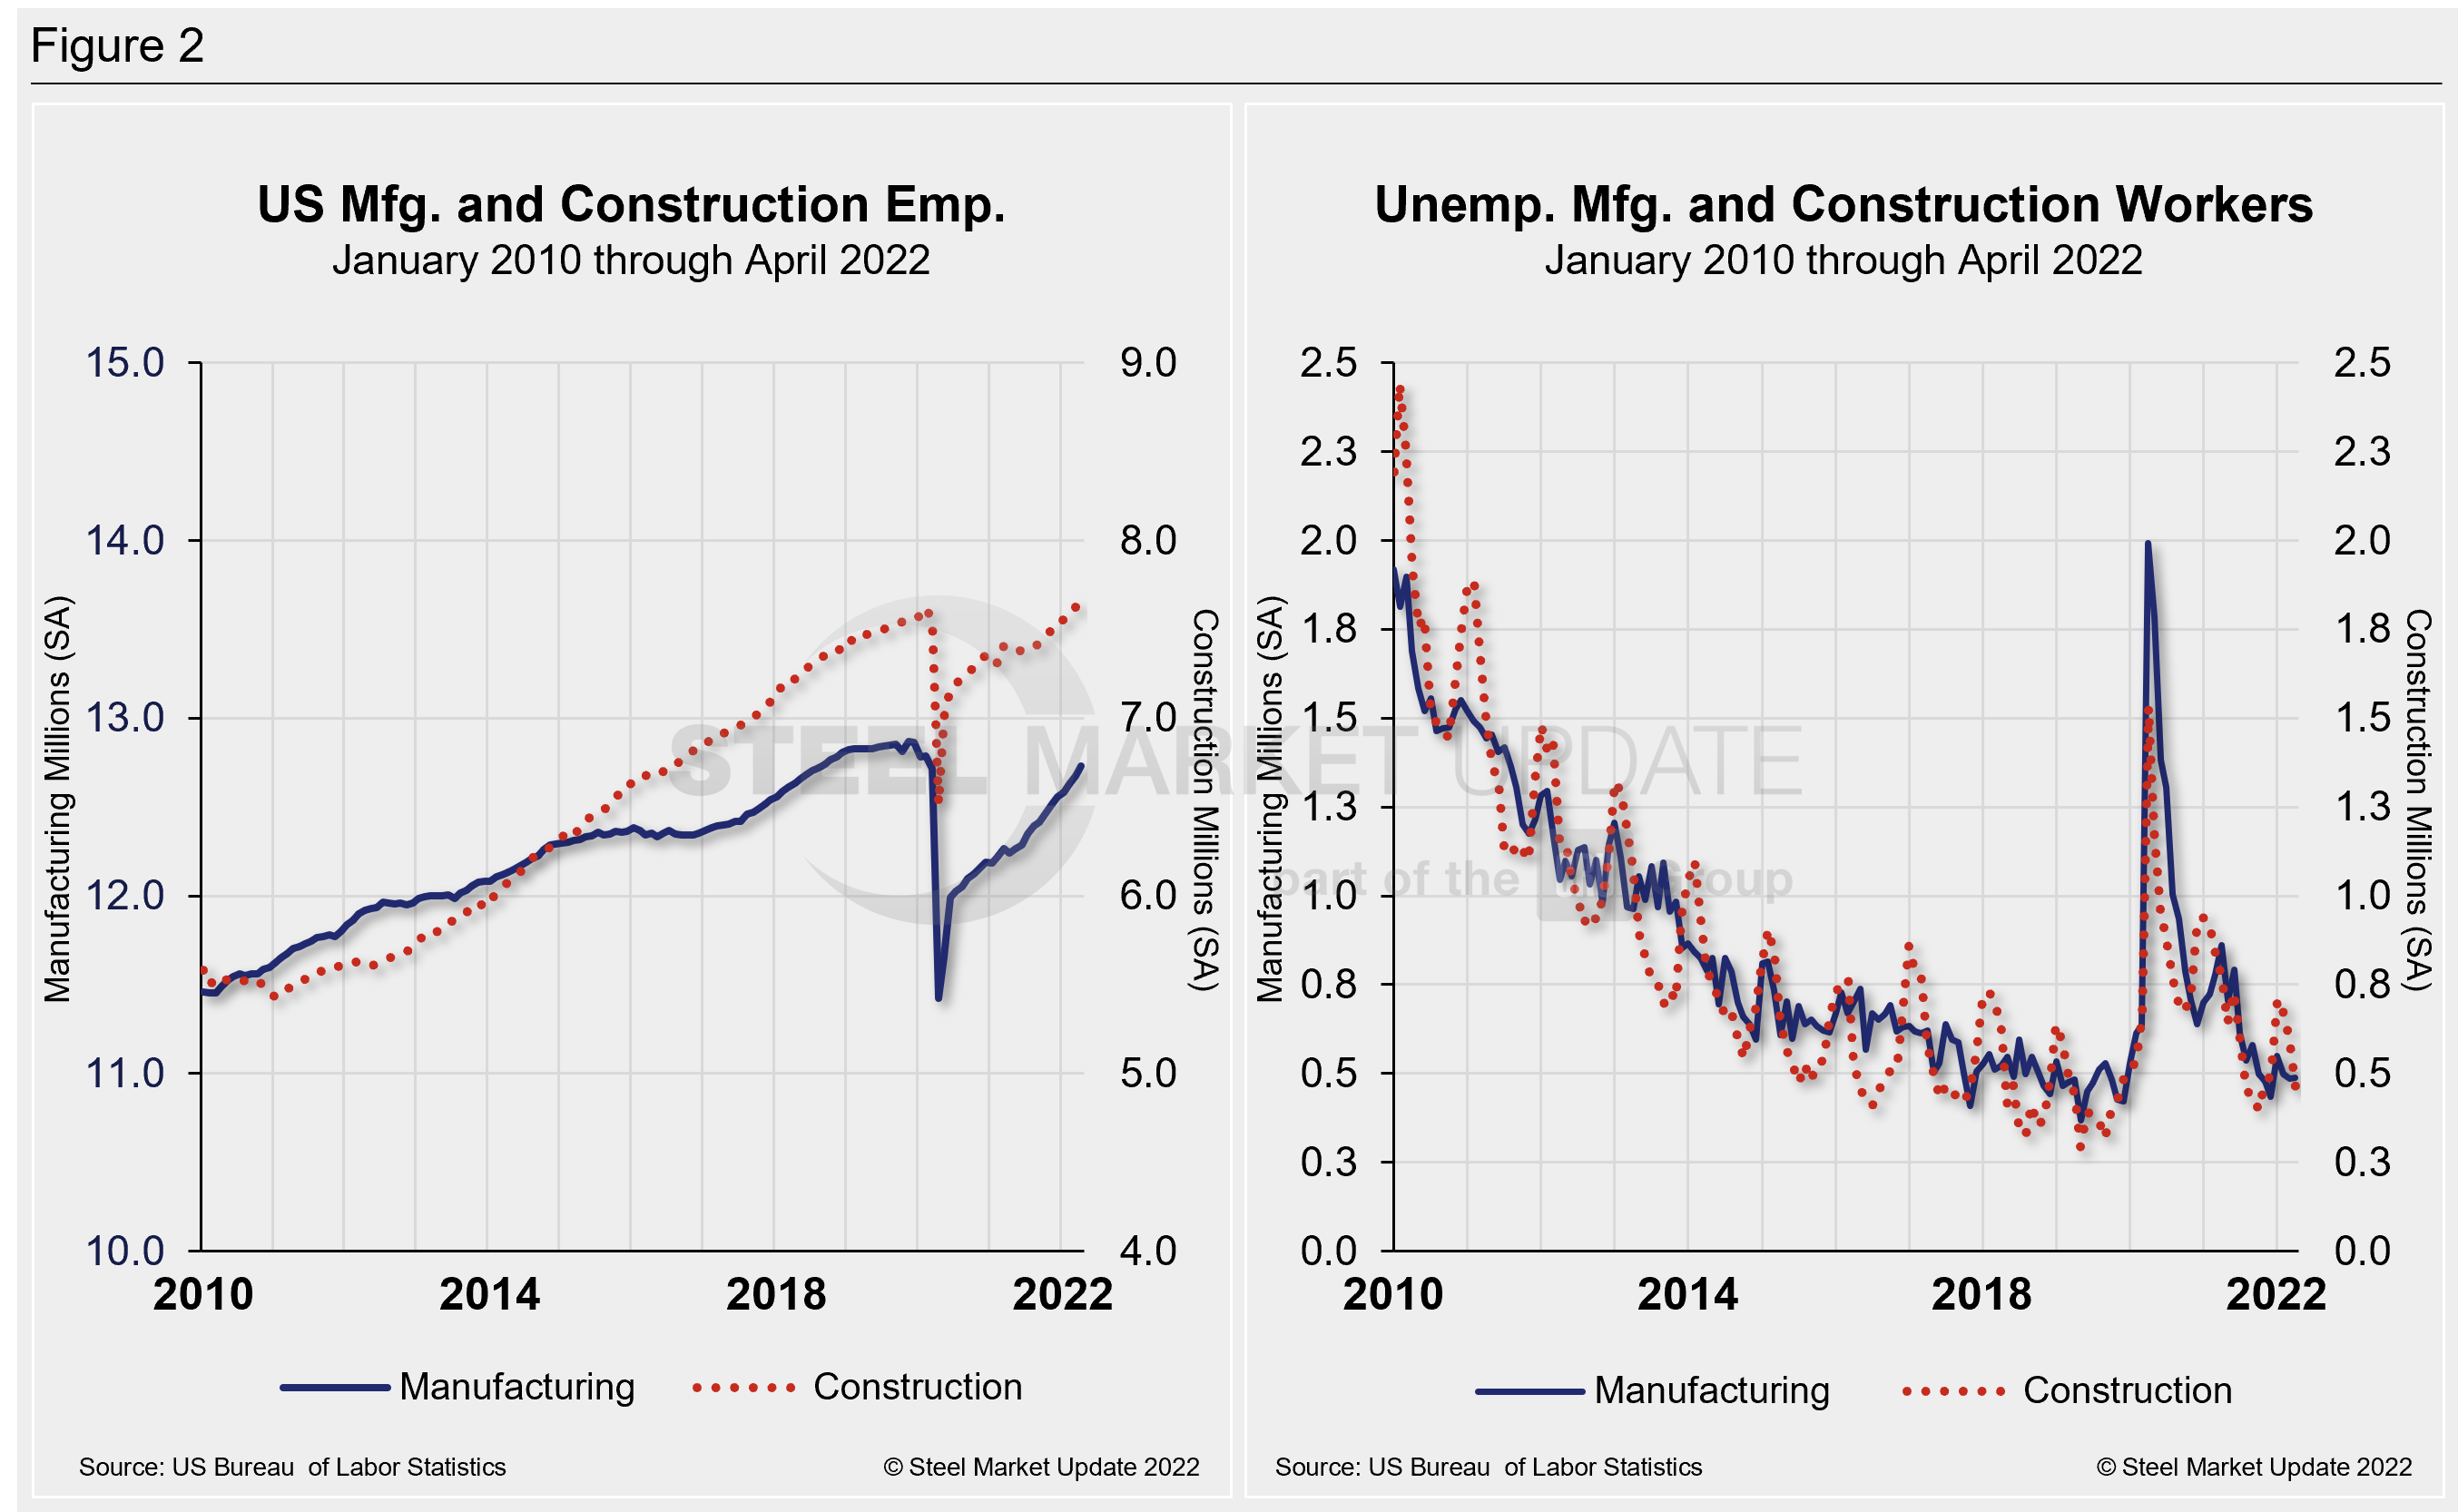
Manufacturing employment added 55,000 jobs in April, a 17,000 boost from March, while construction employment was largely flat, adding just 2,000 new jobs – a noticeable decline from the 79,000 new jobs created the two months prior.
Construction and manufacturing unemployment diverged in April. Construction unemployment fell 22.4% MoM, from 598,000 in March to 464,000 in April. Manufacturing’s unemployed rose from 485,000 in March to 489,000 last month, a 0.8% increase MoM. Both sectors have been heavily impacted by supply-chain disruptions and labor force constraints, on top of seasonality. Construction’s improvement highlights the industry’s strong demand in conjunction with the withdrawal of the vaccine mandate by the White House in late January. The dynamic has boosted employment in these sectors, especially construction. Further growth should be seen in the coming months as a result.
The history of employment and unemployment in manufacturing and construction since January 2010 is shown below side-by-side in Figure 2, seasonally adjusted.
According to human resources consulting firm Challenger, Gray and Christmas Inc., most job cuts (3,675) in April were seen in the entertainment and leisure industries, for a total of 6,667 year-to-date. That is a 40% decrease from the 11,149 cuts in this sector announced through April 2021.
Another 3,453 cuts were announced in the services sector, followed by financial companies with 2,722. Retailers announced 2,213 jobs in April totaling 18,099 since June 2021. Of those, 14,422 were recorded in 2022.
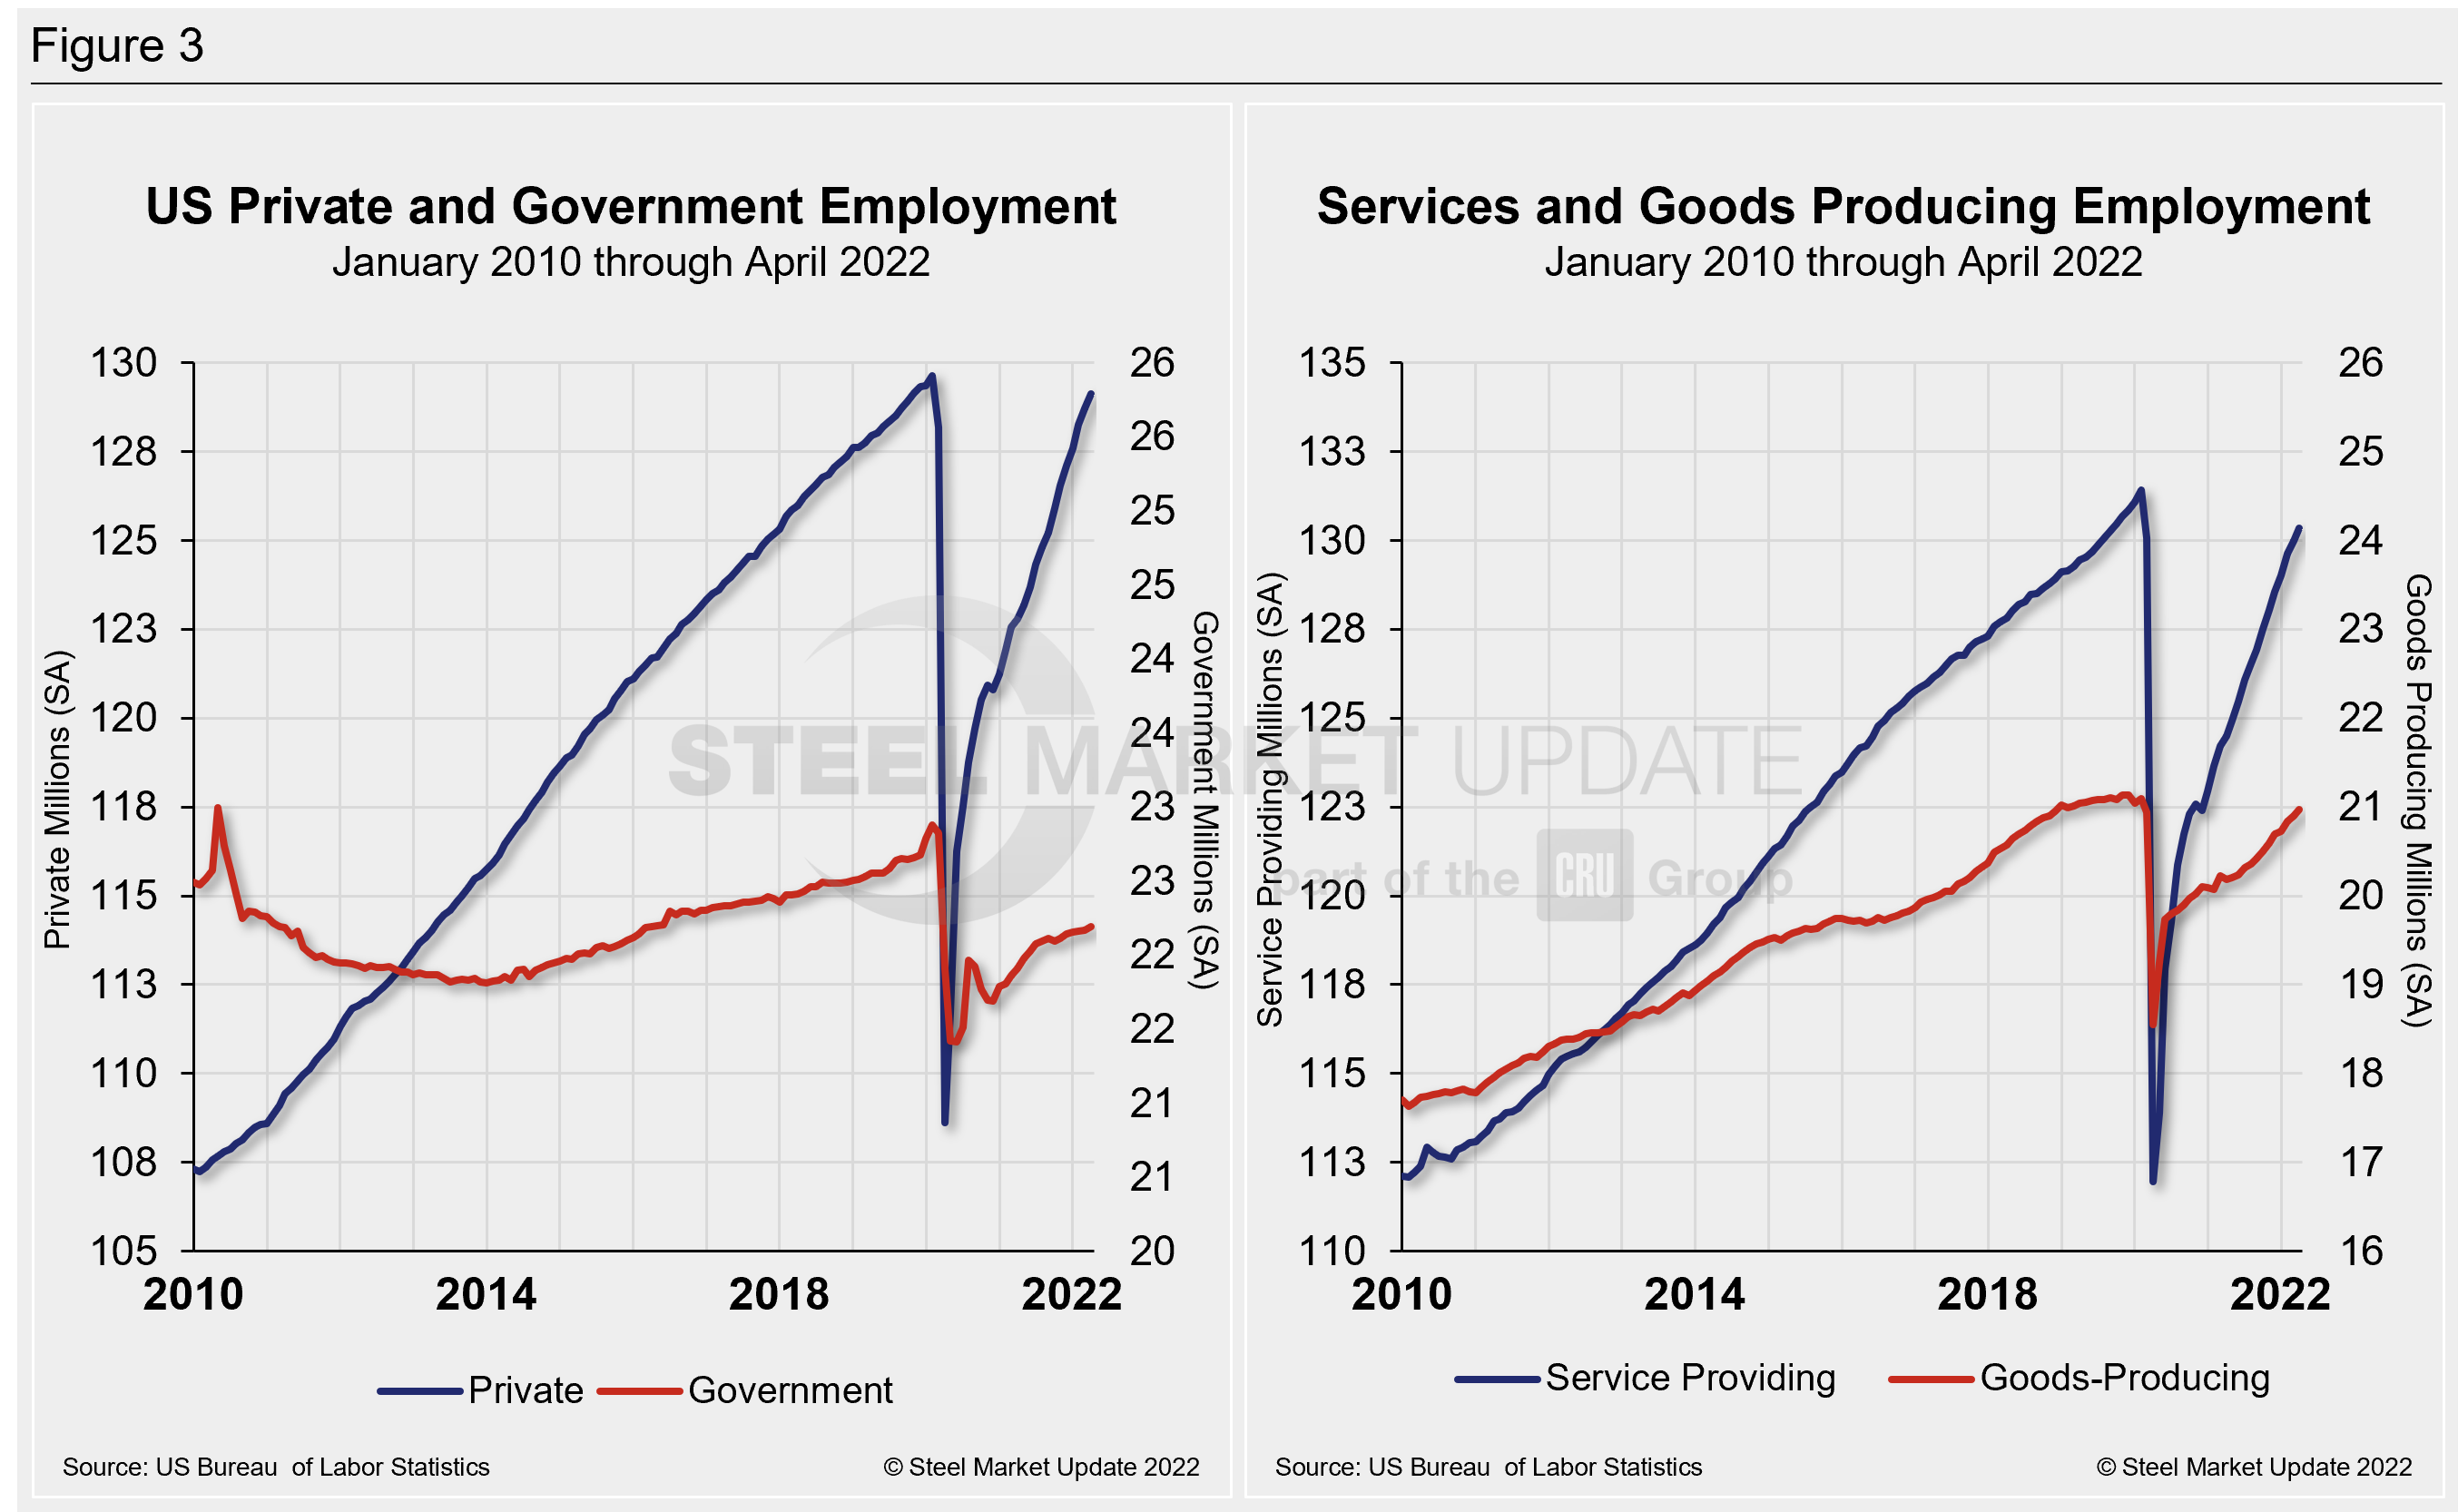
Figure 3 details employment comparisons between private and government jobs, as well as services and goods-producing jobs.
Explanation: On the first or second Friday of each month, the Bureau of Labor Statistics releases the employment data for the previous month. Data is available at www.bls.gov. The BLS employment database is a reality check for other economic data streams such as manufacturing and construction. It is easy to drill down into the BLS database to obtain employment data for many subsectors of the economy. The important point about all these data streams is not necessarily the nominal numbers, but the direction in which they are headed.
By David Schollaert, David@SteelMarketUpdate.com


