

Market Data

May 6, 2022
US Job Creation Exceeds Expectations in April
Written by David Schollaert
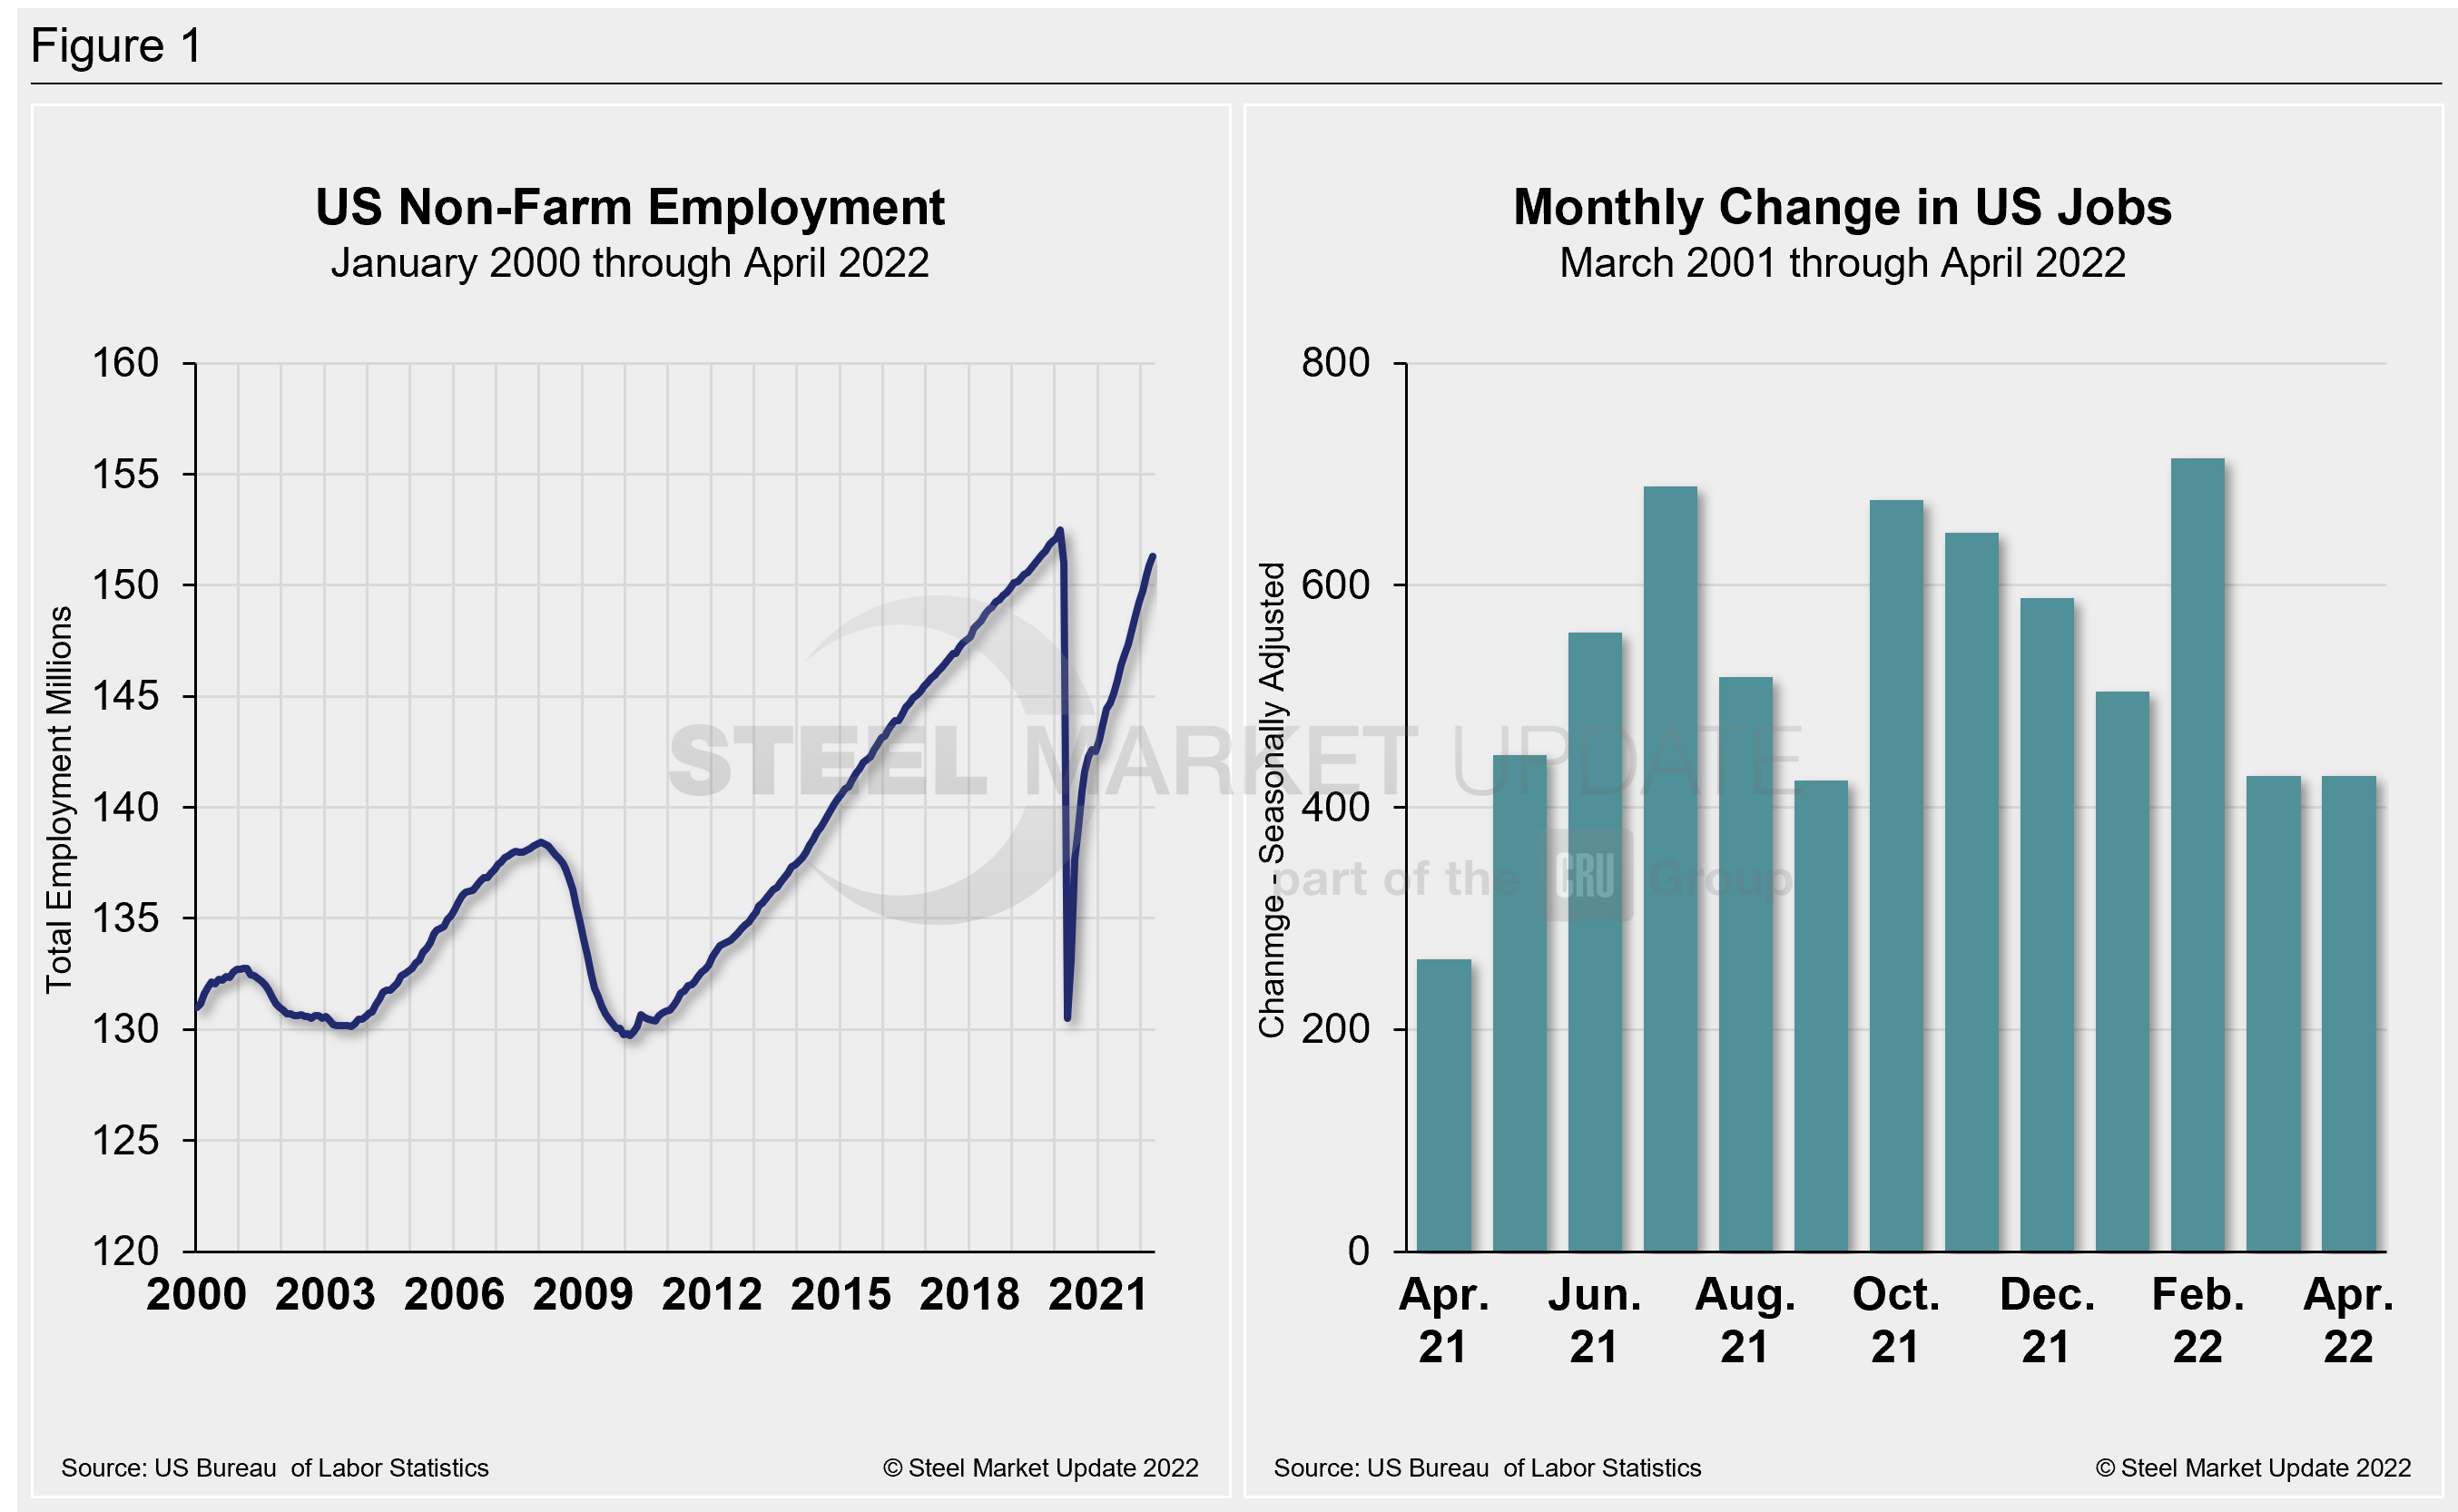
US job growth was strong in April, exceeding early estimates by approximately 7%. Employers added 428,000 in April, matching the downgraded figure for March. The result kept the unemployment rate unchanged at 3.6% – slightly higher than estimates of 3.5%, and just a touch above pre-pandemic levels in 2020, according to the Labor Department.
The US economy has had twelve straight months of job gains exceeding 400,000 – a first for the economy since the government started maintaining national job records in 1939.
Economic headwinds persist. Job totals from February and March were both revised down. That said, the economy has year-to-date created more than 2 million jobs, nearly identical to the total jobs created in all of 2019.
All told, the US economy has regained nearly 95% of the 22 million jobs lost following the pandemic outbreak in the spring of 2020. Labor force participation has also recovered.
Employment in the leisure and hospitality industry increased by 78,000 in April, slowing just slightly from March’s 100,000. Education and health services employers brought back slightly more jobs in April compared to March at 59,000. Transportation and warehousing payroll gains increased more significantly in April versus March, rising by 52,000 compared to 9,500 during the prior month.
In the goods-producing sector, payroll growth was little changed month-on-month (MoM), with jobs growing by 66,000 in April. This was led by hiring in manufacturing, where payrolls grew by 55,000.
The labor force participation rate slipped to 62.2% in April, down slightly from 62.4% in March. Side-by-side in Figure 1 below is a snapshot of the pace of hiring since April 2021 and the total number of nonfarm workers employed in the US since 2000.
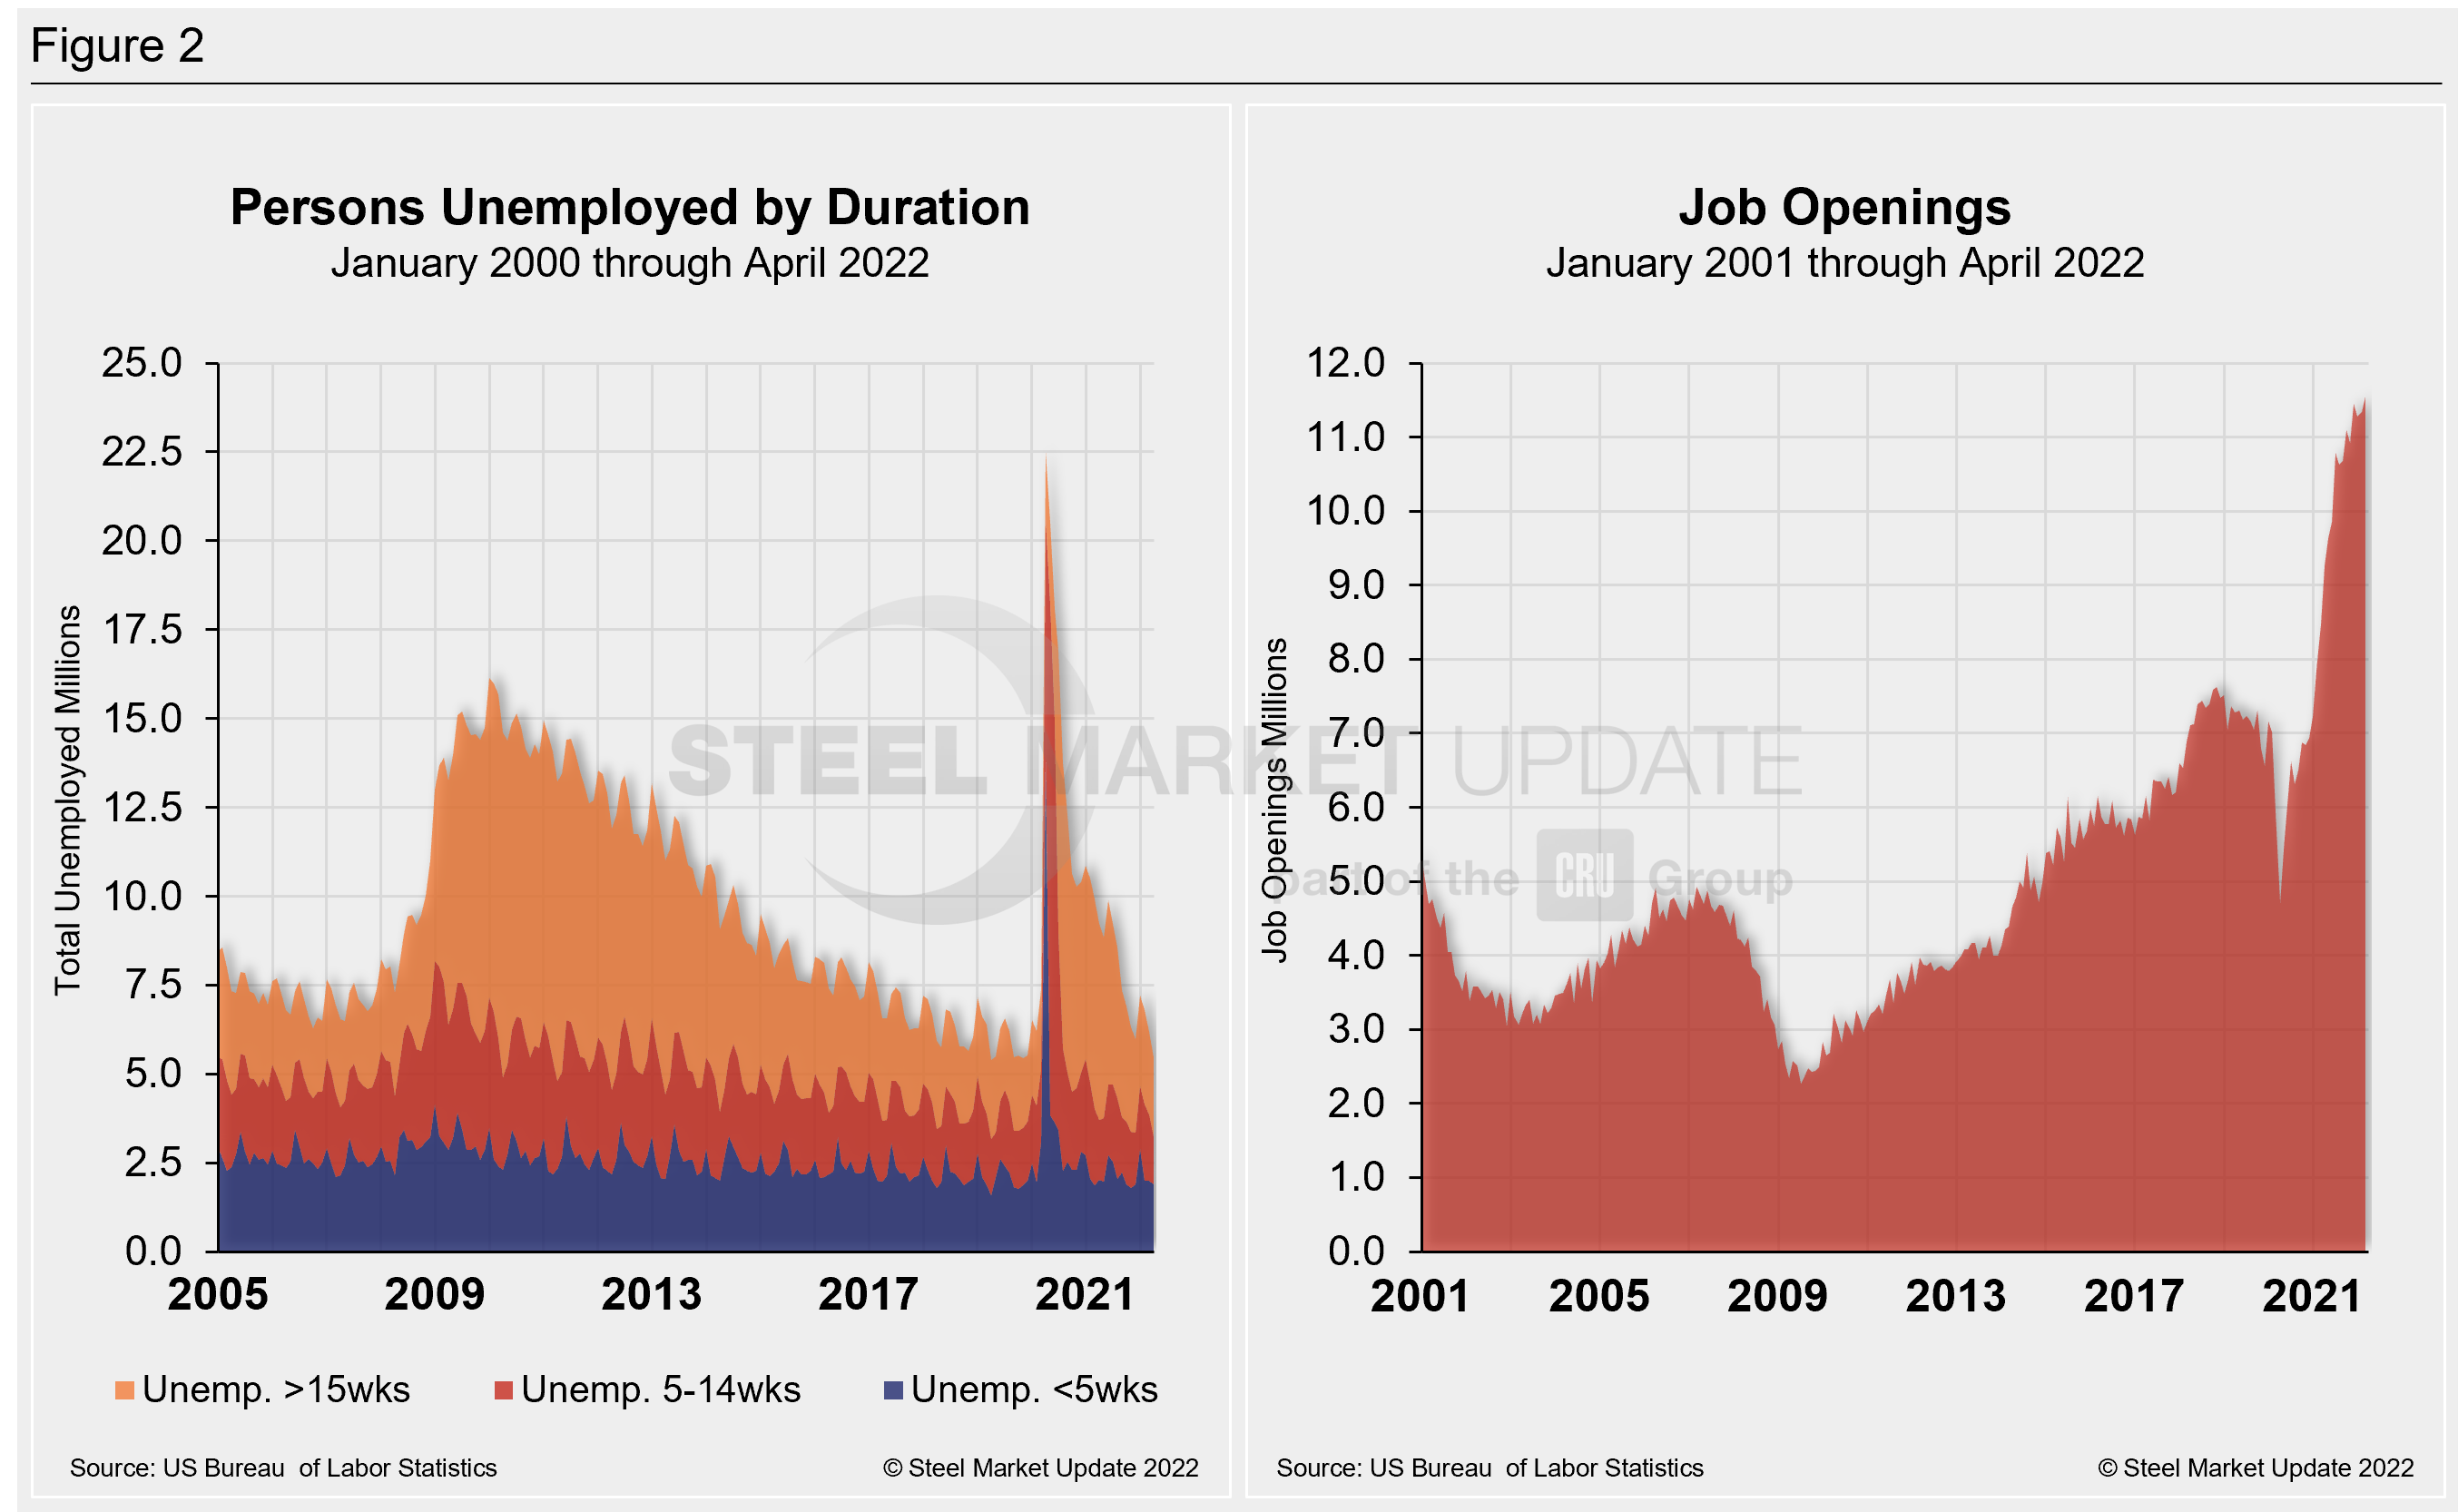
The number of long-term unemployed (out of work for at least 27 consecutive weeks) was little changed at 1.5 million in April versus March. That figure accounted for 25.2% of the total unemployed in the month. This measure is down from a recent high of 4.0 million last year but is 362,000 higher than in February 2020.
The historic picture for the duration of unemployment since January 2000 is broken down into <5 weeks, 5 to 14 weeks, and >15 weeks in Figure 2. The total number of unemployed was 5.458 million at the end of April, a decrease of 728,000 compared to March. The result kept the unemployment total below pre-pandemic levels for the second straight month.
April’s results show that roughly 16.5 million more people now have jobs compared to the 22.5 million thrown out of work during the worst of the pandemic in April 2020. As of May 6, 40.7% had been unemployed for more than 15 weeks, 24.6% for 5 to 14 weeks, and 34.7% for less than 5 weeks.
As part of April’s employment report, the Labor Department released its monthly report on job openings, layoffs, and quitting through the last day of March. Also known as the “JOLTS” report, the data serve as an indicator of how much demand there is for workers in the US economy and the extent to which employers are still struggling with labor shortages nearly two years removed from the worst of the pandemic.
March’s job openings set a record, suggesting that workers remain in high demand and are still quitting more often. There were about 11.5 million job openings in March and nearly 300,000 more job openings than in February. The number of hires overall slipped to about 6.74 million.
The charts below (Figure 2) detail the total persons unemployed by duration from 2005 through March 2022 and the total job openings over the same period.
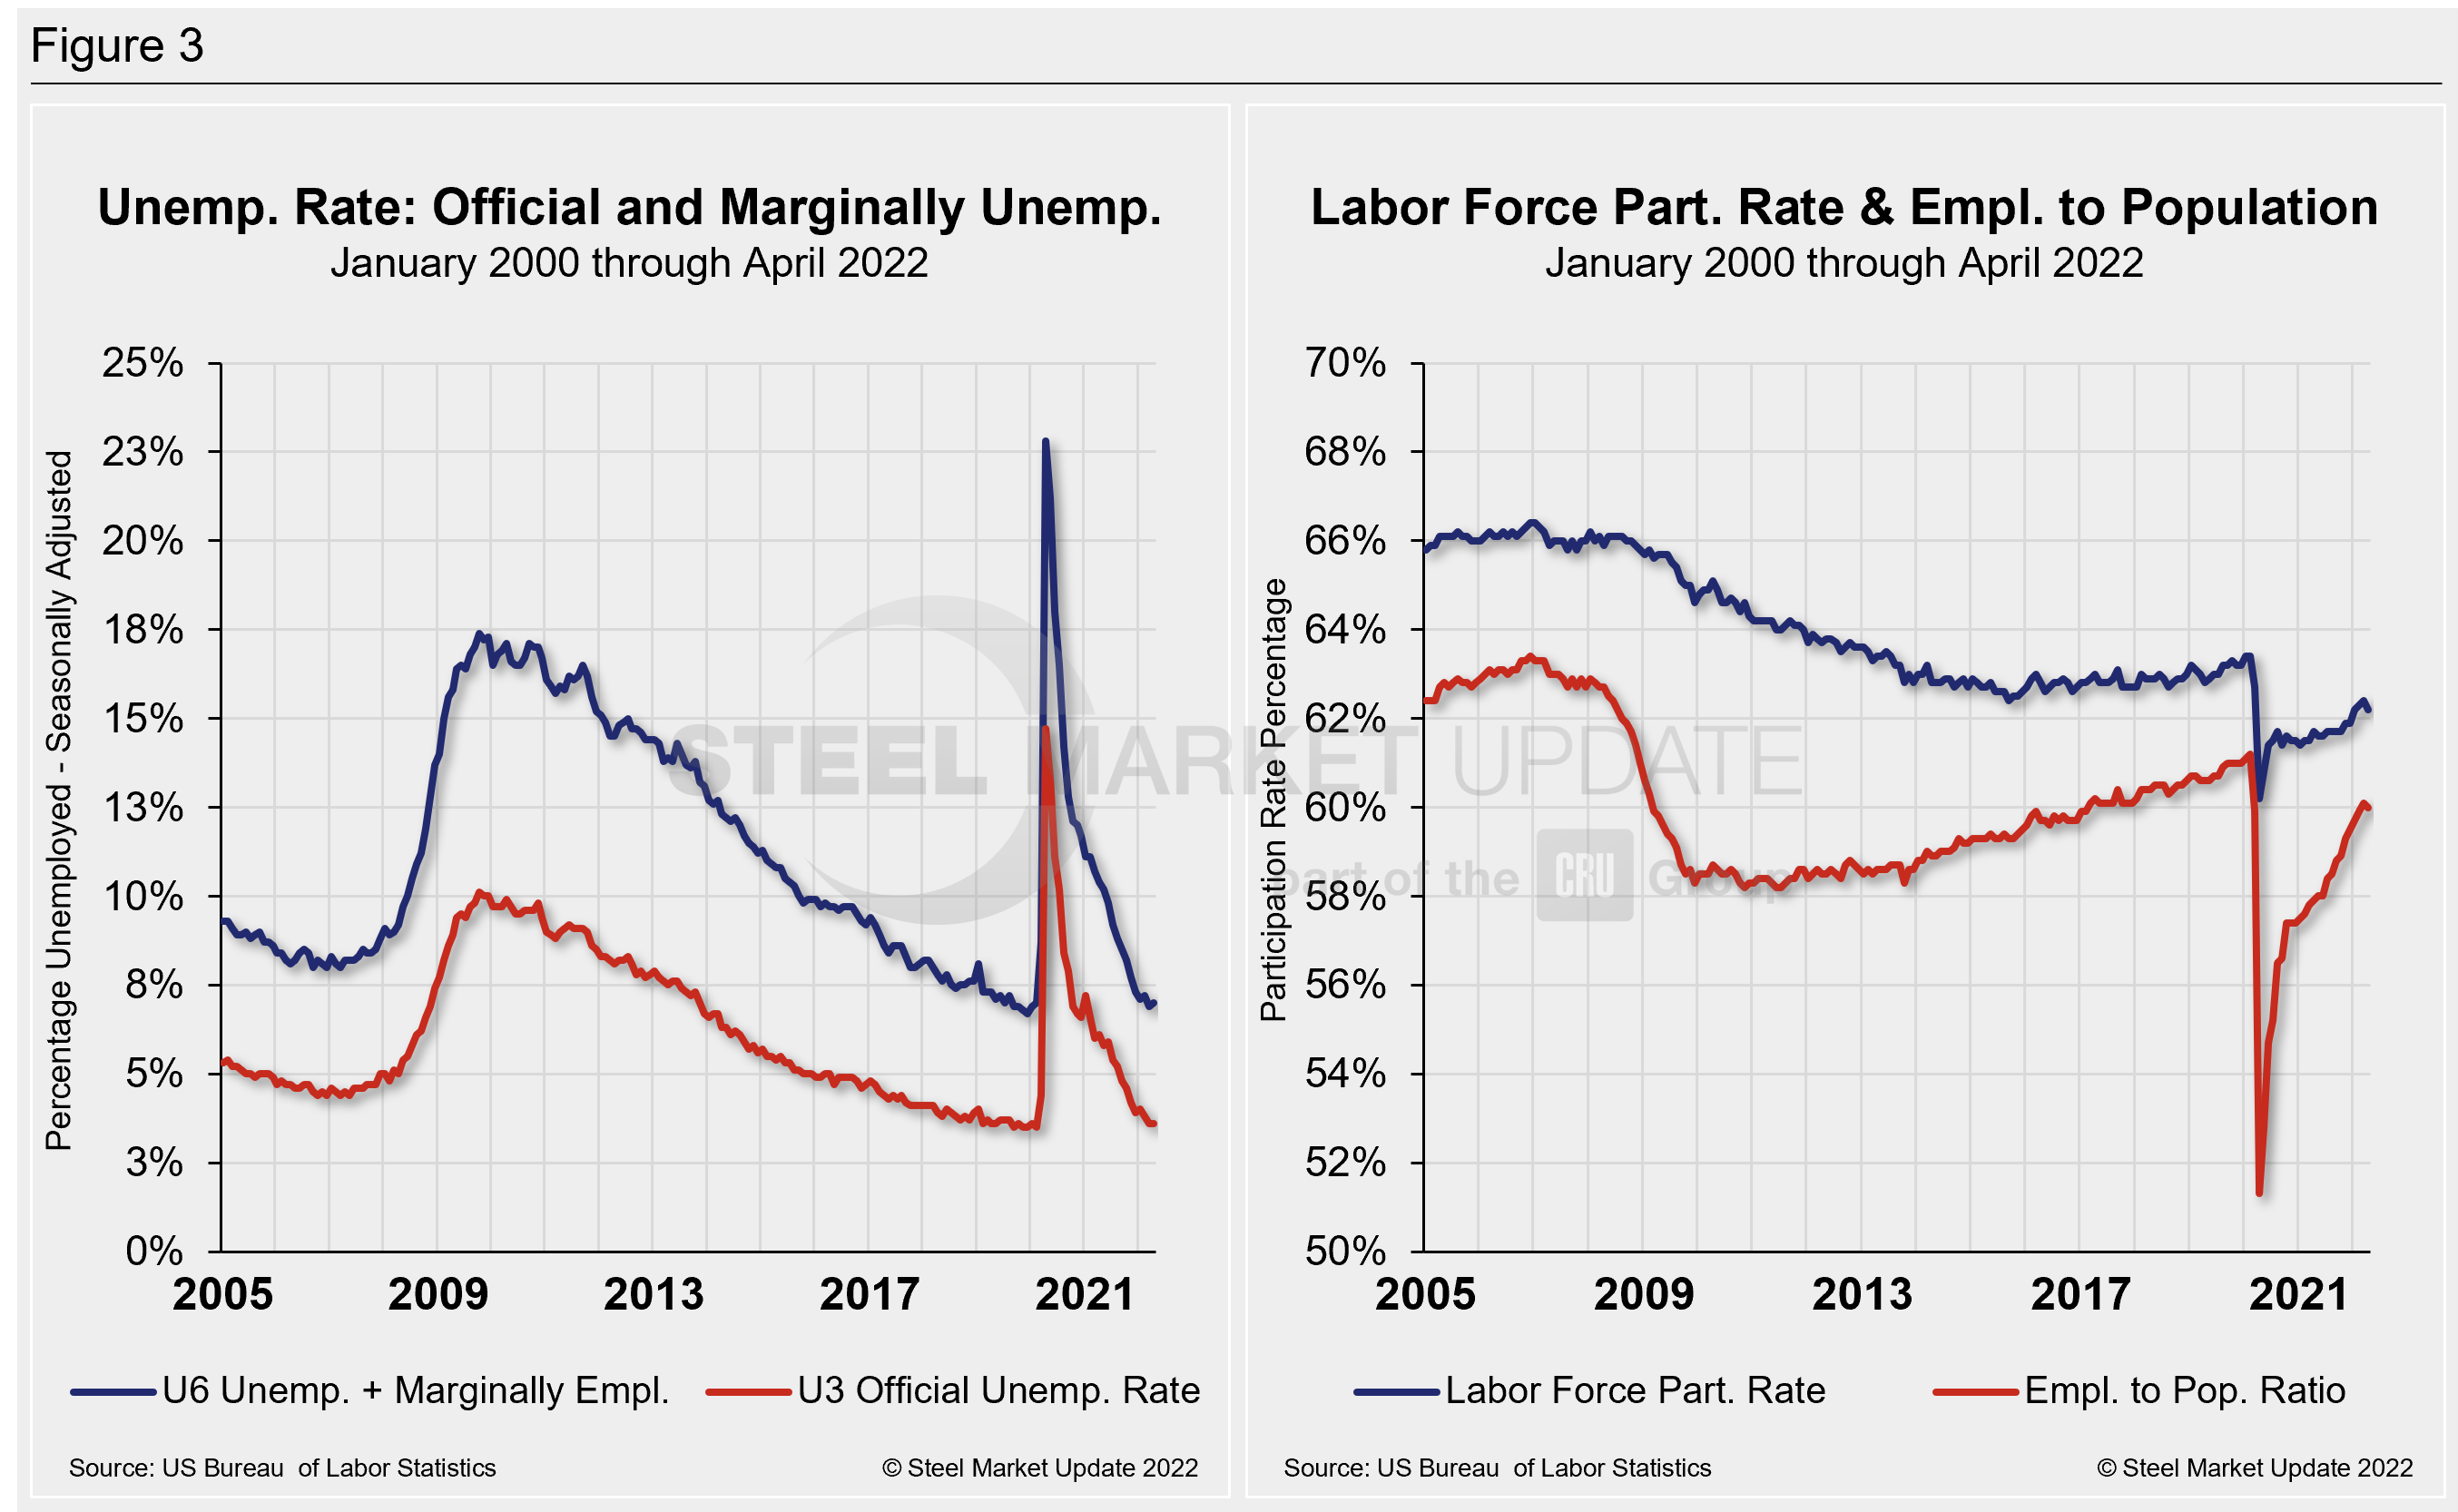
The official unemployment rate, U3, reported in the Bureau of Labor Statistics Household survey (see explanation below), increased from 3.5% in February 2020 to 14.7% in April 2020. Since April 2020, it has trended down at a slow pace, bottoming out at 3.9% in December, before edging up to 4.0% in January. Since February, the U3 rate has dipped, reaching 3.6 in April, the lowest mark in two years. U6, a more encompassing measure of unemployment that includes discouraged workers and those holding part-time jobs for economic reasons, grew to 7.0% from 6.9% in March.
Another gauge, and a more definitive view, are the number employed as a percentage of the population. Last month, the employment-to-population ratio was 60.0%, a marginal decrease from March and the first decline in five months.
Figure 3 details side-by-side parallels of the unemployment rate (both the U3 and U6 rates) since 2005 as well as the labor force participation rate and employment to population ratio over the same period.
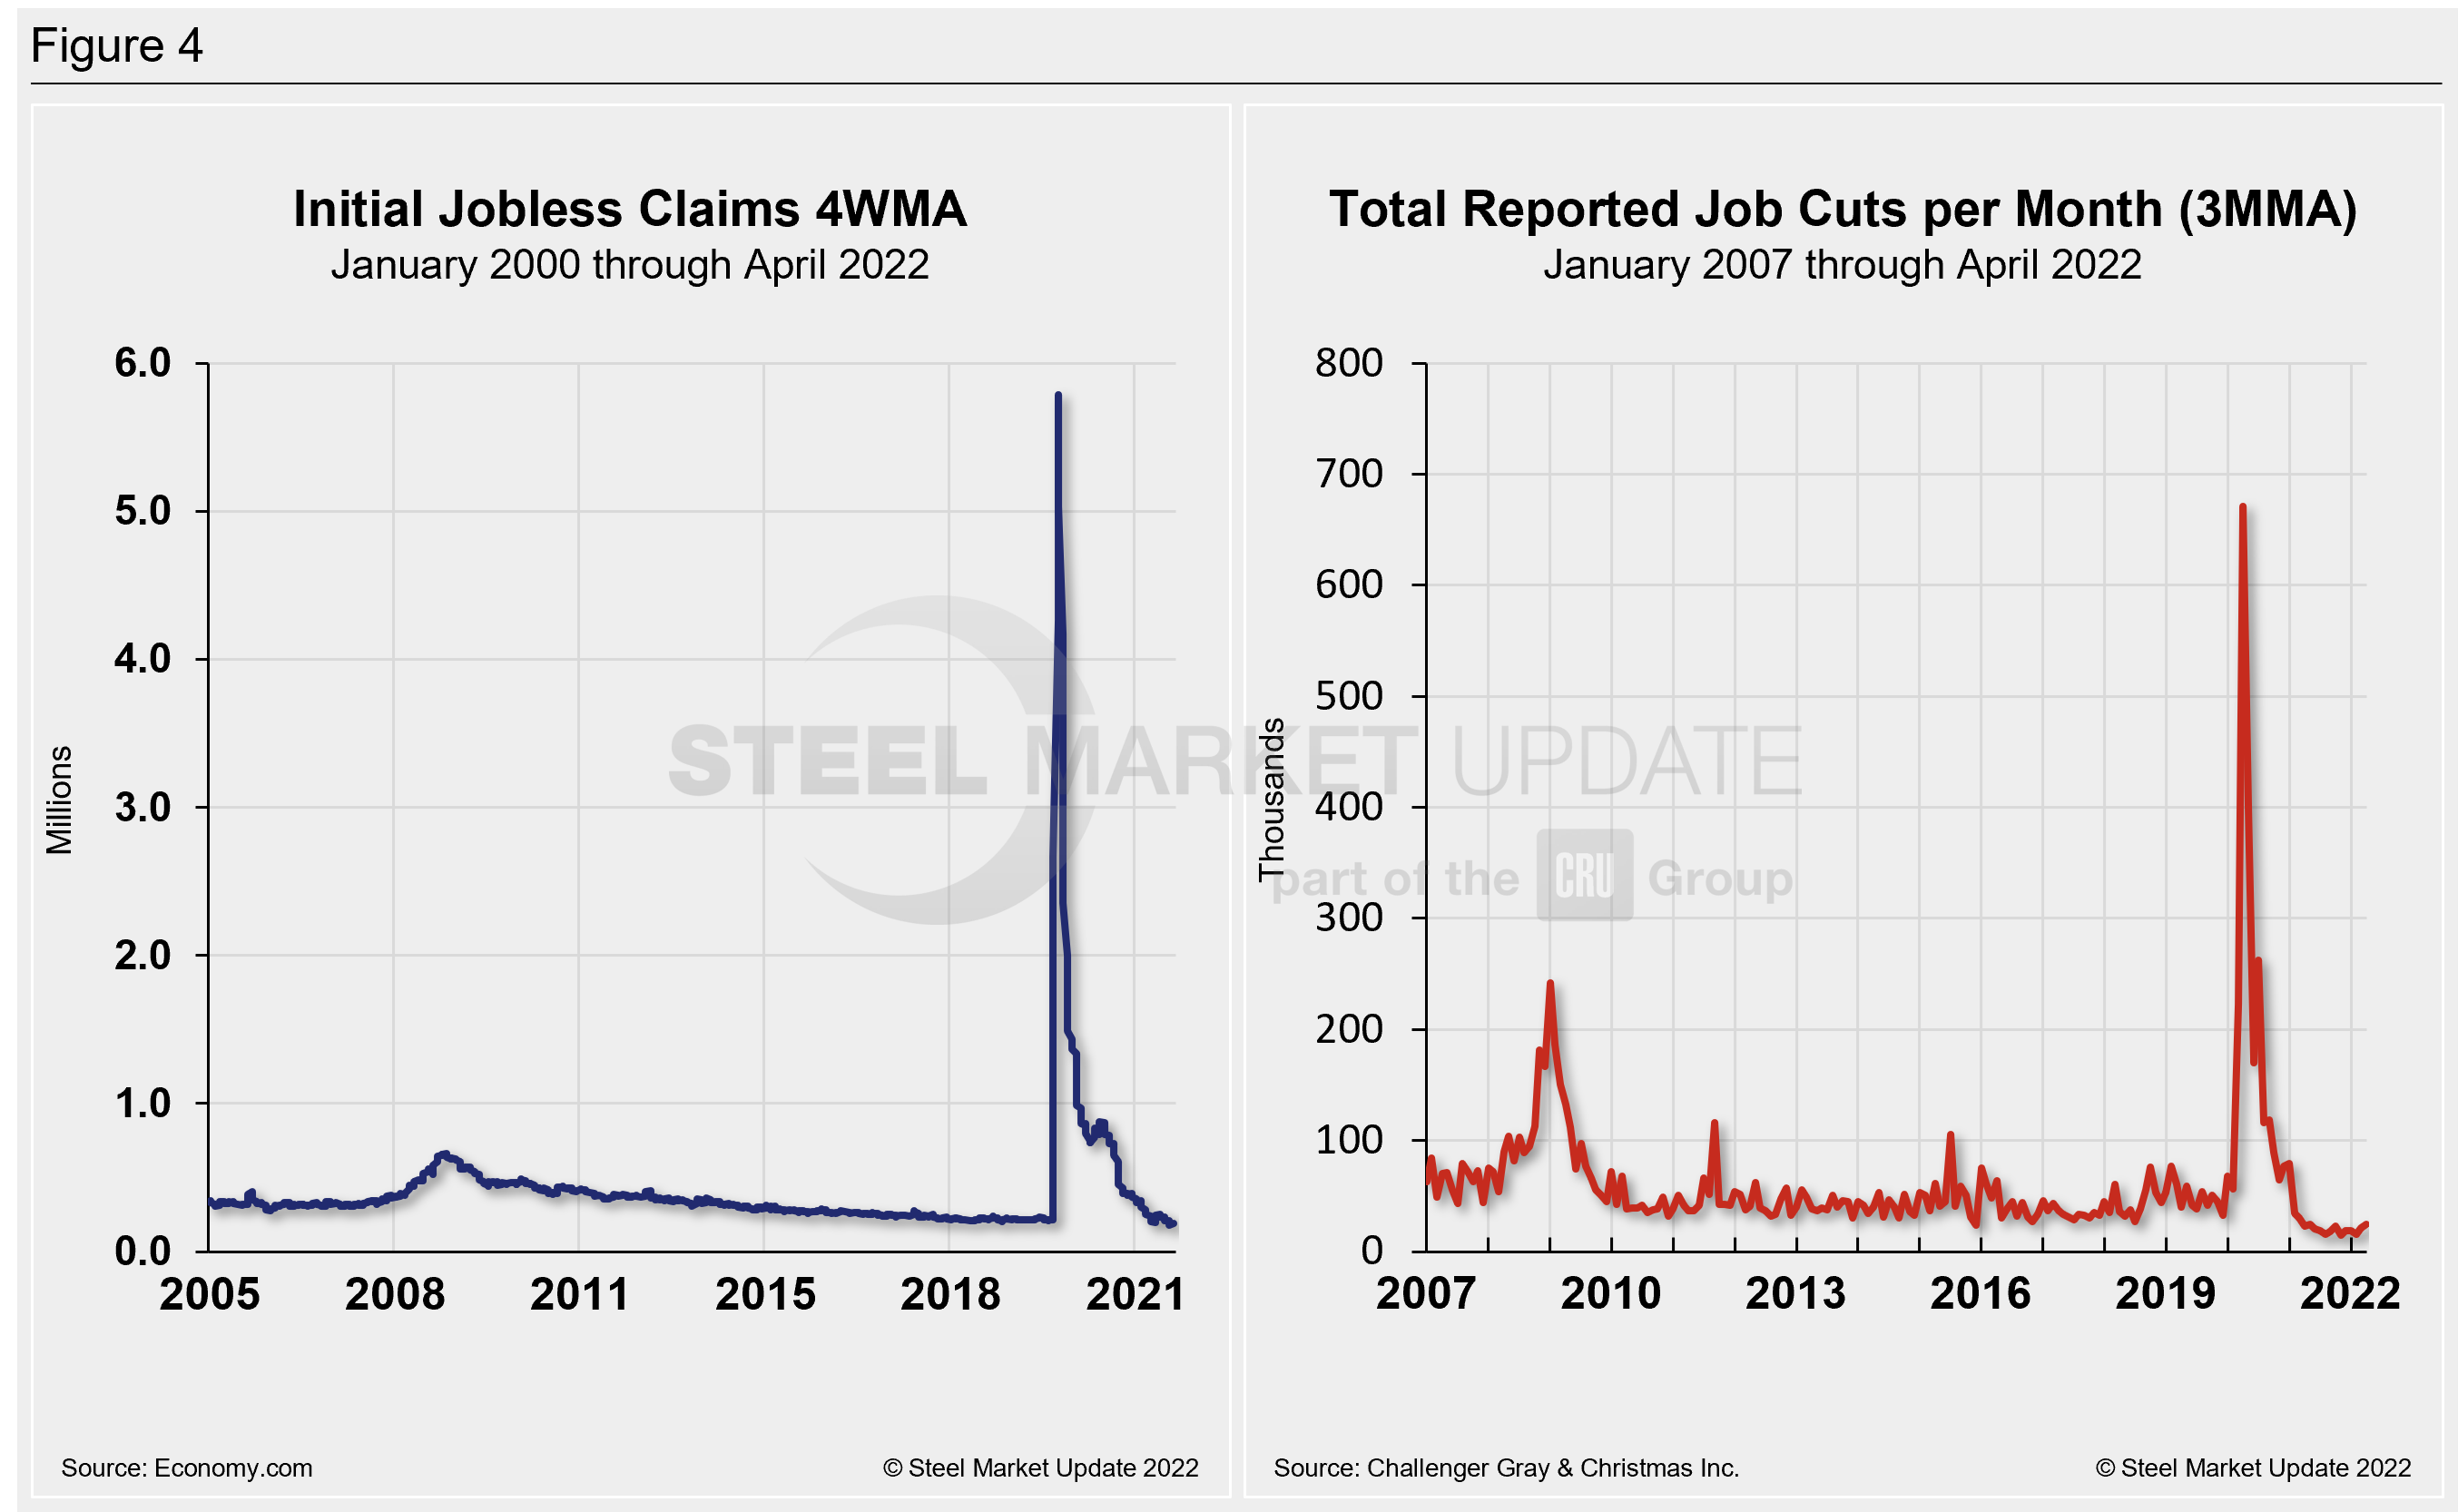
Initial claims for unemployment insurance, which are reported weekly by the Department of Labor, rose by 19,000 to 200,000 in the week ended April 30, following a 4,000 decrease the week prior.
US initial claims for unemployment insurance are low even though they rose by 19,000 to 200,000 in the week ended April 30, Economy.com reported. “Continuing claims for unemployment insurance benefits fell from 1.403 million to 1.384 million in the week ended April 23. The four-week moving average in continuing claims dropped from 1.453 million to 1.417 million. The insured unemployment rate remained very low at 1%.”
Human resources consulting firm Challenger, Gray and Christmas Inc. produces a monthly employment update for the US. It reported that job cuts in April totaled 24,286, up 14% from 21,387 announced the prior month.
April’s total is 6% higher than the same year-ago period when 22,913 cuts were announced. It is the first time this year job cuts were higher than the corresponding year-ago period.
Year to date, employers announced 79,982 cuts, down 52% from the 167,599 cuts announced through the same period in 2021. It is the lowest January to April total since Challenger began tracking job cuts in 1993.
“Job cut plans appear to be on the rise, particularly as companies assess market conditions, inflationary risks, and capital spending,” said Challenger. “Despite this, job openings are still at record highs. Workers who are being cut will have lots of opportunities and will likely land quickly.”
“Indeed, the latest Job Openings and Labor Turnover Survey for March reported a series-high number of job openings at 11.5 million and 4.5 million quits, another record,” Challenger added.
US employers announced 88,662 hiring plans in April, down 16% from the 105,224 hiring plans in March and up 16% from the 76,345 announced in the same month last year. Hiring plans are up 24% from the 392,578 announced in the first four months of 2021 with 486,603.
Figure 4 shows the four-week moving average of new claims since January 2005, seasonally adjusted. It also shows the total, reported job cuts per month, according to Challenger, on a three-month moving average.
Explanation: On the first Friday of each month, the Bureau of Labor Statistics releases the employment data for the previous month. Data is available at www.bls.gov. The BLS reports on the results of two surveys. The Establishment survey reports the actual number employed by industry. The Household survey reports on the unemployment rate, participation rate, earnings, average workweek, the breakout into full-time and part-time workers and lots more details describing the age breakdown of the unemployed, reasons for and duration of unemployment.
By David Schollaert, David@SteelMarketUpdate.com


