

Analysis

May 16, 2022
April North American Auto Assemblies
Written by David Schollaert
North American auto assemblies shrank by 15.8% in April, falling for the first time in 2022 as ongoing supply hurdles mount. Despite the recent decline, North American production has improved since bottoming out last December. April’s results are just 4.6% higher year-on-year (YoY), and still 14.4% below the pre-pandemic period of April 2019.
North American automotive manufacturers have endured major supply chain disruptions for two years now. The lack of semiconductor chips and other components has wreaked havoc on the sector, leading to production halts, delays, and inventory shortages.
And relief from the microchip shortage will not come anytime soon. At the start of the pandemic, lead times for microchip-manufacturing production were running around 2-3 months, recent reports CRU Group indicated that the wait time has been extended to 24-plus months in some cases.
“Multiple sources report that the companies manufacturing chip-producing equipment are themselves struggling to source chips. Such companies will no doubt be given preferential treatment within the chip supply chain, but such prioritizations in the short-term may further constrain the number of chips allocated to autos,” the report stated.
With delays in equipment delivery, semiconductor chipmakers’ planned ramp-ups will be challenged and prolonged. Intel recently revised its forecast on the chip shortage to extend into 2024, extending by 12 months beyond the initial forecast of 2023.
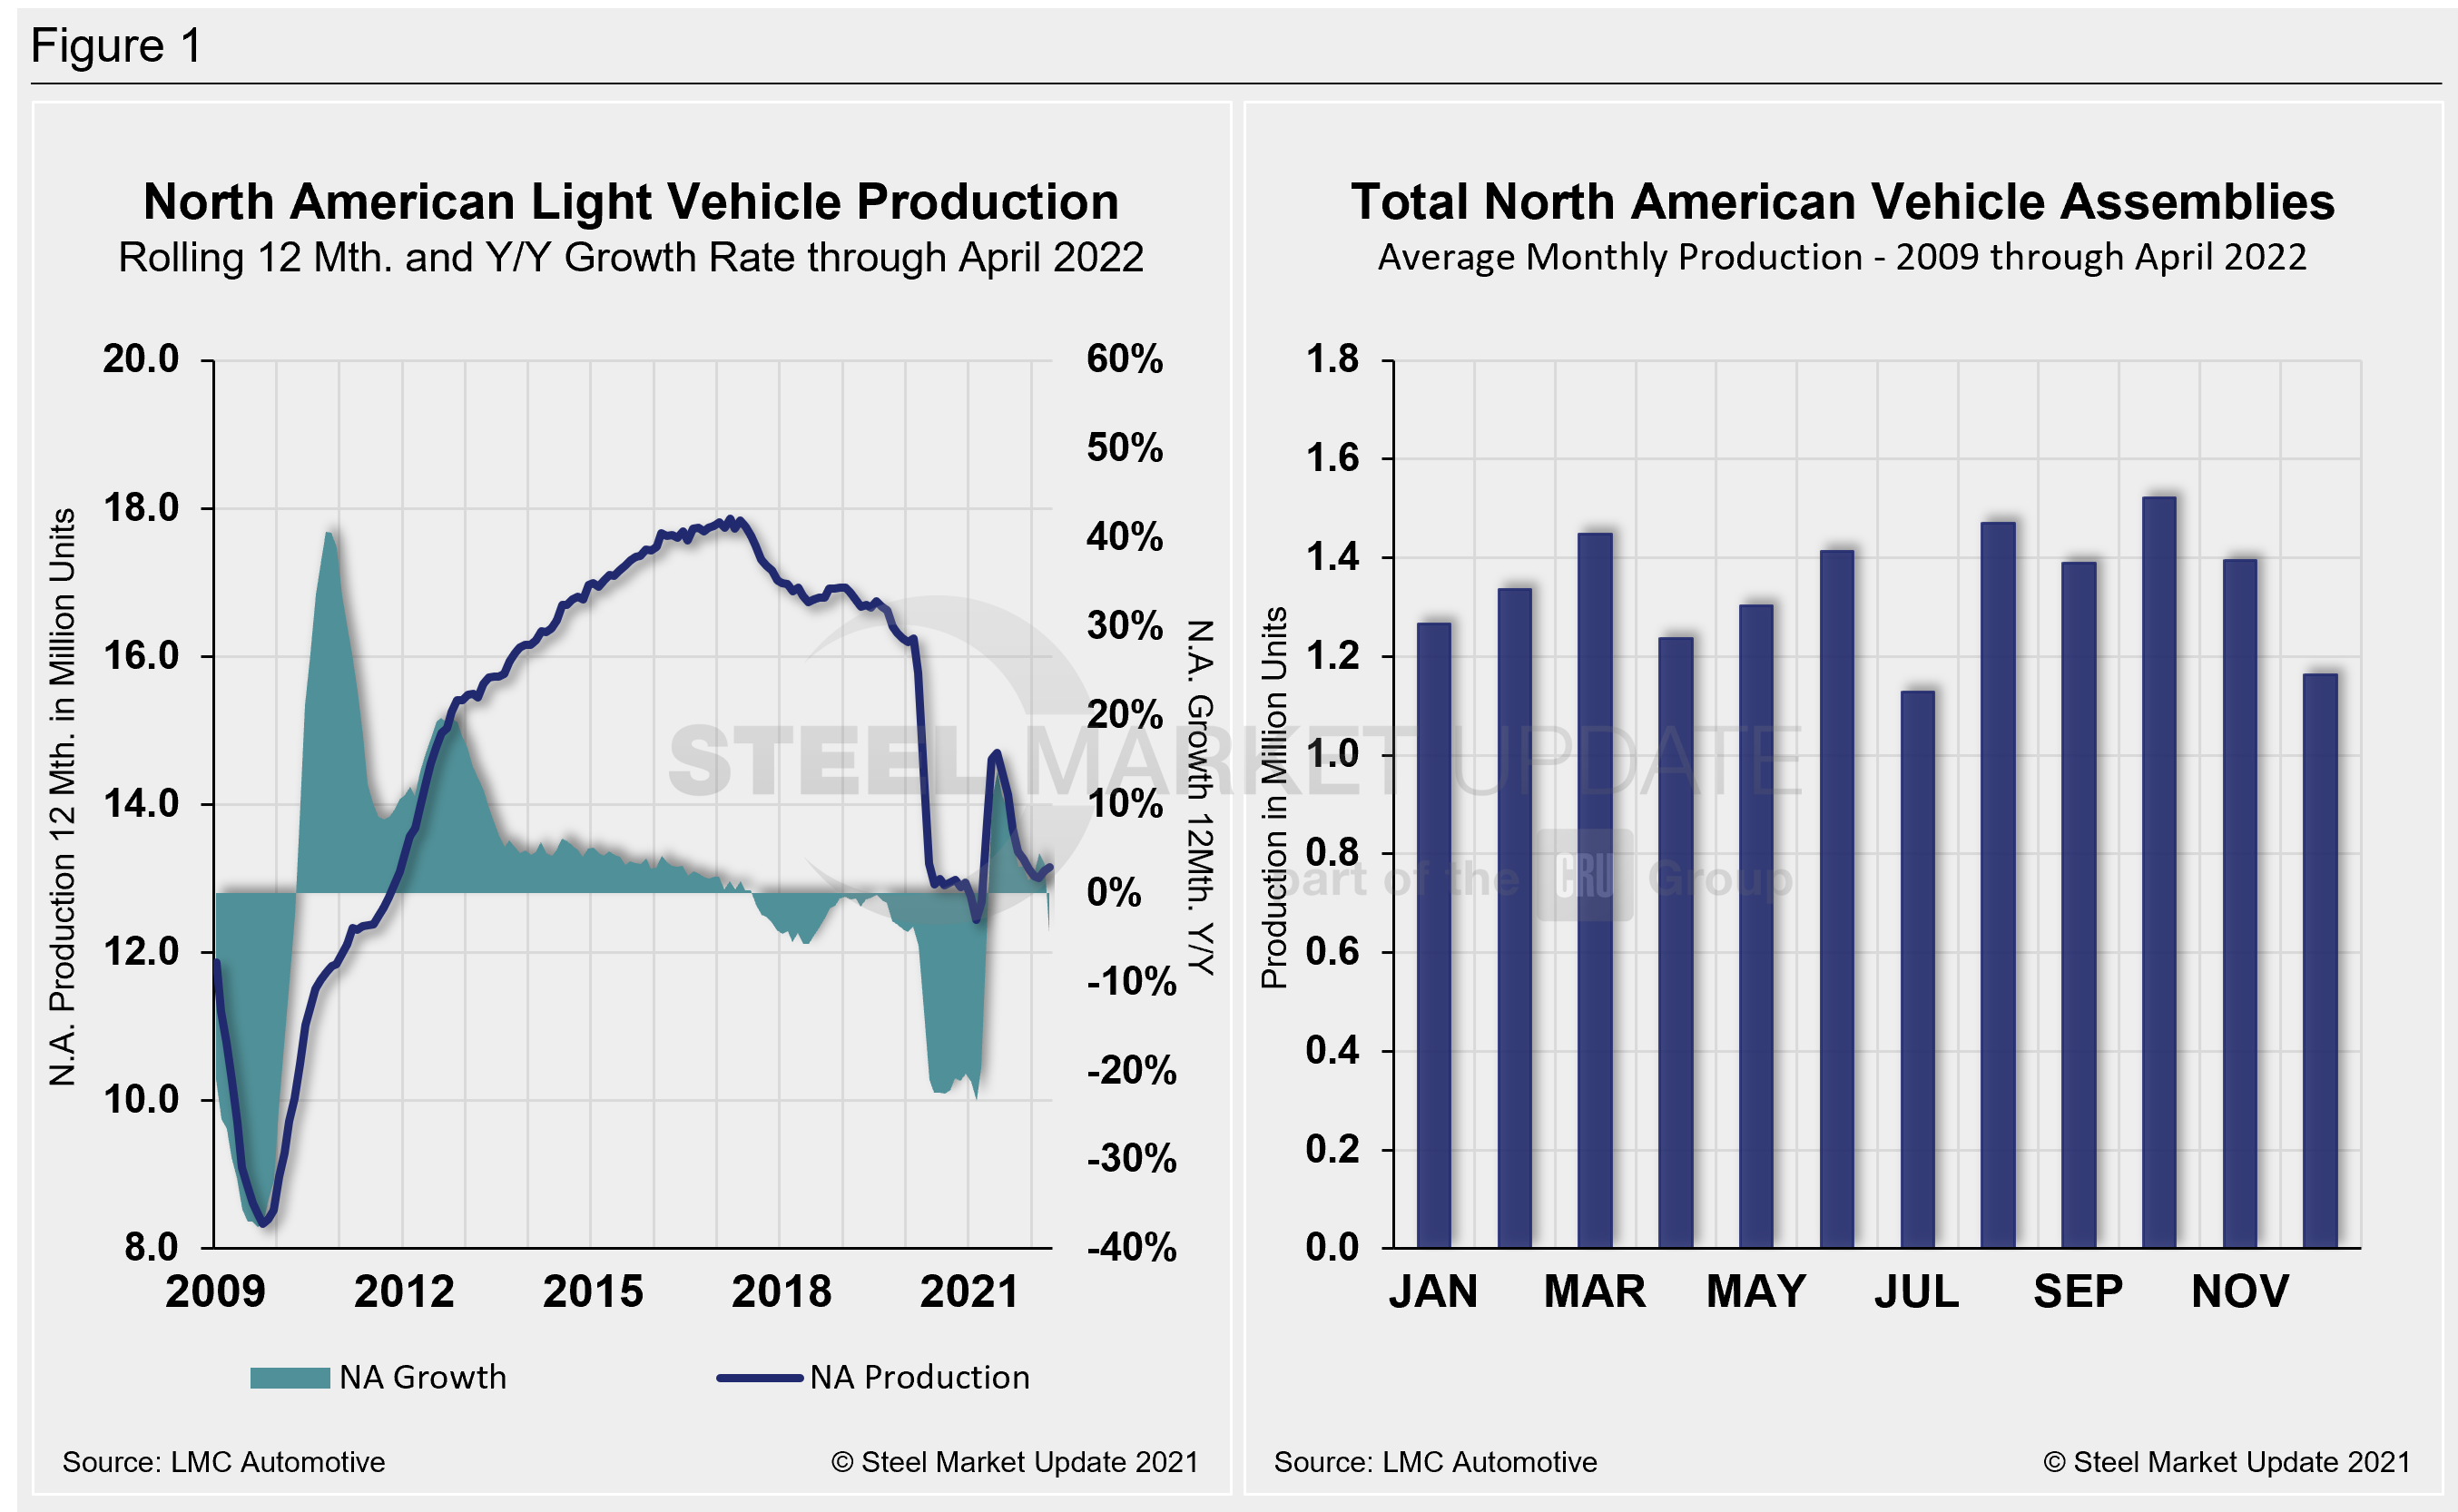
North American vehicle production, including personal and commercial vehicles, totaled 1.14 million units in April, down from 1.36 million units in March. Though somewhat improved over the past 12 months, North American automotive assembly totals are still well behind pre-pandemic totals. Last month’s total was down 115,257 units from April 2021’s production total.
Below in Figure 1 is North American light vehicle production since 2009 on a rolling 12-month and year-over-year growth rate. Also included is average monthly production, including seasonality, over the same period.
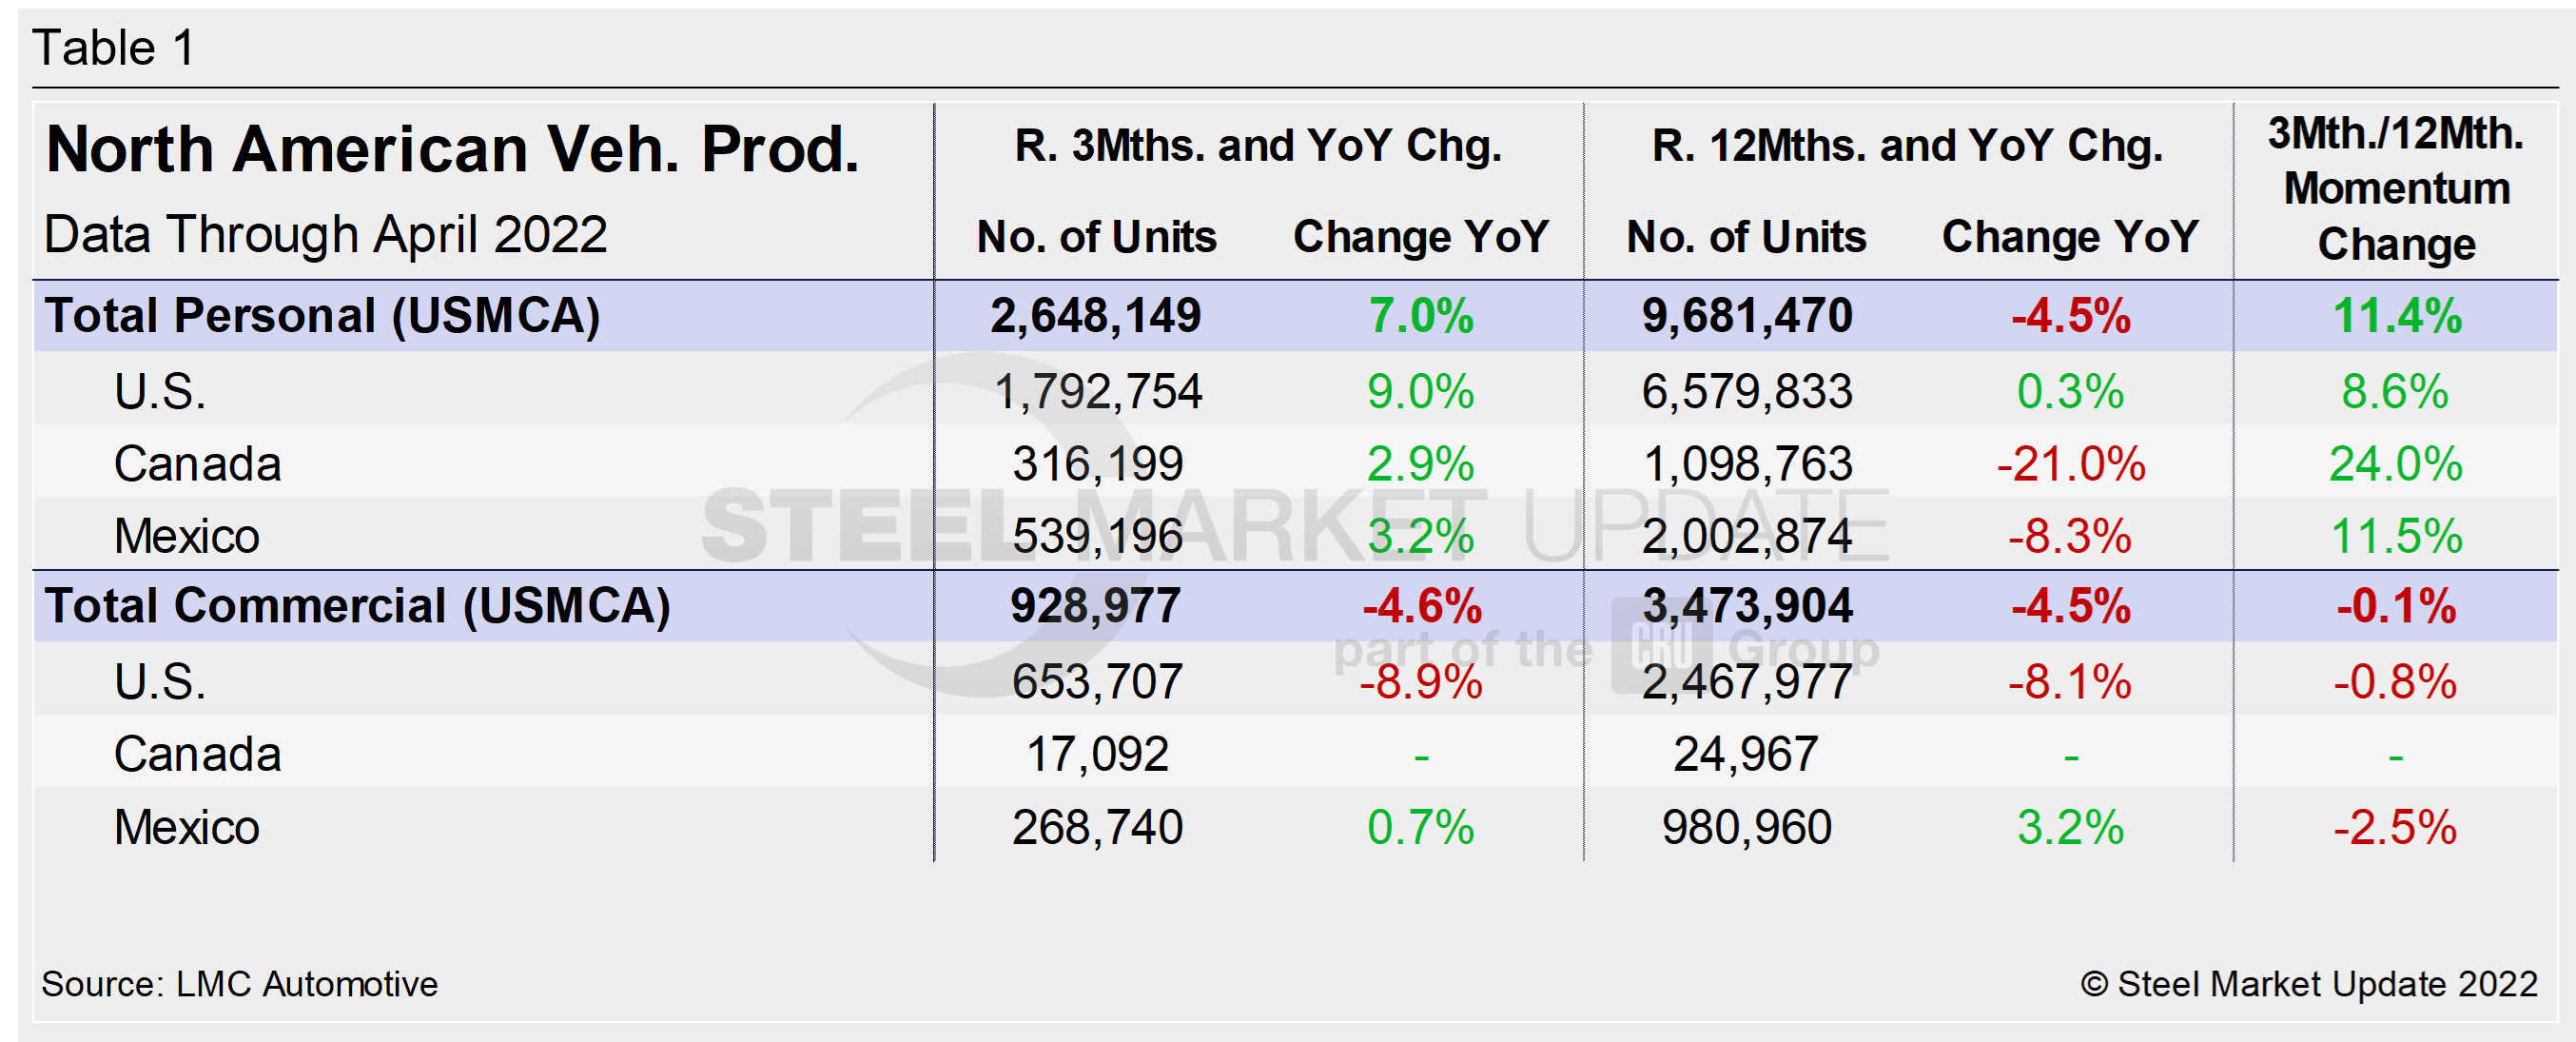
A short-term snapshot of assembly by nation and vehicle type is shown in the table below. It breaks down total North American personal and commercial vehicle production into US, Canadian and Mexican components, along with the three- and 12-month growth rate for each. On the far right, it shows the momentum for the total and for each of the three nations.
Although the initial rebound from the Covid doldrums was impressive, the effect of the chip and parts shortage has been more extensive due to its prolonged nature. Through last June, growth rates for personal and commercial light vehicles soared by 156.8% and 127.4%, respectively. But they have since tumbled because the chip shortage and supply-chain disruptions have persisted.
For three months through April, the growth rate for total personal vehicle assemblies in the USMCA region was -4.5% YoY. A decrease from a 0.7% growth the month prior. Growth for commercial assemblies has improved slightly, from -11.9% in March to -4.5% in April. The improvement was surprising given the demand for fleet vehicles, as automakers focus their limited microchips on the best-selling vehicles.
Personal Vehicle Production
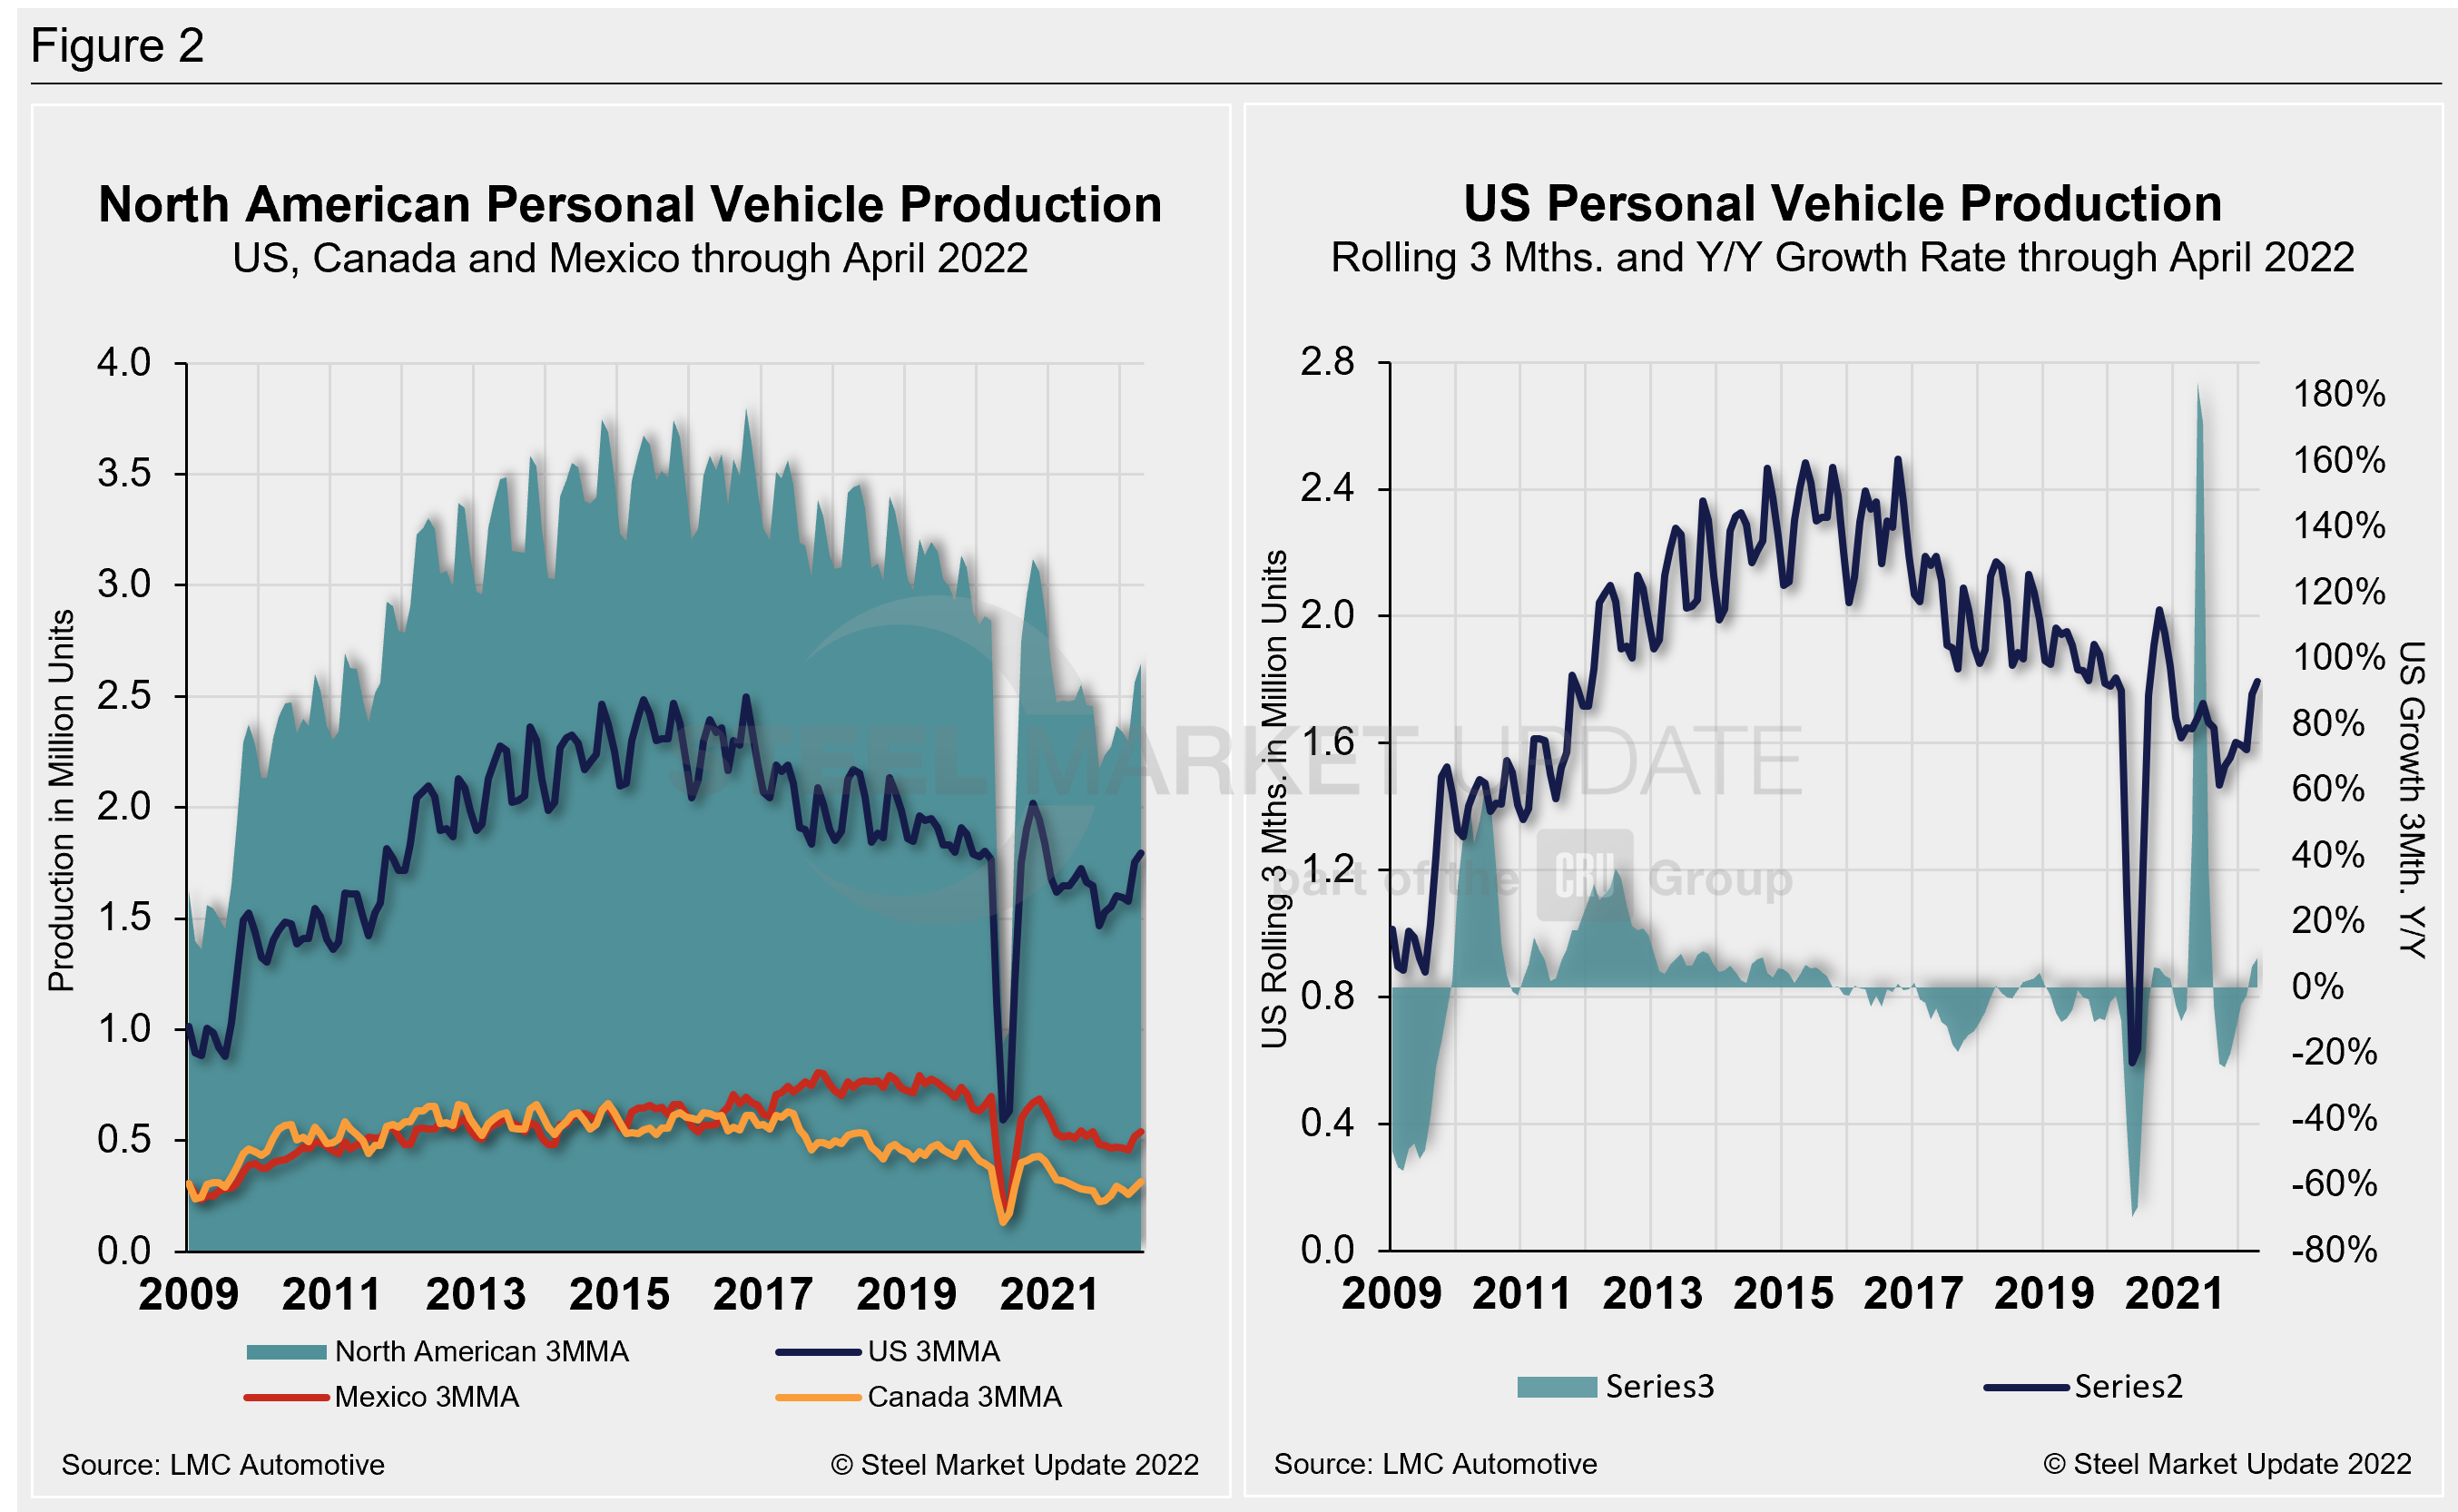
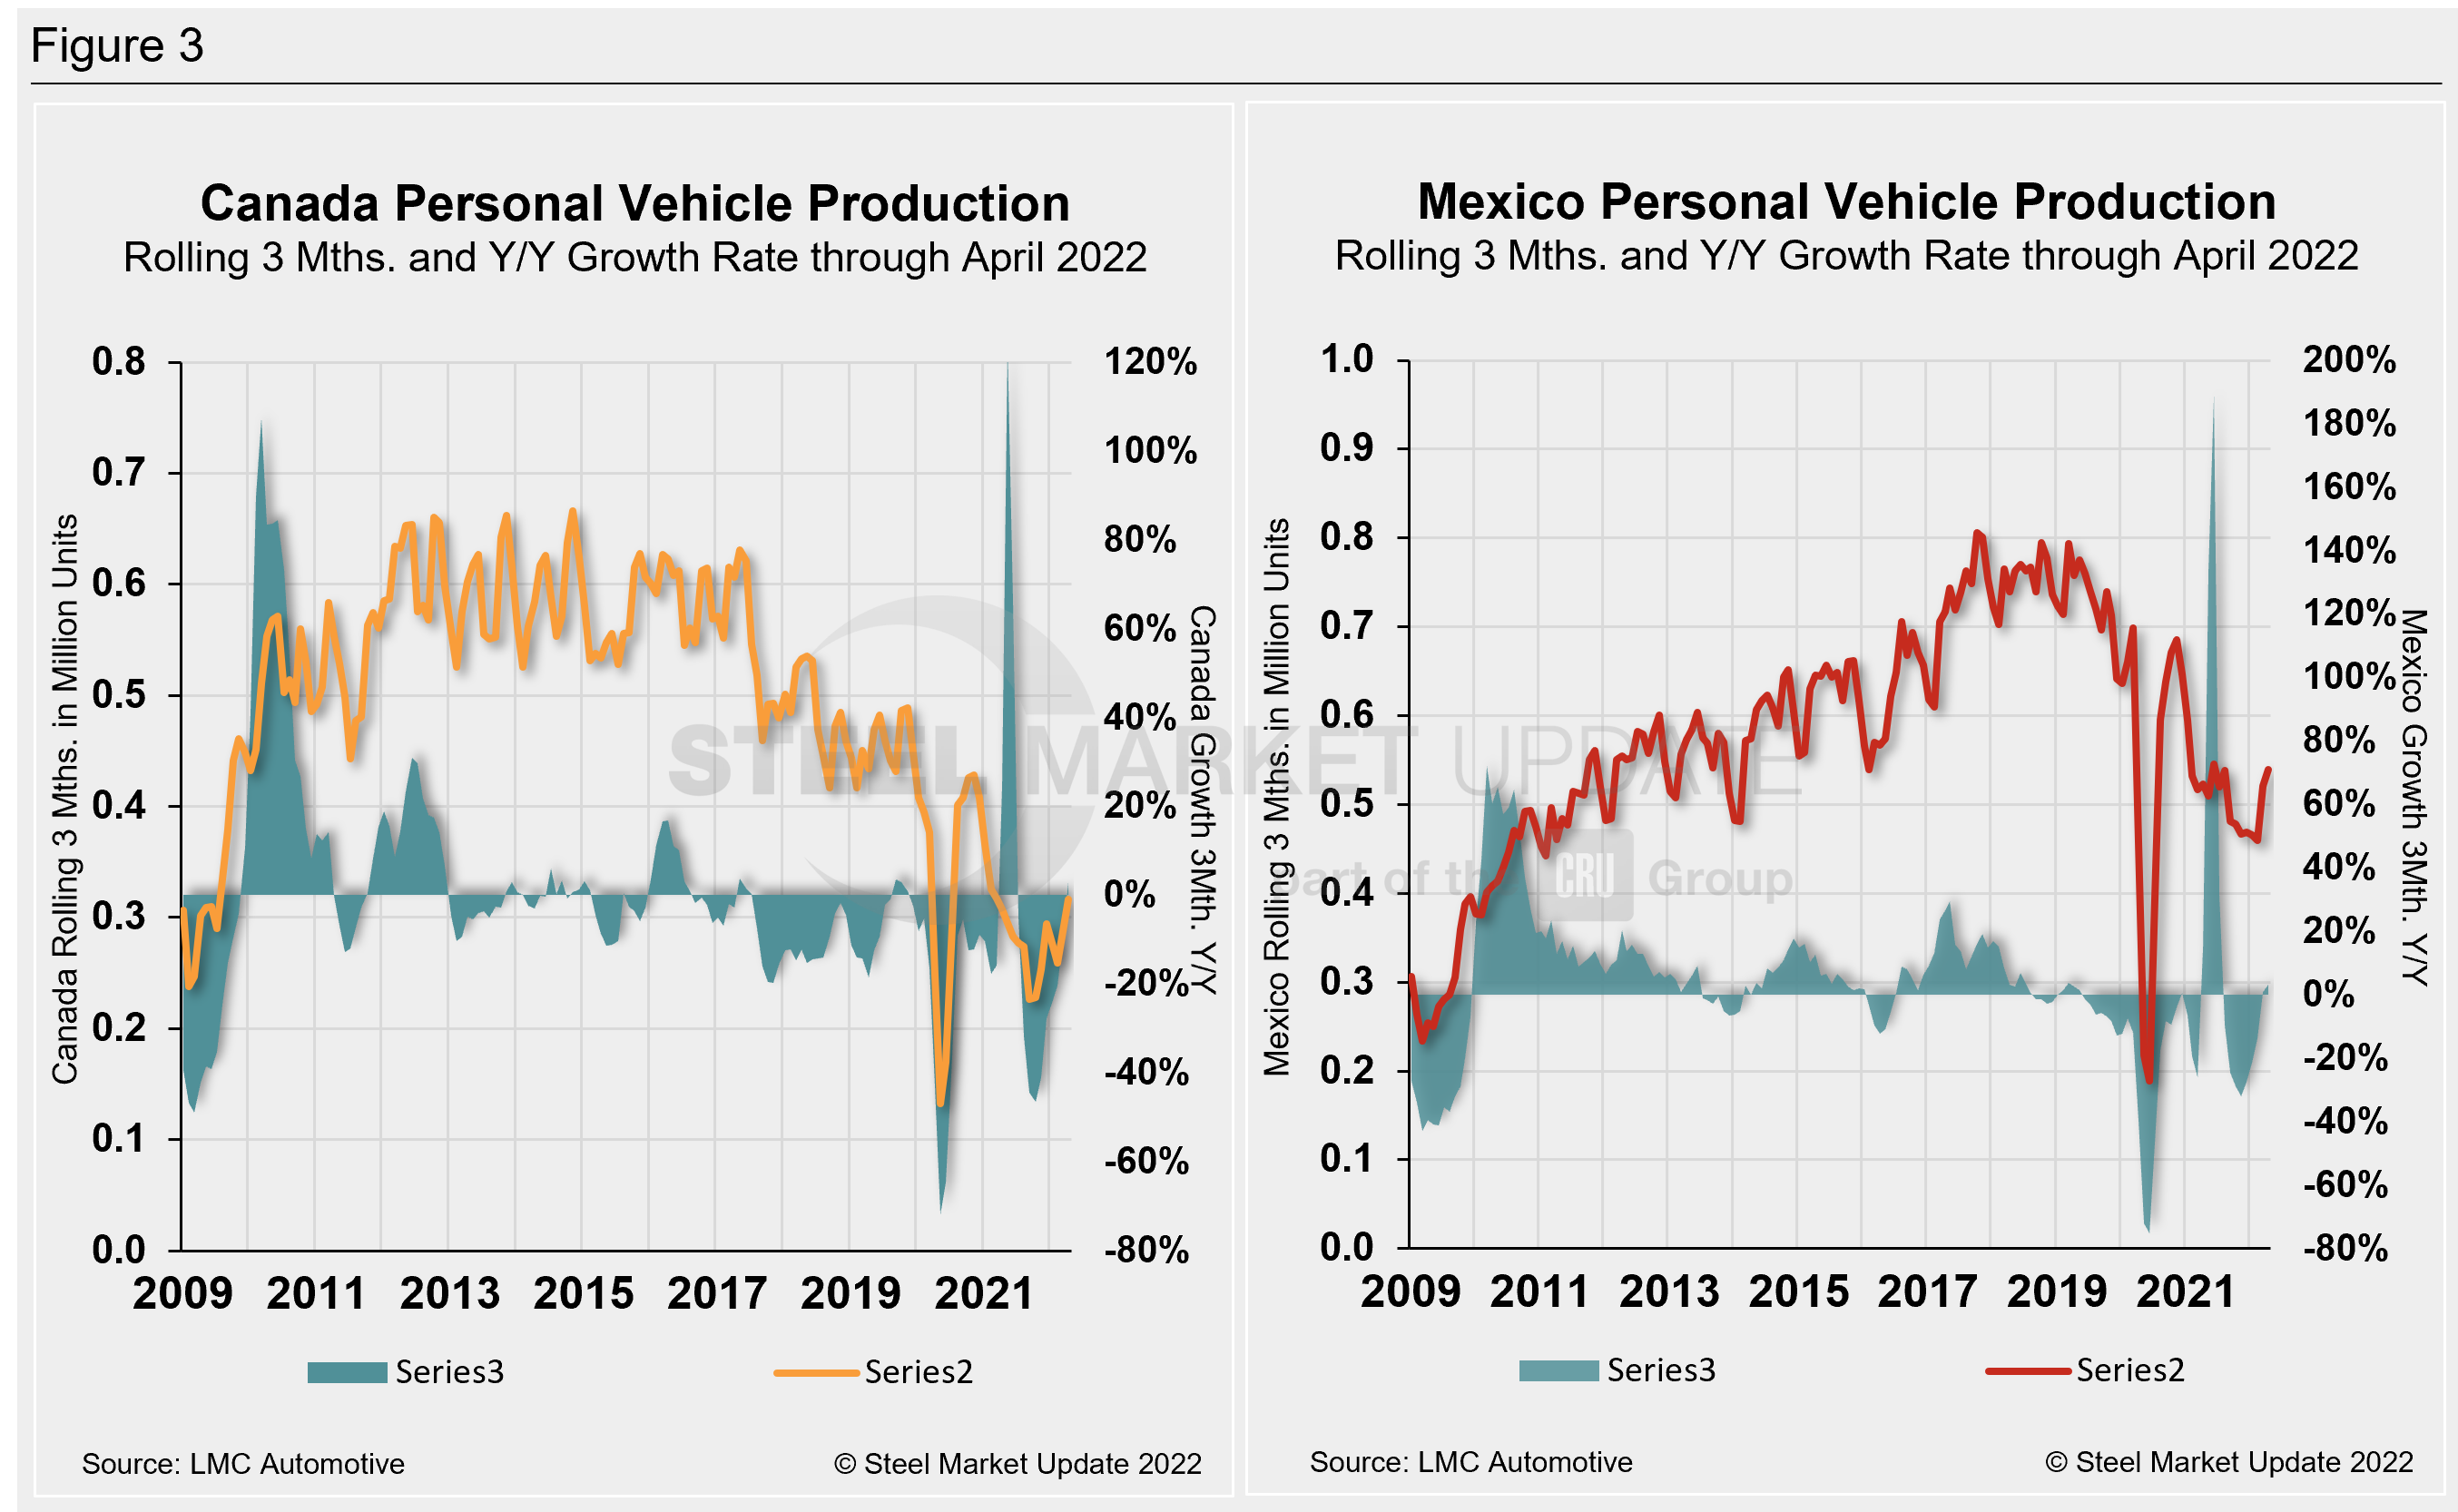
The longer-term picture of personal vehicle production across North America is shown below. The first chart in Figure 2 shows total personal vehicle production for North America as well as total for the US, Canada and Mexico individually. The production of personal vehicles in the US and the year-over-year growth rate are displayed in the second chart. Figure 3 shows side-by-side the production of personal vehicles in Canada and Mexico and the year-over-year growth rate.
In terms of personal vehicle production, all three – the US, Canada, and Mexico – saw double-digit declines in April.
Canada saw the greatest percentage decline, down 24% (-30,295 units) versus the month prior. The US saw the largest decrease in total units, down 112,737 (-16.6%) MoM. Mexican auto assemblies were also 12.3% lower (-25,679 units) over the same period.
Despite the MoM declines, the annual growth rate across the region in April improved. Canada saw the best gain at 12.4%, followed by the US at 2.6%. Mexico’s annual growth rate rebounded 2.4% in April. Overall, the region saw a decrease of 1168,711 units in April, an 16.7% fall from March’s total.
Canada’s personal vehicle production share of the North American market slipped slightly to 10.9% month over month in March, while Mexico’s share was unchanged at 20.1%. The US saw its share of the North American market rise four percentage points to 69.1% in March.
Commercial Vehicle Production
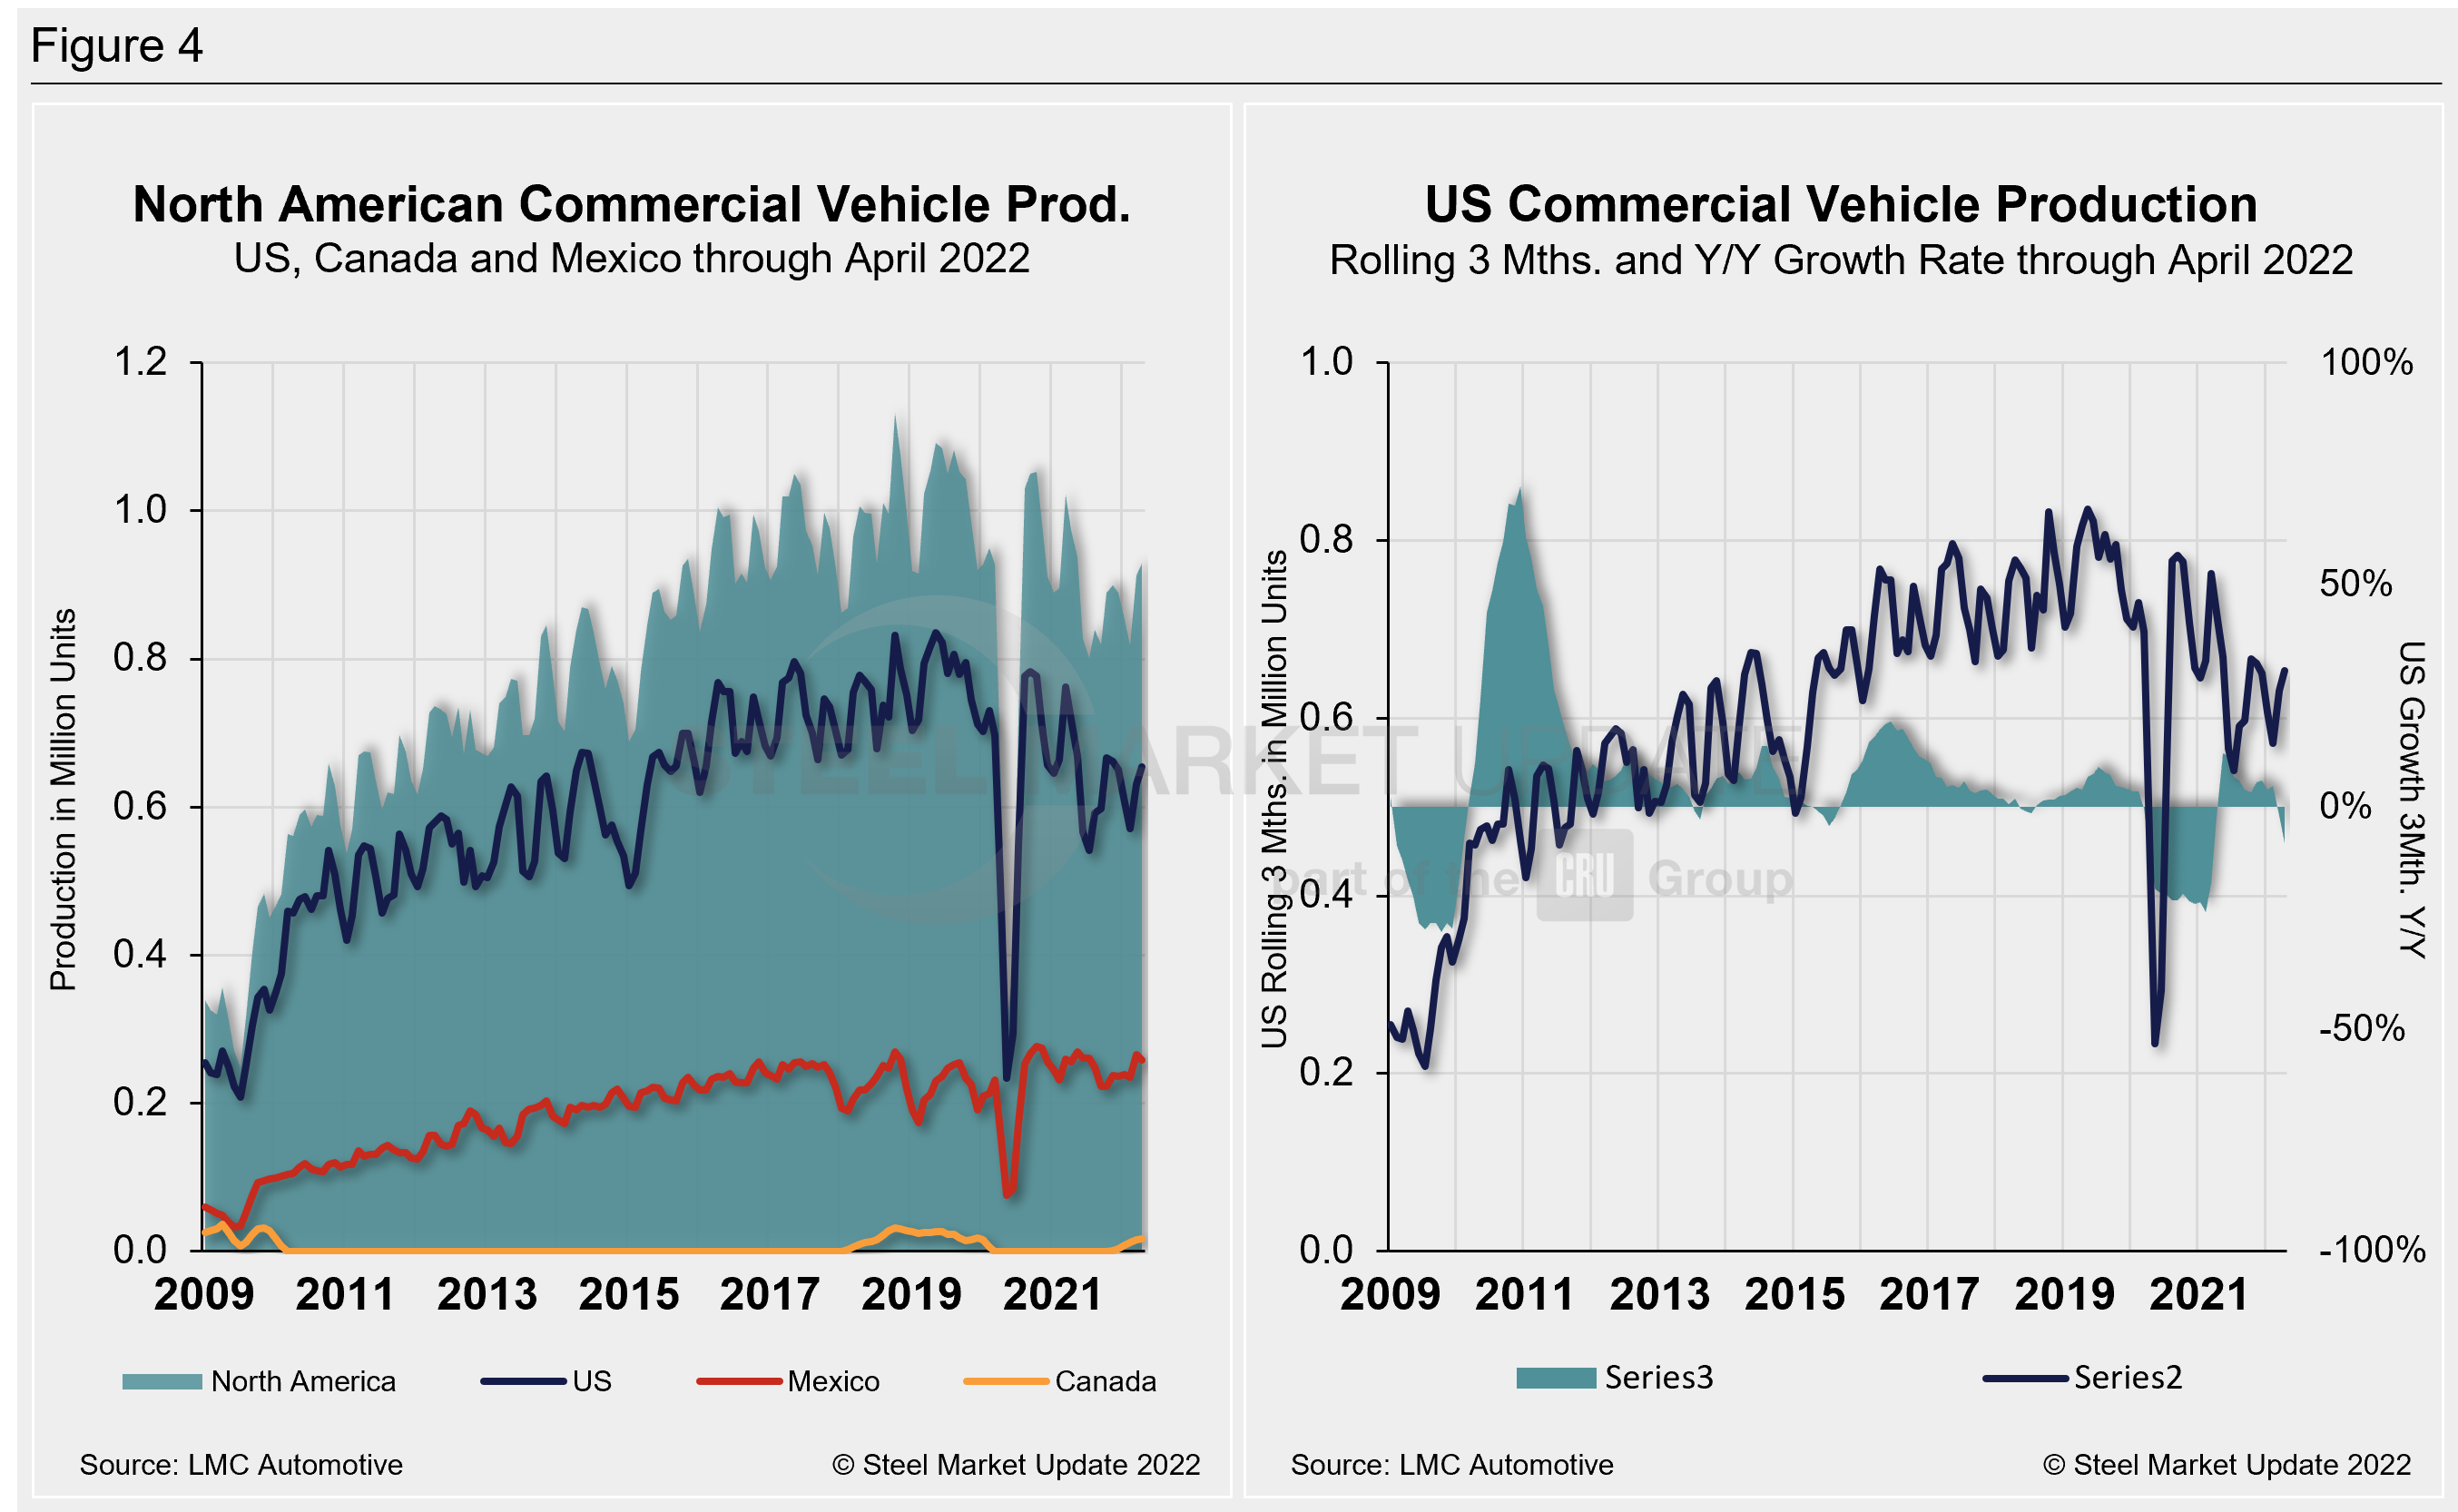
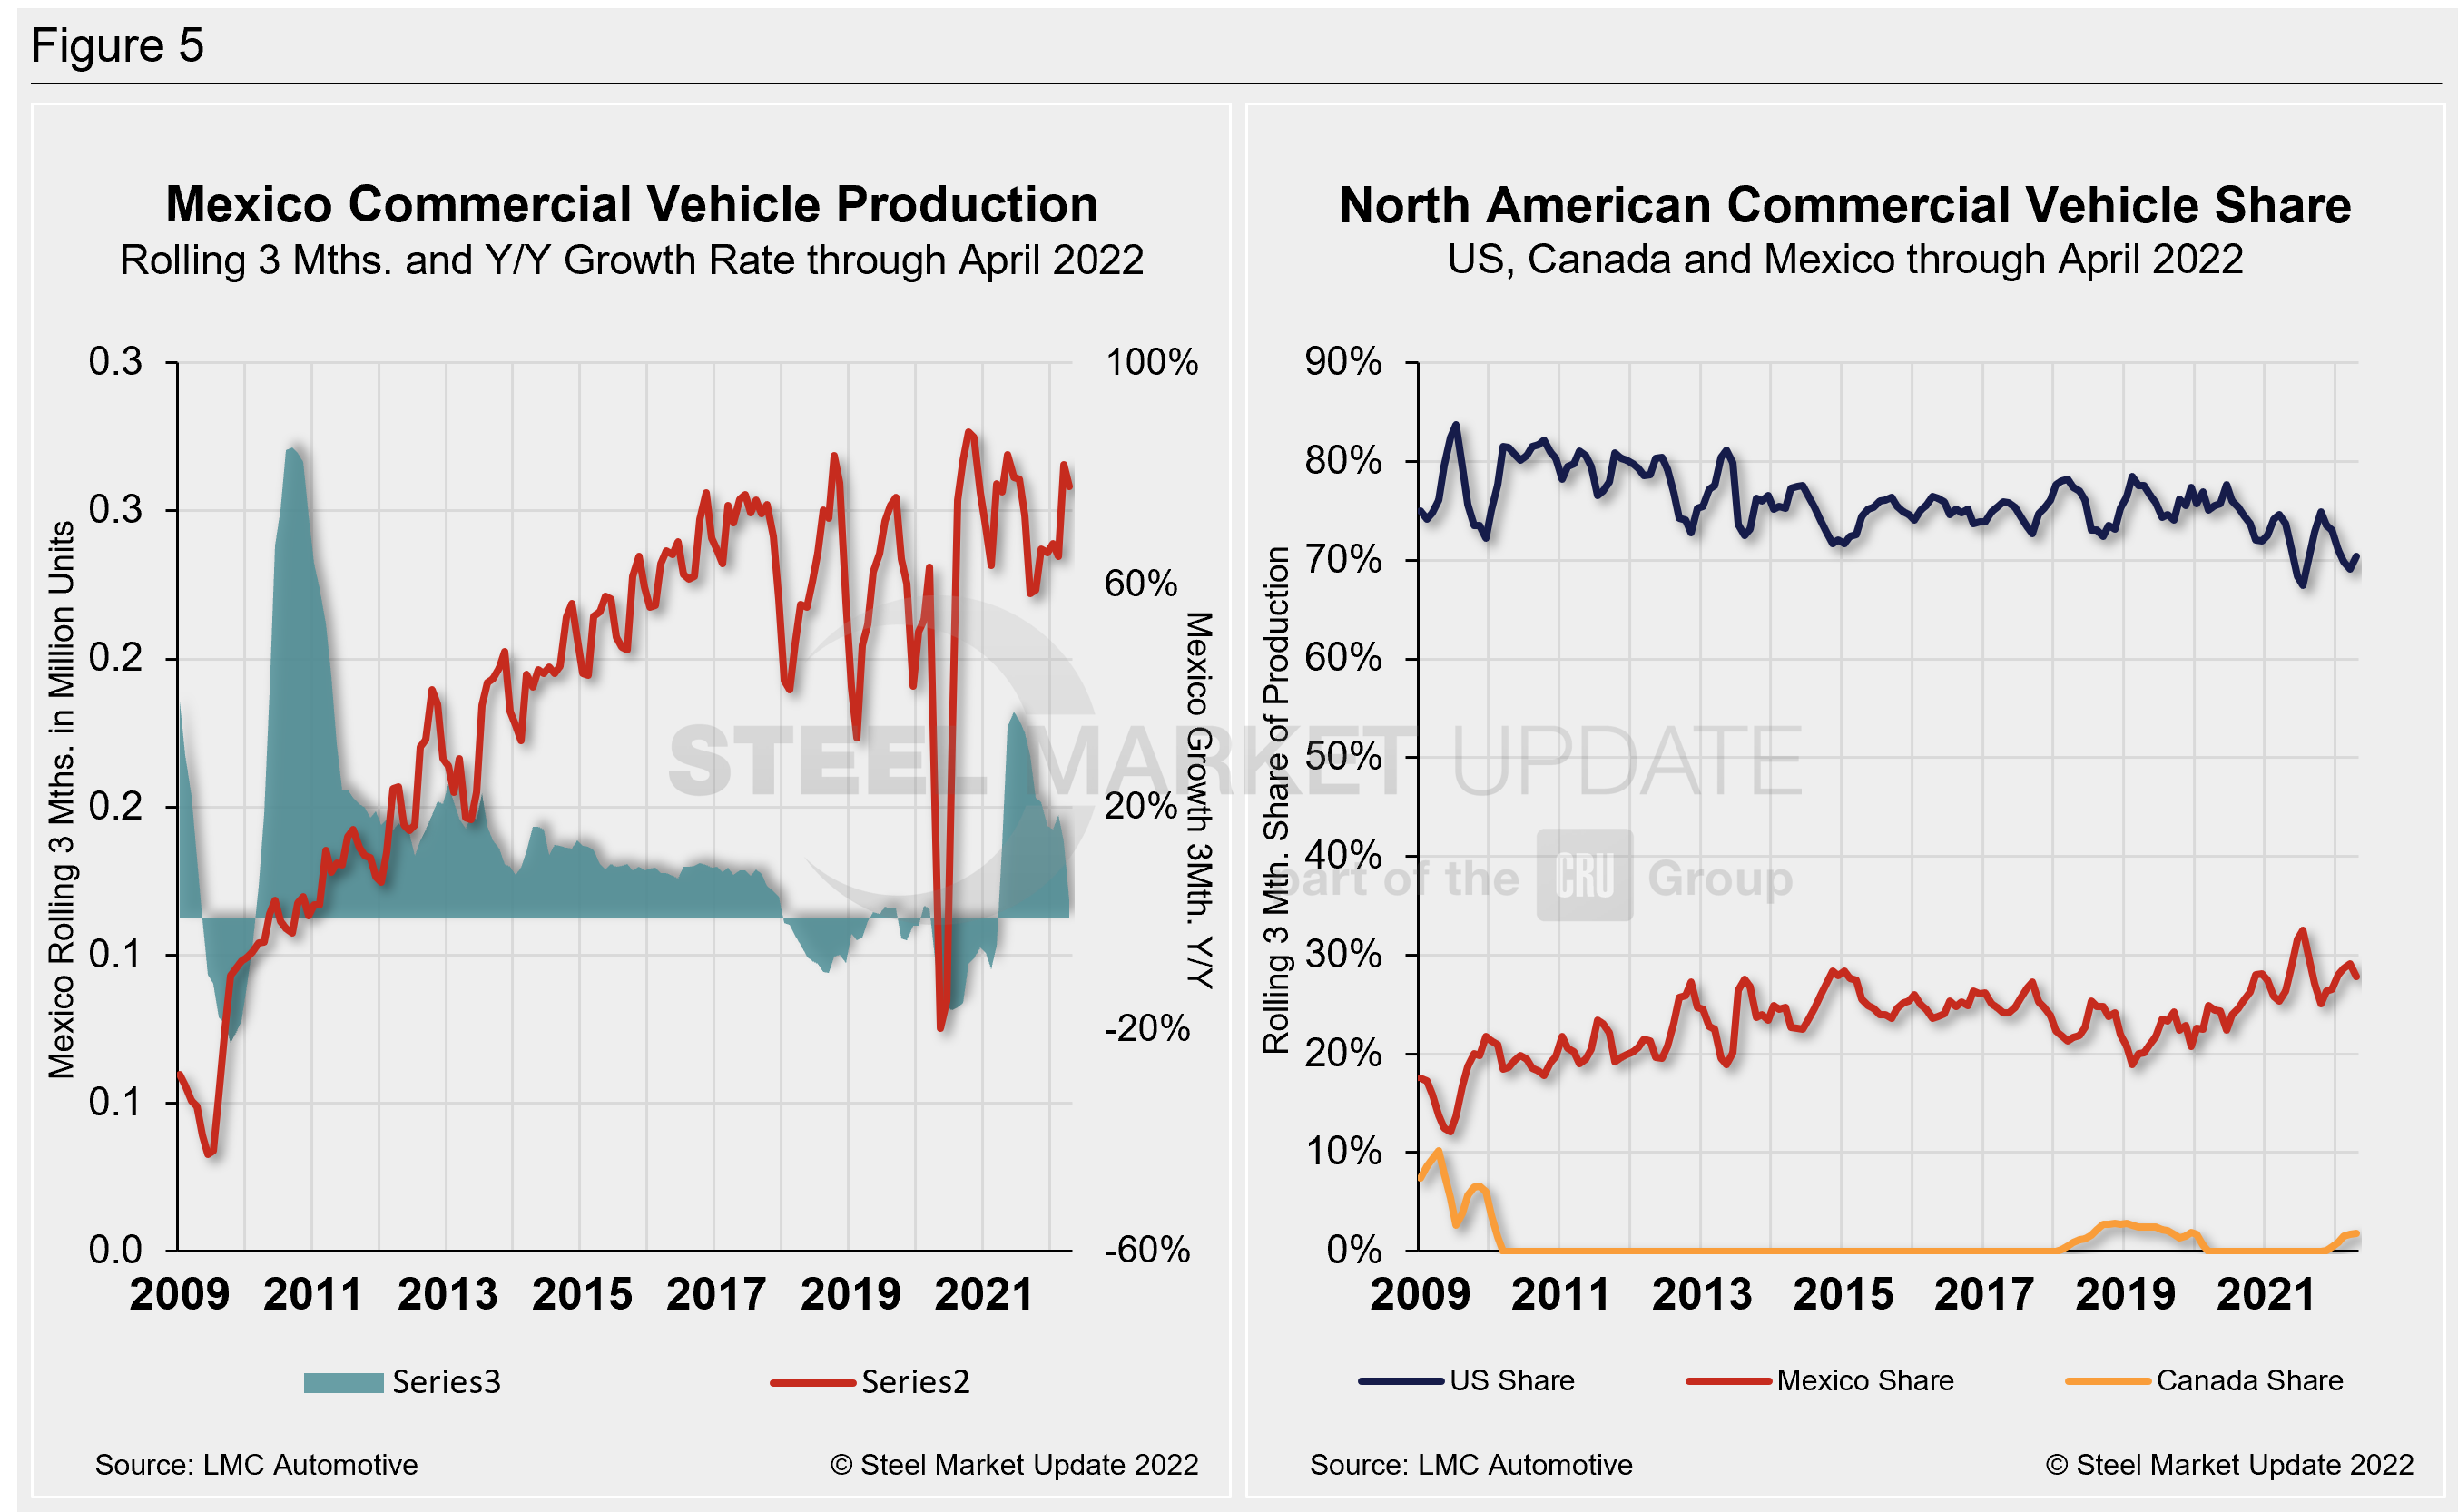
Total commercial vehicle production for North America and the total for each nation within the region are shown in the first chart in Figure 4 on a rolling three-month basis. The production of commercial vehicles in the US and the year-over-year growth rate are displayed in the second chart. The first chart in Figure 5 shows the production of commercial vehicles and the year-over-year growth rate in Mexico. The second chart shows the production share for each nation in North America.
Of note for the Canadian automotive sector: April marked Canada’s sixth straight month of commercial vehicle production after a 20-month production halt. Although Canada produced 5,370 light commercial vehicles in April, it was a 17.4% fall MoM.
North American commercial vehicle production fell 13.2% in April to 301,080 units from 333,426 units in March. The 45,603-unit loss MoM was driven by declines across the region. The US saw the greatest unit loss, down 30,240 (-12.3%), followed by Mexico, down 14,229 (-15.2%), and Canada.
The annual commercial production growth rate is now -4.6% for the region, an improvement from -11.9% in March. The US share was 70.4%, up 2 percentage points in April MoM. Mexico saw its share decline to 26.3% in April from 27.8% in March, while Canada saw its shares marginally to 1.8% in April from 1.7% the month prior. Presently, Mexico exports just under 80% of its light vehicle production. The US and Canada are the highest volume destinations for Mexican exports.
Editor’s Note: This report is based on data from LMC Automotive for automotive assemblies in the US, Canada, and Mexico. The breakdown of assemblies is “Personal” (cars for personal use) and “Commercial” (light vehicles less than 6.0 metric tons gross vehicle weight rating; heavy trucks and buses are not included).
By David Schollaert, David@SteelMarketUpdate.com


