

Market Data

June 9, 2022
US Job Creation Surprises in May
Written by David Schollaert
Editor’s note: Steel Market Update is pleased to share this Premium content with Executive members. For information on how to upgrade to a Premium-level subscription, email Info@SteelMarketUpdate.com.
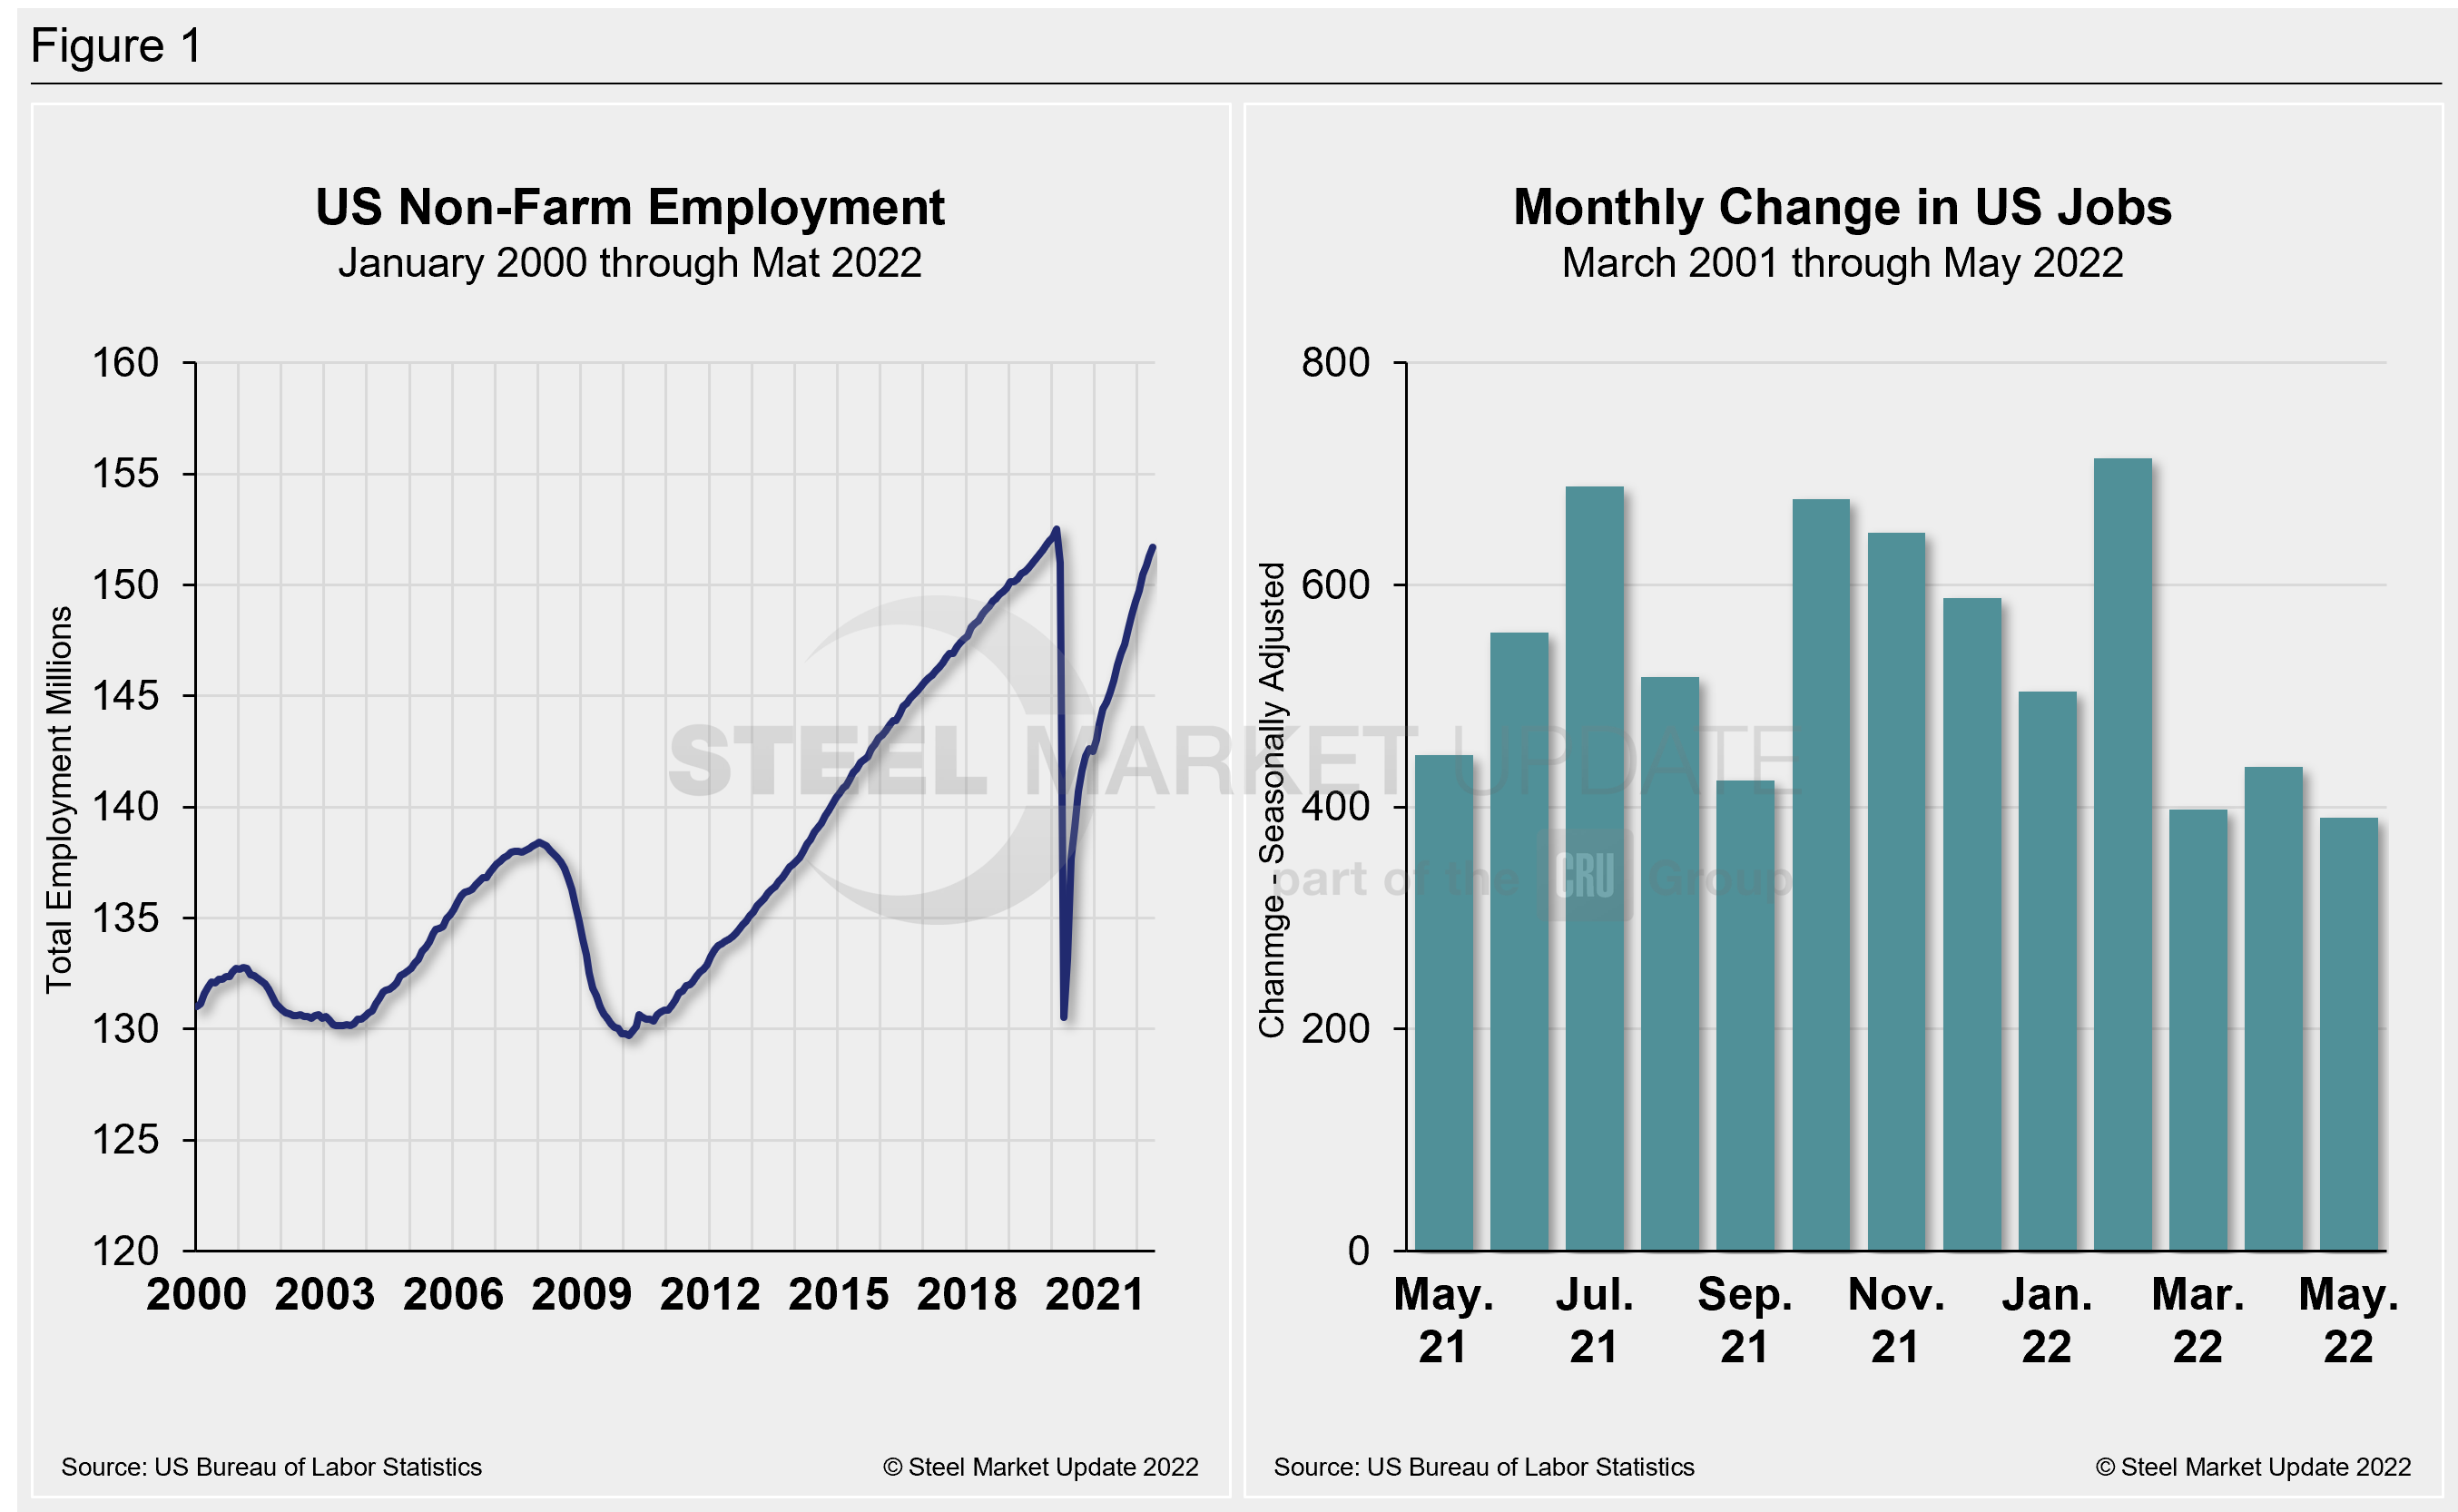
The US economy surprises in May by adding 390,000 new jobs, higher than earlier estimates and despite growing concerns about economic slowdown and surging inflation. The result kept the unemployment rate unchanged at 3.6% – nearly the lowest level since December 1969, according to the Labor Department.
Despite the remarkable performance, May’s total represented a pullback from the upwardly revised 436,000 in April and was the lowest monthly gain since April 2021.
May’s job gains were broad-based. Leisure and hospitality led, adding 84,000 positions. Professional and business services rose by 75,000, transportation and warehousing contributed 47,000, and construction jobs increased by 36,000.
Other areas that saw notable gains included state government education (+36,000), private education (+33,000), health care (+28,000), manufacturing (+18,000), and wholesale trade (+14,000).
Retail trade took a hit on the month, however, losing 61,000 in May, though the US Bureau of Labor Statistics noted that the sector remains 159,000 above its February 2020 pre-pandemic level.
In the goods-producing sector, payroll growth was little changed month-on-month (MoM), with jobs growing by 59,000 in May. The service-producing sector, led by hiring in leisure and hospitality, saw payrolls grow by 331,000.
The labor force participation rate rose to 62.3% in May, up slightly from 62.2% in April. Side-by-side in Figure 1 below is a snapshot of the pace of hiring since April 2021 and the total number of nonfarm workers employed in the US since 2000.
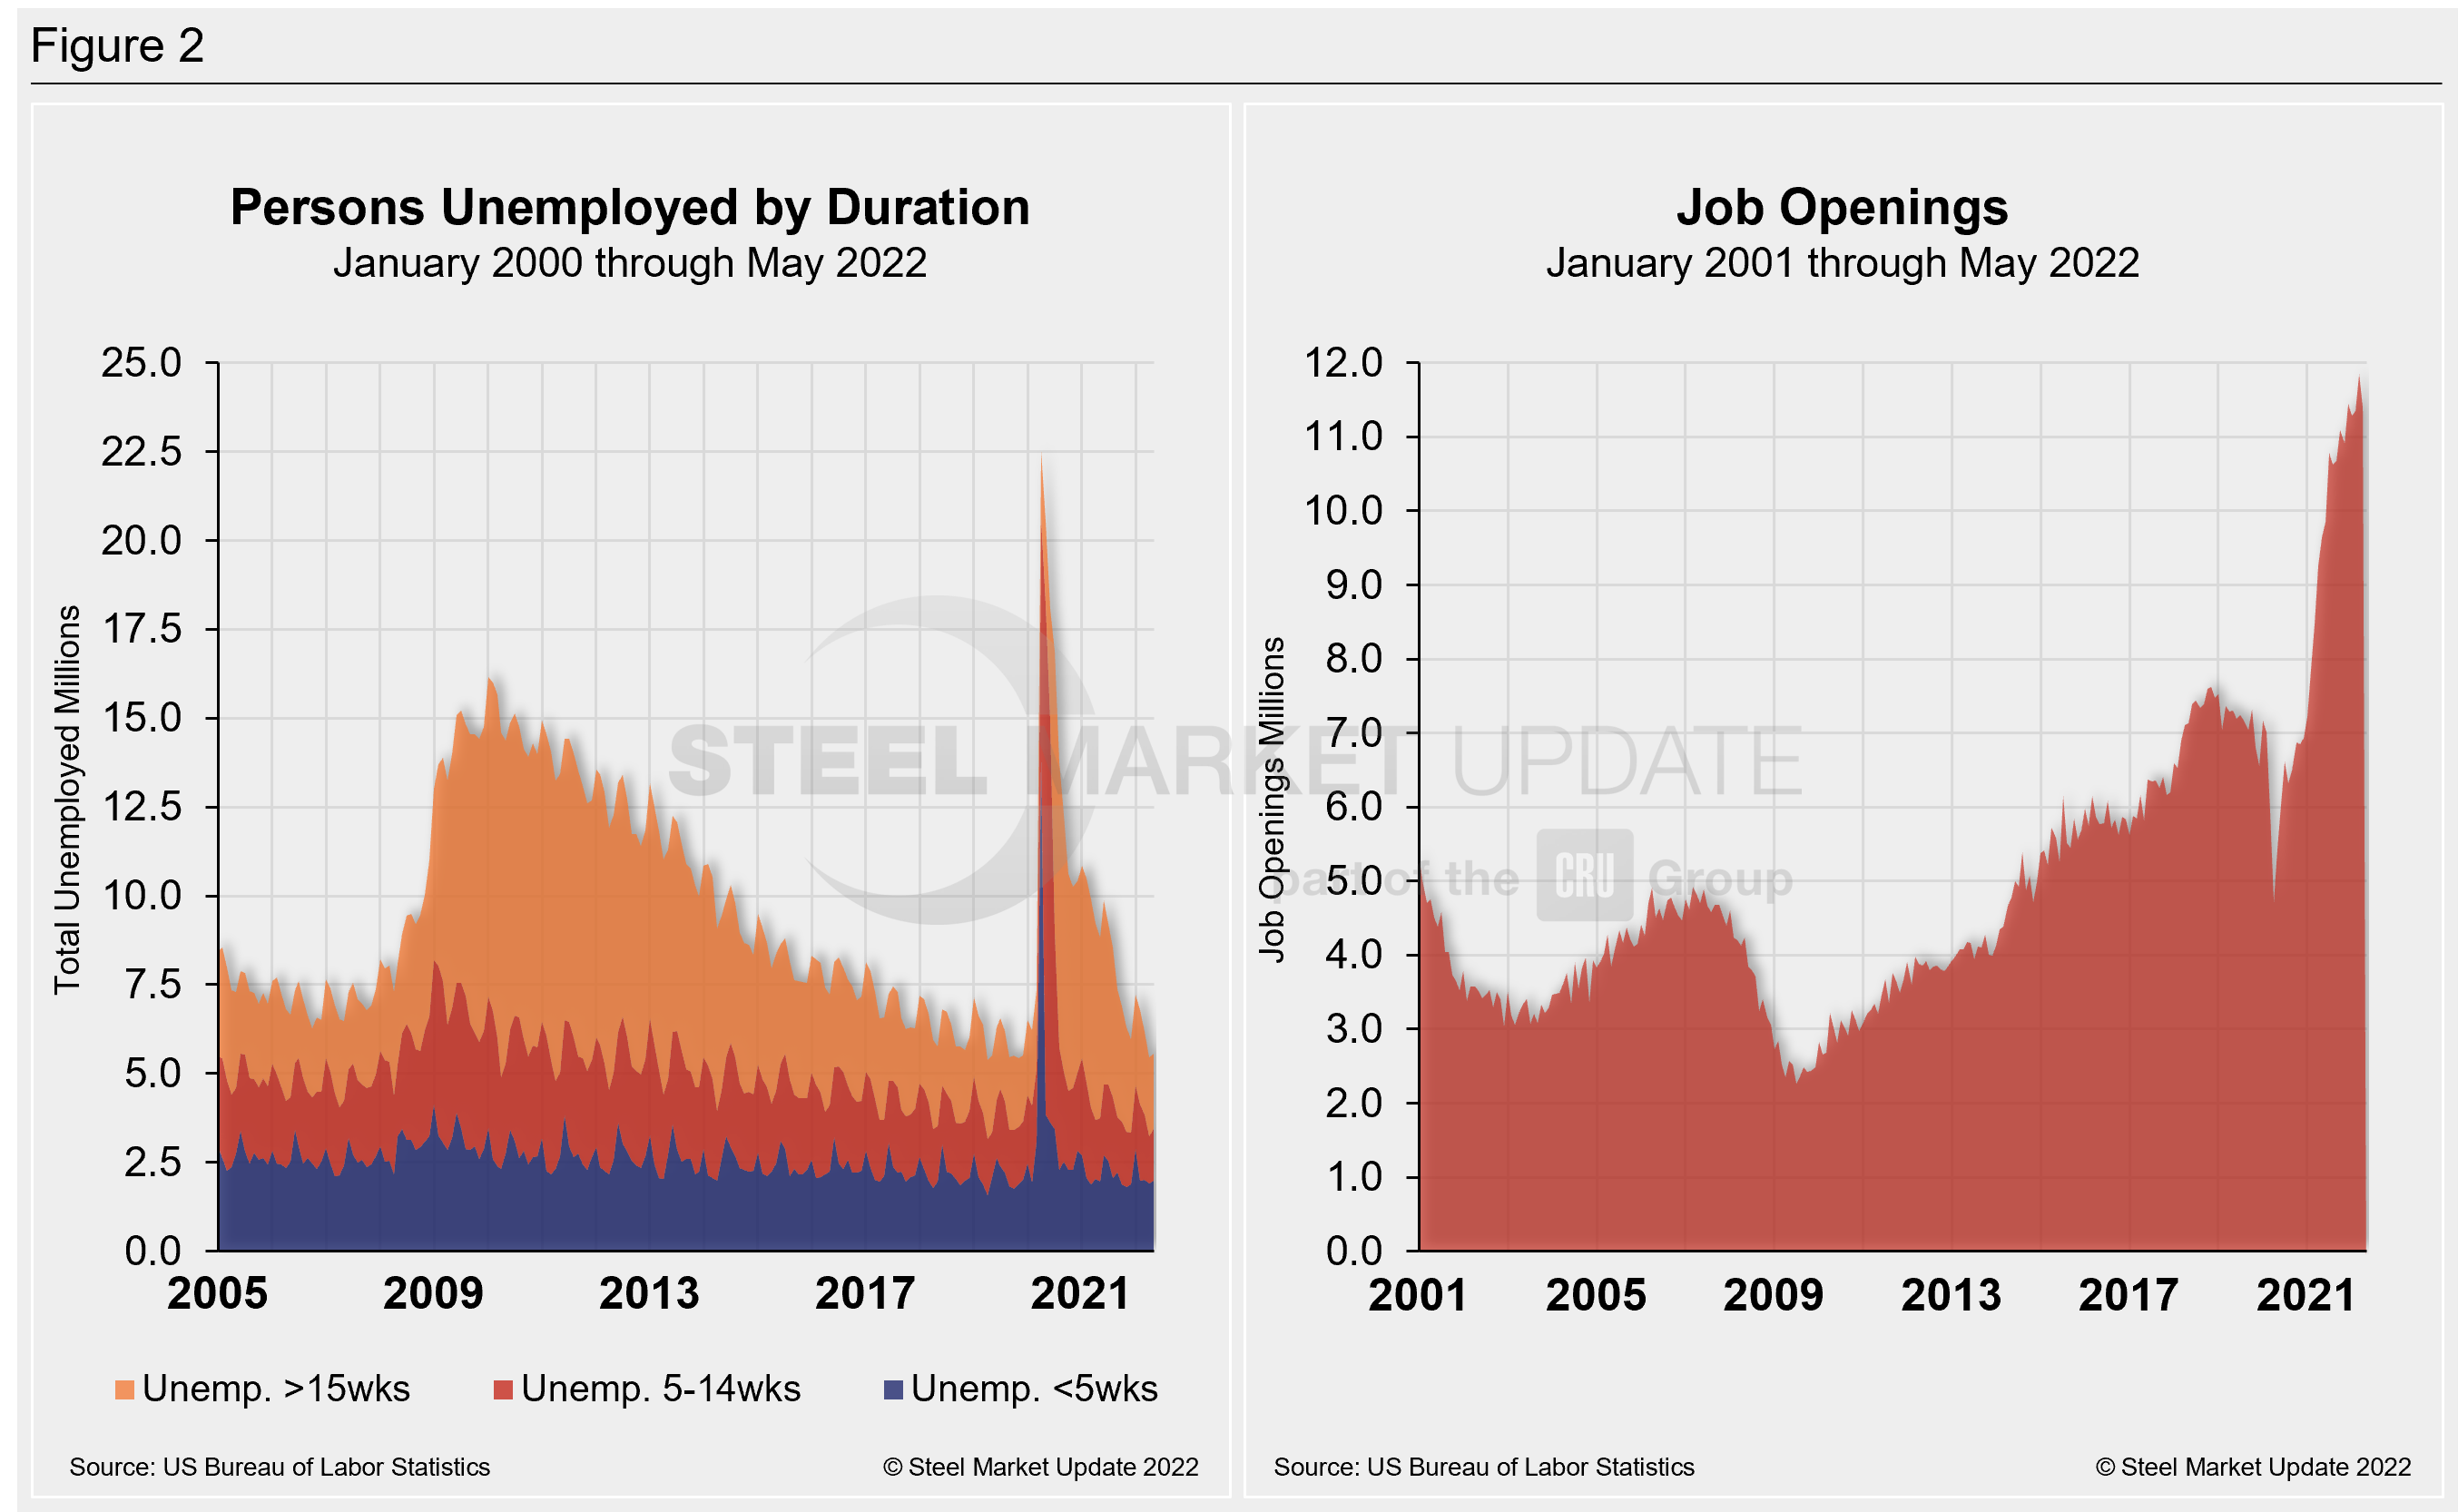
The number of long-term unemployed (out of work for at least 27 consecutive weeks) edged down to 1.4 million in May versus April. That figure accounted for 23.2% of the total unemployed in the month. This measure is down from a recent high of 4.0 million last year but is 235,000 higher than in February 2020.
The historic picture for the duration of unemployment since January 2000 is broken down into <5 weeks, 5 to 14 weeks, and >15 weeks in Figure 2. The total number of unemployed was 5.548 million at the end of May, an increase of 90,000 compared to April. Despite the increase, the result kept the unemployment total below pre-pandemic levels for the third straight month.
May’s results show that roughly 16.9 million more people now have jobs compared to the 22.5 million thrown out of work during the worst of the pandemic in April 2020. As of June 6, 37.9% had been unemployed for more than 15 weeks, 26.1% for 5 to 14 weeks, and 35.9% for less than 5 weeks.
As part of May’s employment report, the Labor Department released its monthly report on job openings, layoffs, and quitting through the last day of April. Also known as the “JOLTS” report, the data serve as an indicator of how much demand there is for workers in the US economy and the extent to which employers are still struggling with labor shortages nearly two years removed from the worst of the pandemic.
April’s job openings fell from the record number set in March but remained the second-highest total to date. The report suggests that workers remain in high demand and are still quitting more often. There were about 11.4 million job openings in April, 455,000 fewer job openings than March’s record of 11.9 million.
The charts below (Figure 2) detail the total persons unemployed by duration from 2005 through May 2022 and the total job openings over the same period.
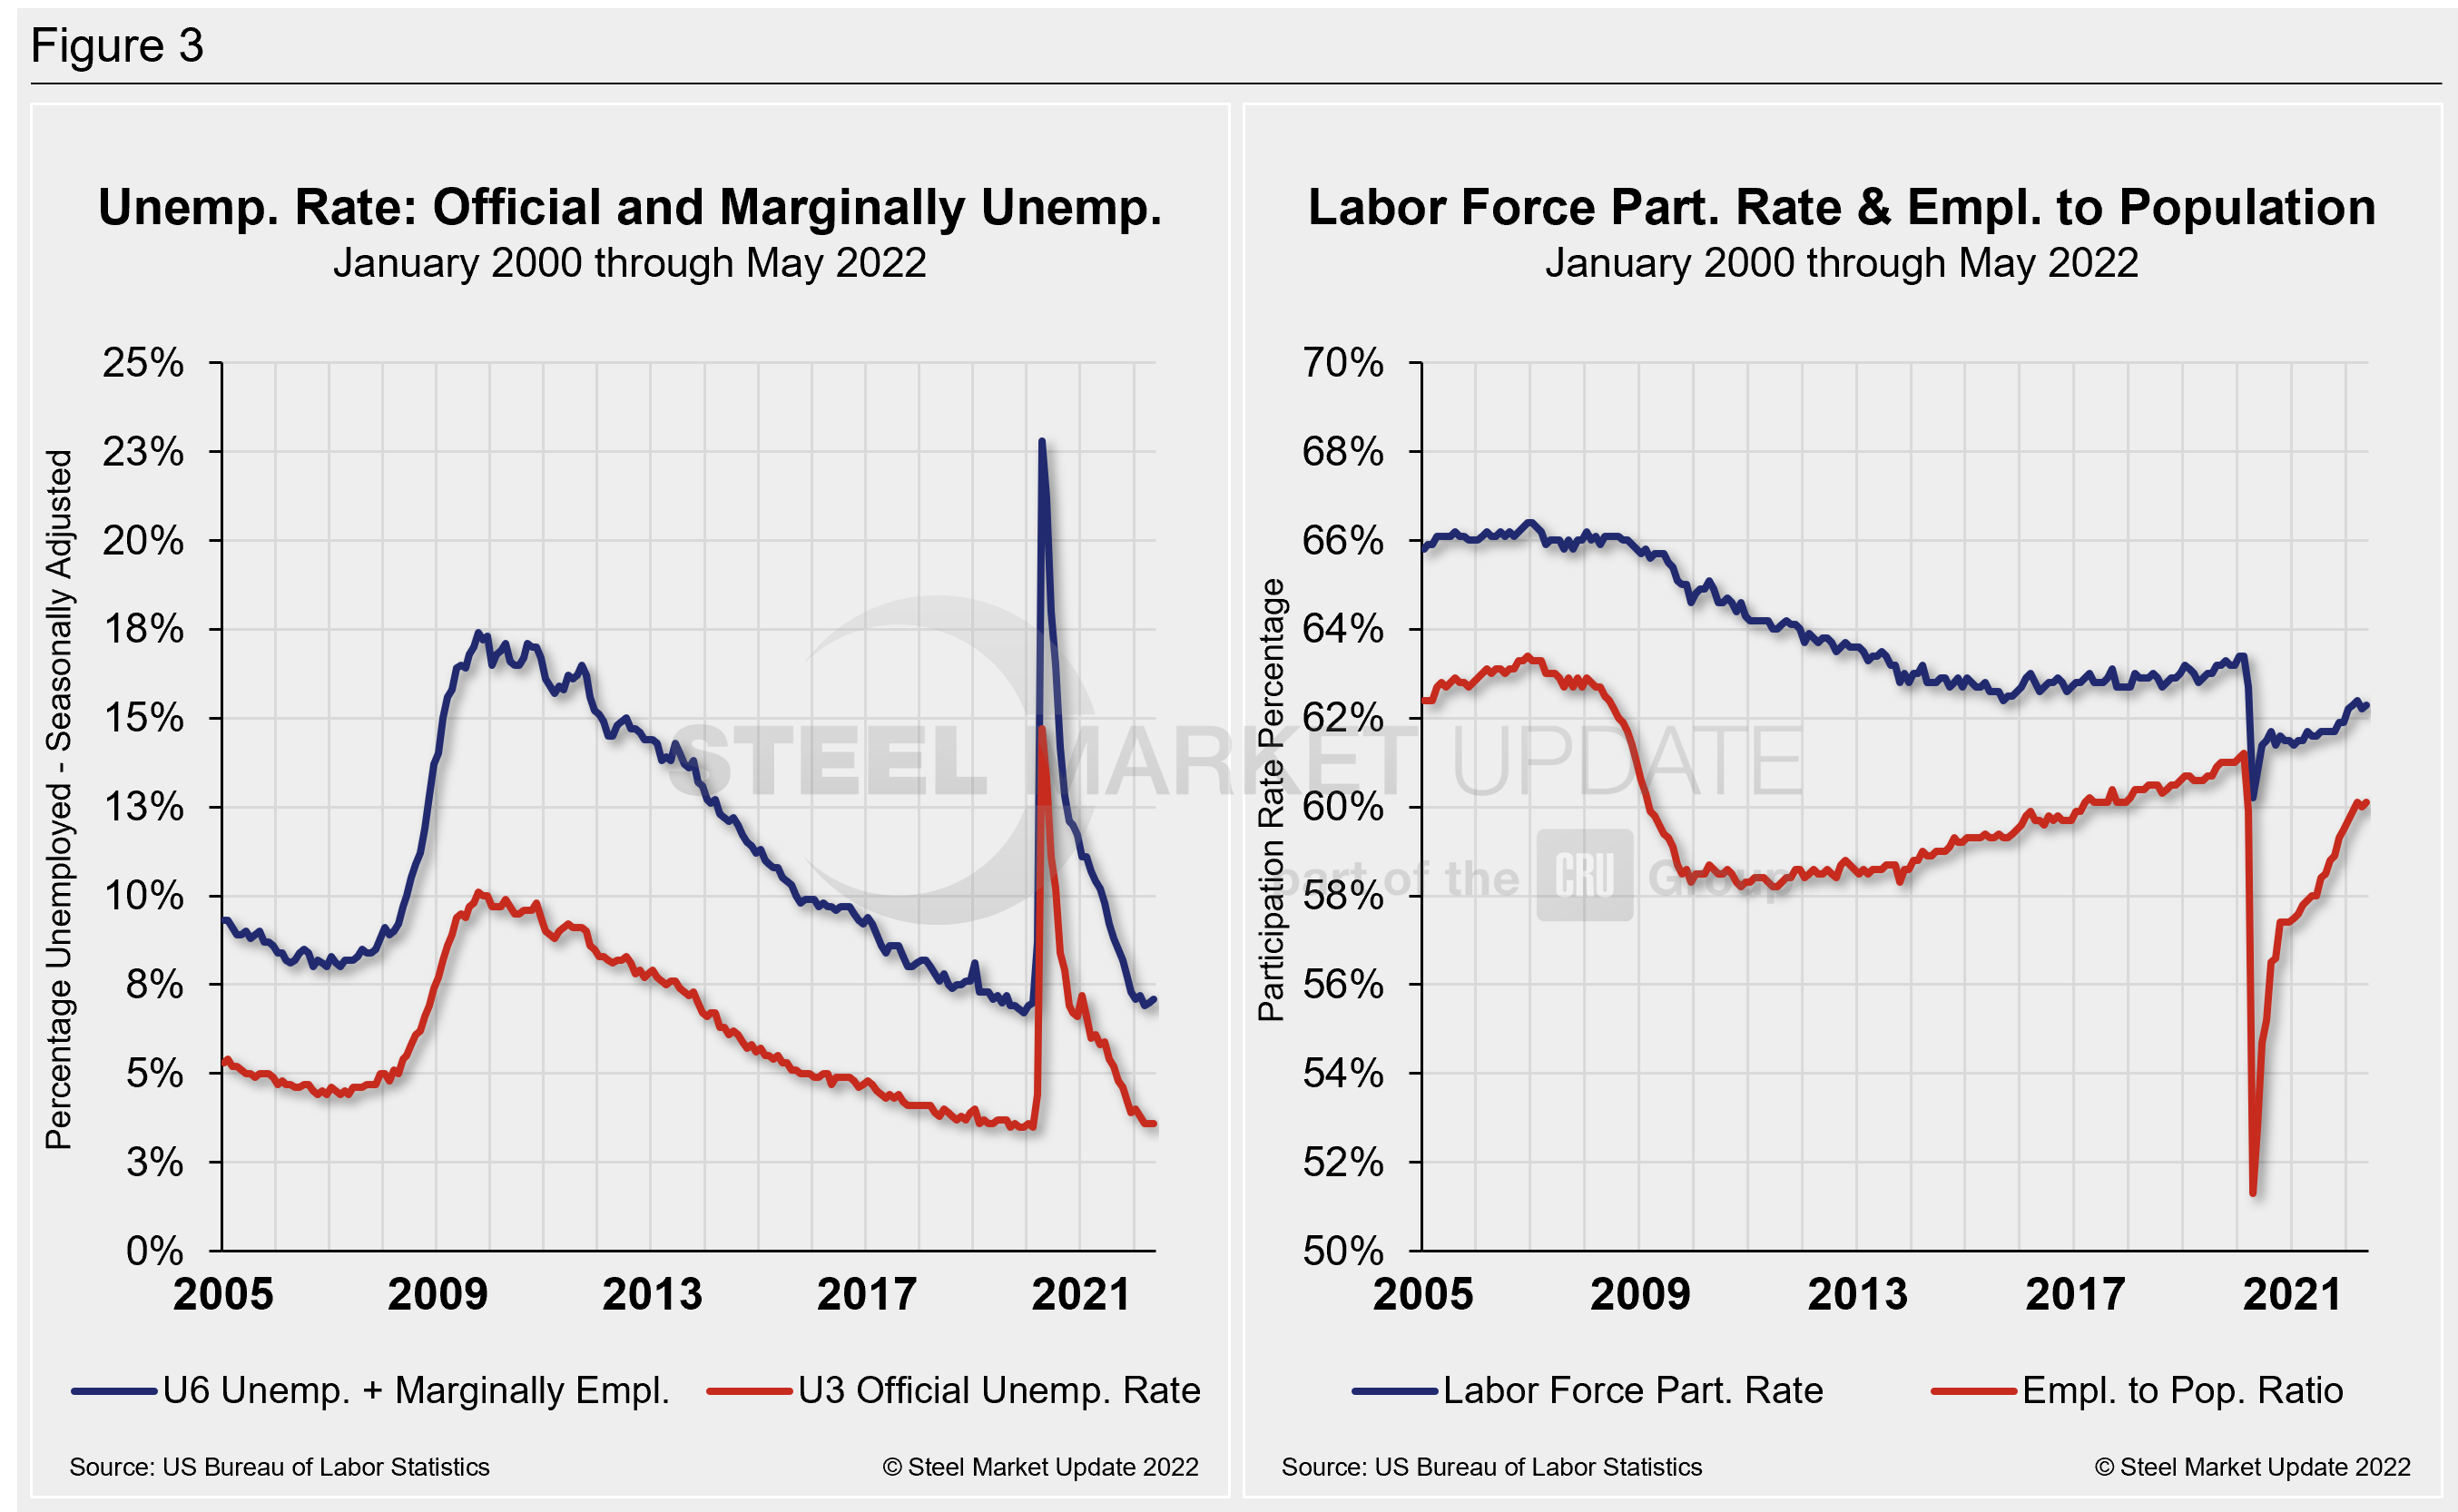
The official unemployment rate, U3, reported in the Bureau of Labor Statistics Household survey (see explanation below), increased from 3.5% in February 2020 to 14.7% in April 2020. Since April 2020, it has trended down despite some oscillations to start the year. Since February, the U3 rate has dipped to the lowest mark in two years at 3.6, where it has remained for three straight months since March. U6, a more encompassing measure of unemployment that includes discouraged workers and those holding part-time jobs for economic reasons, grew for the second consecutive month, reaching 7.1% in May.
Another gauge, and a more definitive view, are the number employed as a percentage of the population. Last month, the employment-to-population ratio was 60.1%, a marginal increase from 60.0% in April.
Figure 3 details side-by-side parallels of the unemployment rate (both the U3 and U6 rates) since 2005 as well as the labor force participation rate and employment to population ratio over the same period.
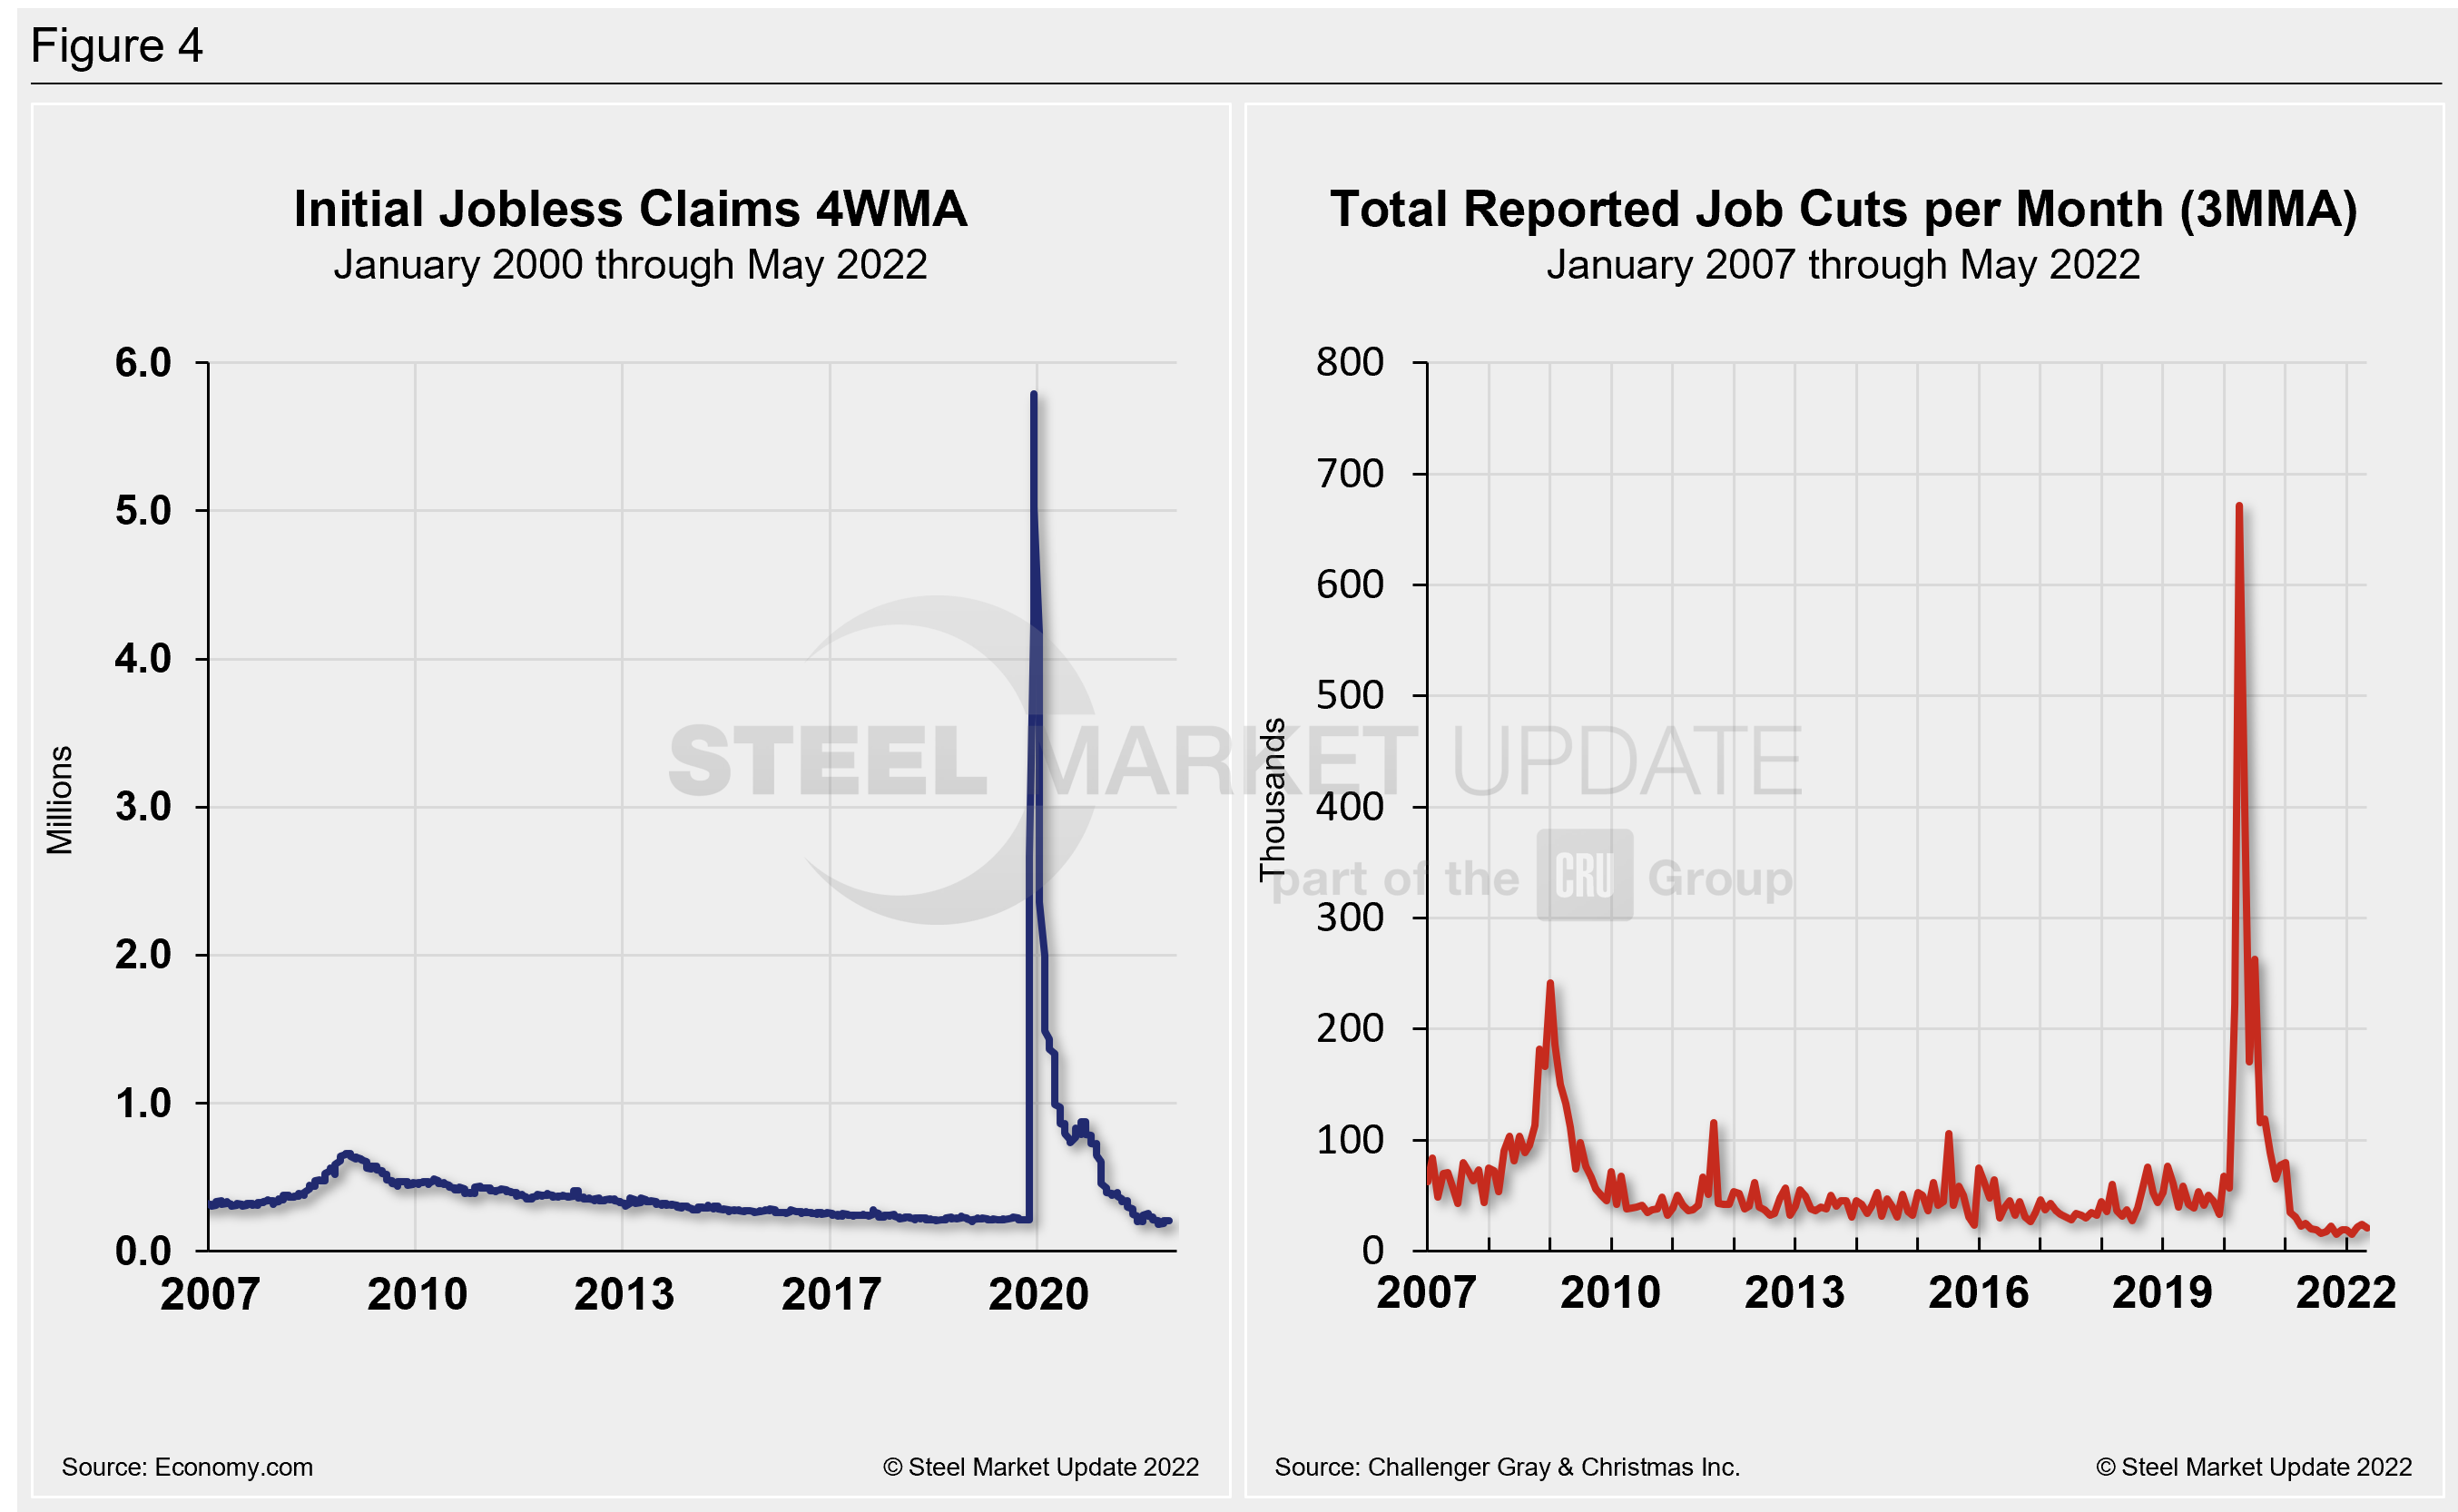
Initial claims for unemployment insurance, which are reported weekly by the Department of Labor, fell by 11,000 to 200,000 in the week ended June 4, following an 8,000 decrease the week prior.
“Layoffs are still extremely low, as businesses are reluctant to let go of workers because of the difficulty in filling open positions. Continuing claims for unemployment insurance benefits dropped by 34,000 to 1.309 million in the week ended May 21 while the insured unemployment rate fell from 1% to 0.9%,” Economy.com reported.
Human resources consulting firm Challenger, Gray and Christmas Inc. produces a monthly employment update for the US. It reported that job cuts in April totaled 20,712 down 14.7% from 24,286 announced the prior month. May’s total is 15.8% lower than the same year-ago period when 24.586 cuts were announced.
Year to date, employers announced 100,694 cuts, down 48% from the 192,185 cuts announced through the same period in 2021. It is the lowest January to May total since Challenger began tracking job cuts in 1993.
Despite the drop in job cuts, of the 30 industries Challenger tracks, four saw more job cuts announced in May than in the previous four months of the year combined; technology (-4,044), fintech (-2,059), construction (-817), and automotive (-2,918).
US employers announced 612,686 hiring plans year-to-date, up 39% from the 441,696 hiring plans over the same period last year. It is the second-highest January to May hiring total since Challenger began tracking hiring plans in 2006. The record occurred in 2020, when 1,260,661 hiring plans were announced in the first five months of the year.
Figure 4 shows the four-week moving average of new claims since January 2005, seasonally adjusted. It also shows the total reported job cuts per month, according to Challenger, on a three-month moving average.
Explanation: On the first Friday of each month, the Bureau of Labor Statistics releases the employment data for the previous month. Data is available at www.bls.gov. The BLS reports on the results of two surveys. The Establishment survey reports the actual number employed by industry. The Household survey reports on the unemployment rate, participation rate, earnings, average workweek, the breakout into full-time and part-time workers and lots more details describing the age breakdown of the unemployed, reasons for and duration of unemployment.
By David Schollaert, David@SteelMarketUpdate.com


