

Market Data

June 23, 2022
May ABI Still Growing for Design Services, But Pace Slows
Written by David Schollaert
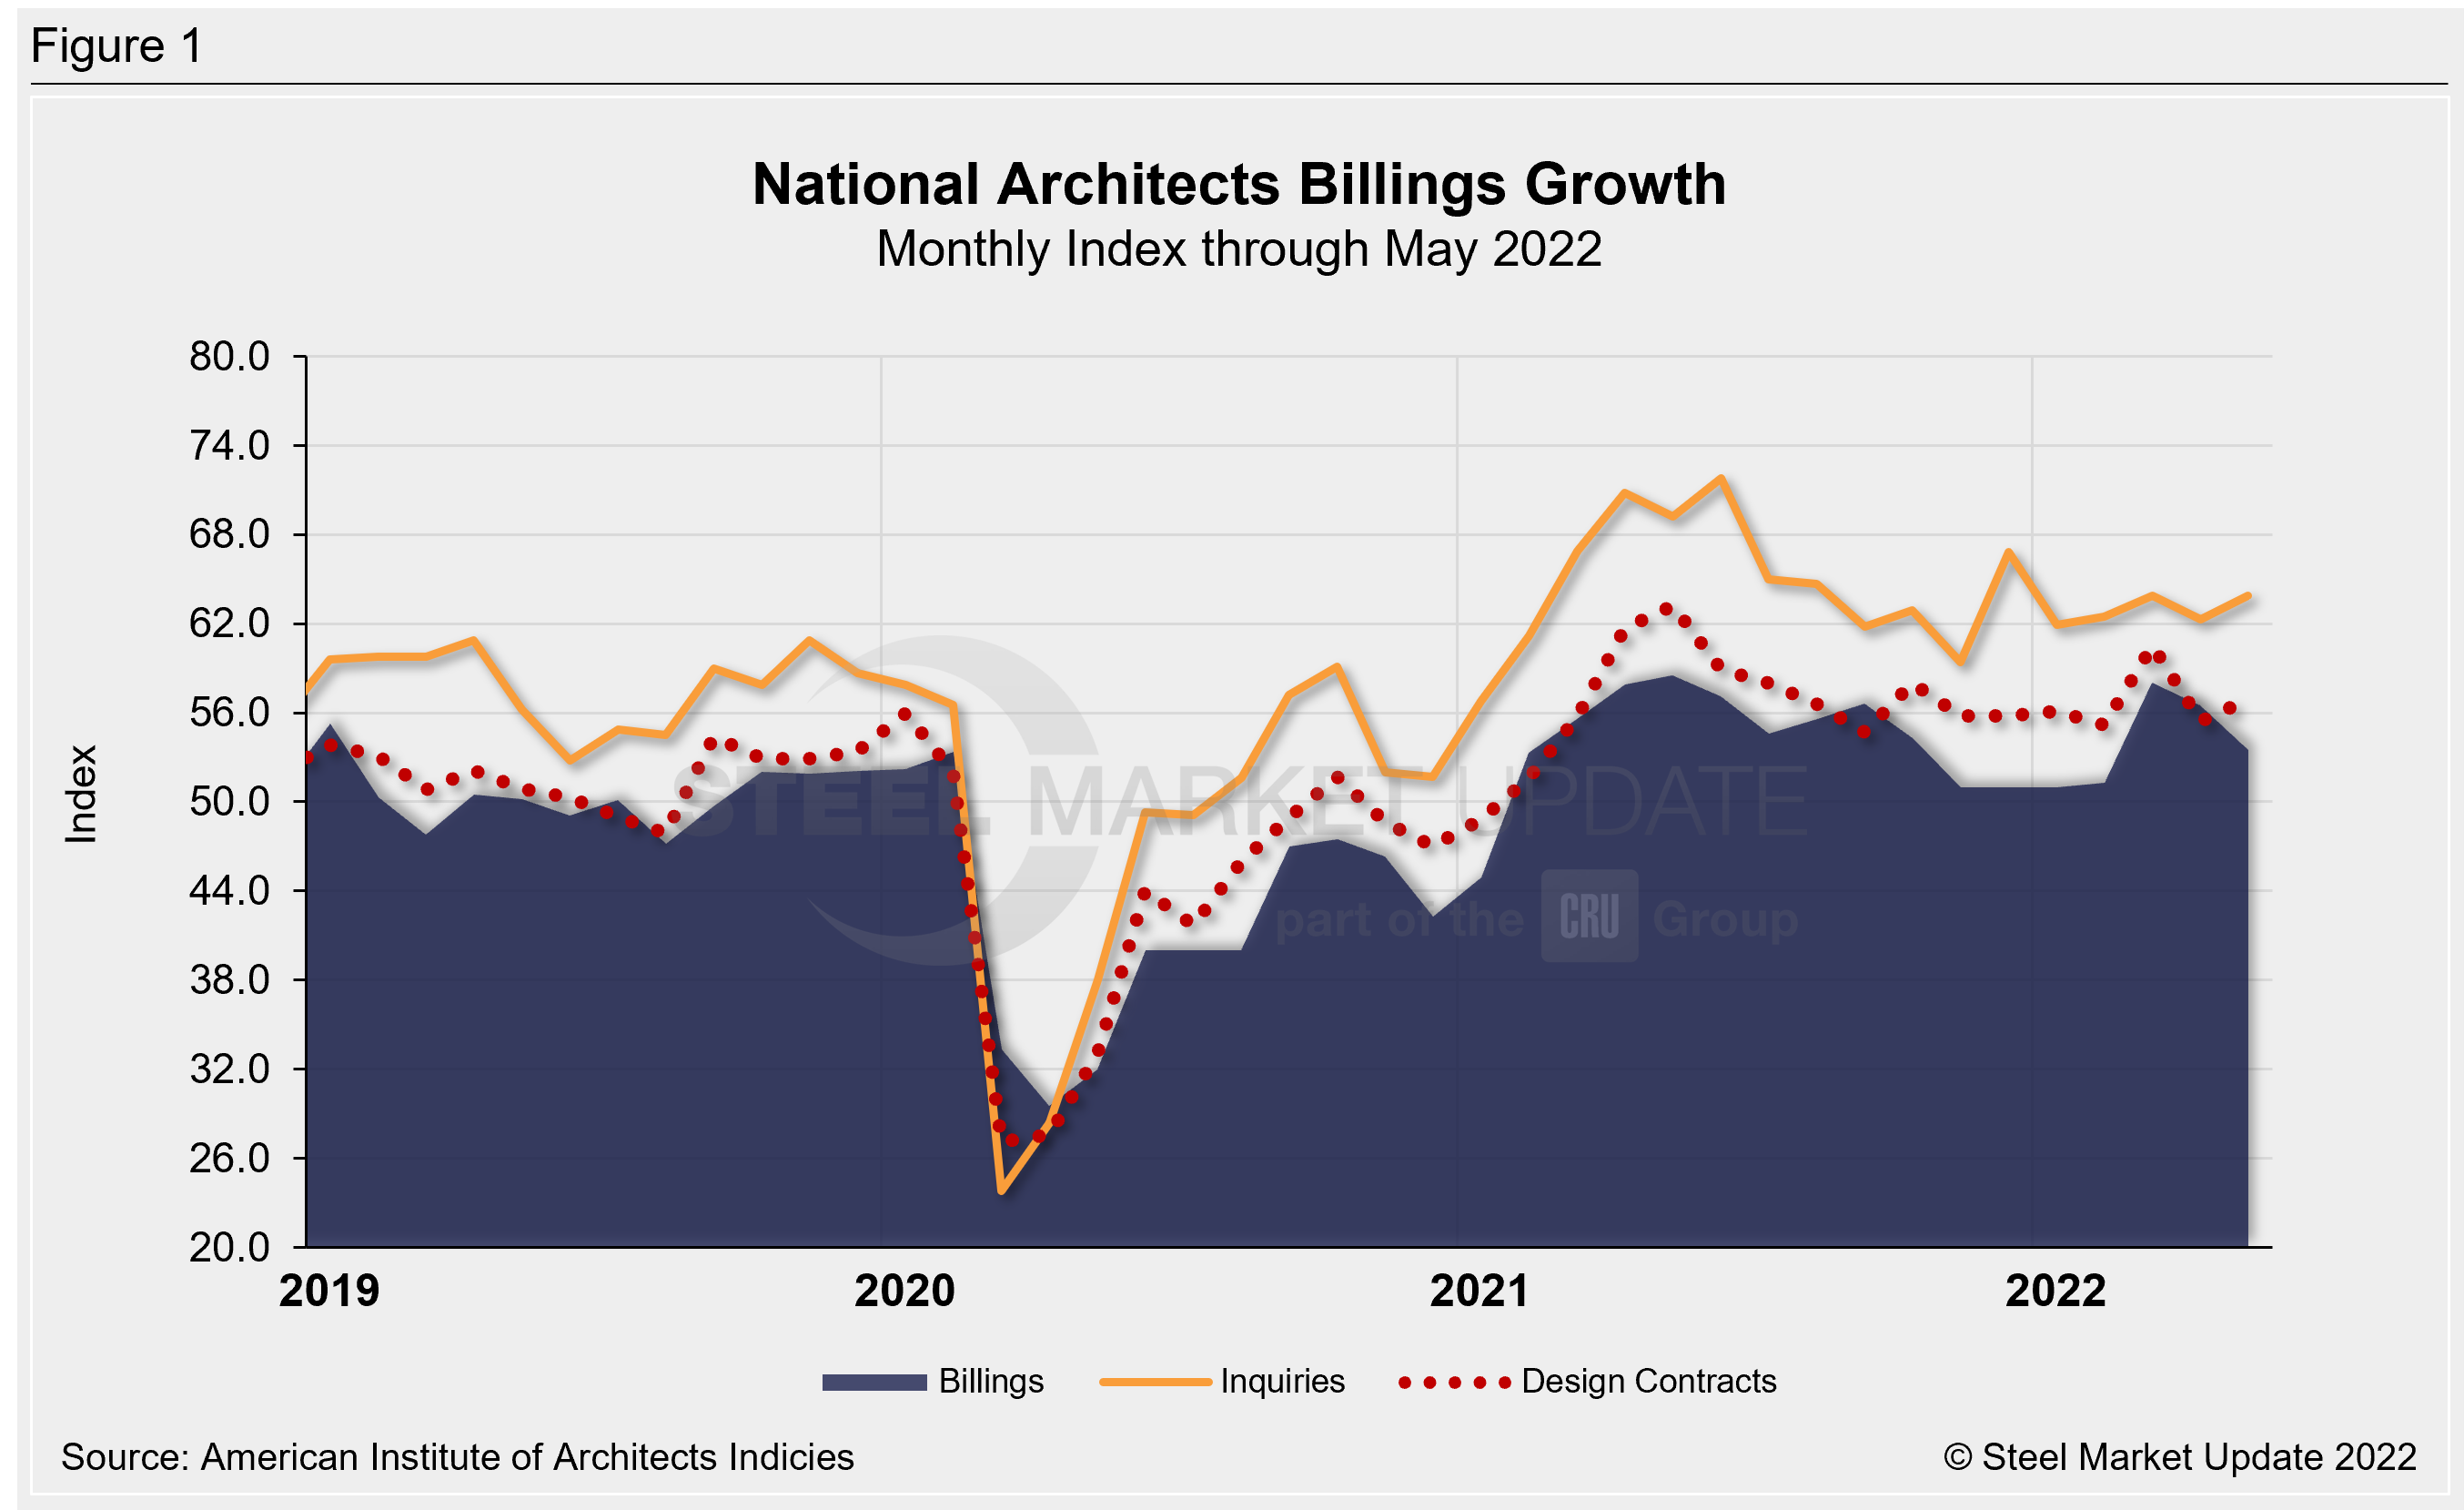
Demand for design services from architecture firms in the US continued to expand in May, though the score was down three points month-on-month (MoM). May marked the 16th consecutive month of growth following the pandemic-induced downturn in 2020.
The May AIA Architecture Billings Index registered 53.5, down slightly from April’s score of 56.5, according to the latest report from the American Institute of Architects. The ABI is an advanced economic indicator for nonresidential construction activity with a lead time of 9-12 months. A score above 50 indicates an increase in activity, and a score below 50 indicates a decrease.
Most architecture firms reported strong business conditions, despite increasing headwinds in the economy, the report said. Indicators of future work remained firm, driven by the value of new design contracts and extended backlogs.
Both design contracts and new project inquiries expanded in May. New project inquiries posted a score of 63.9, rising 1.6 points from April’s score of 62.3. Design contracts came in at 56.9 points, increasing 1.5 points from April’s score of 55.4.
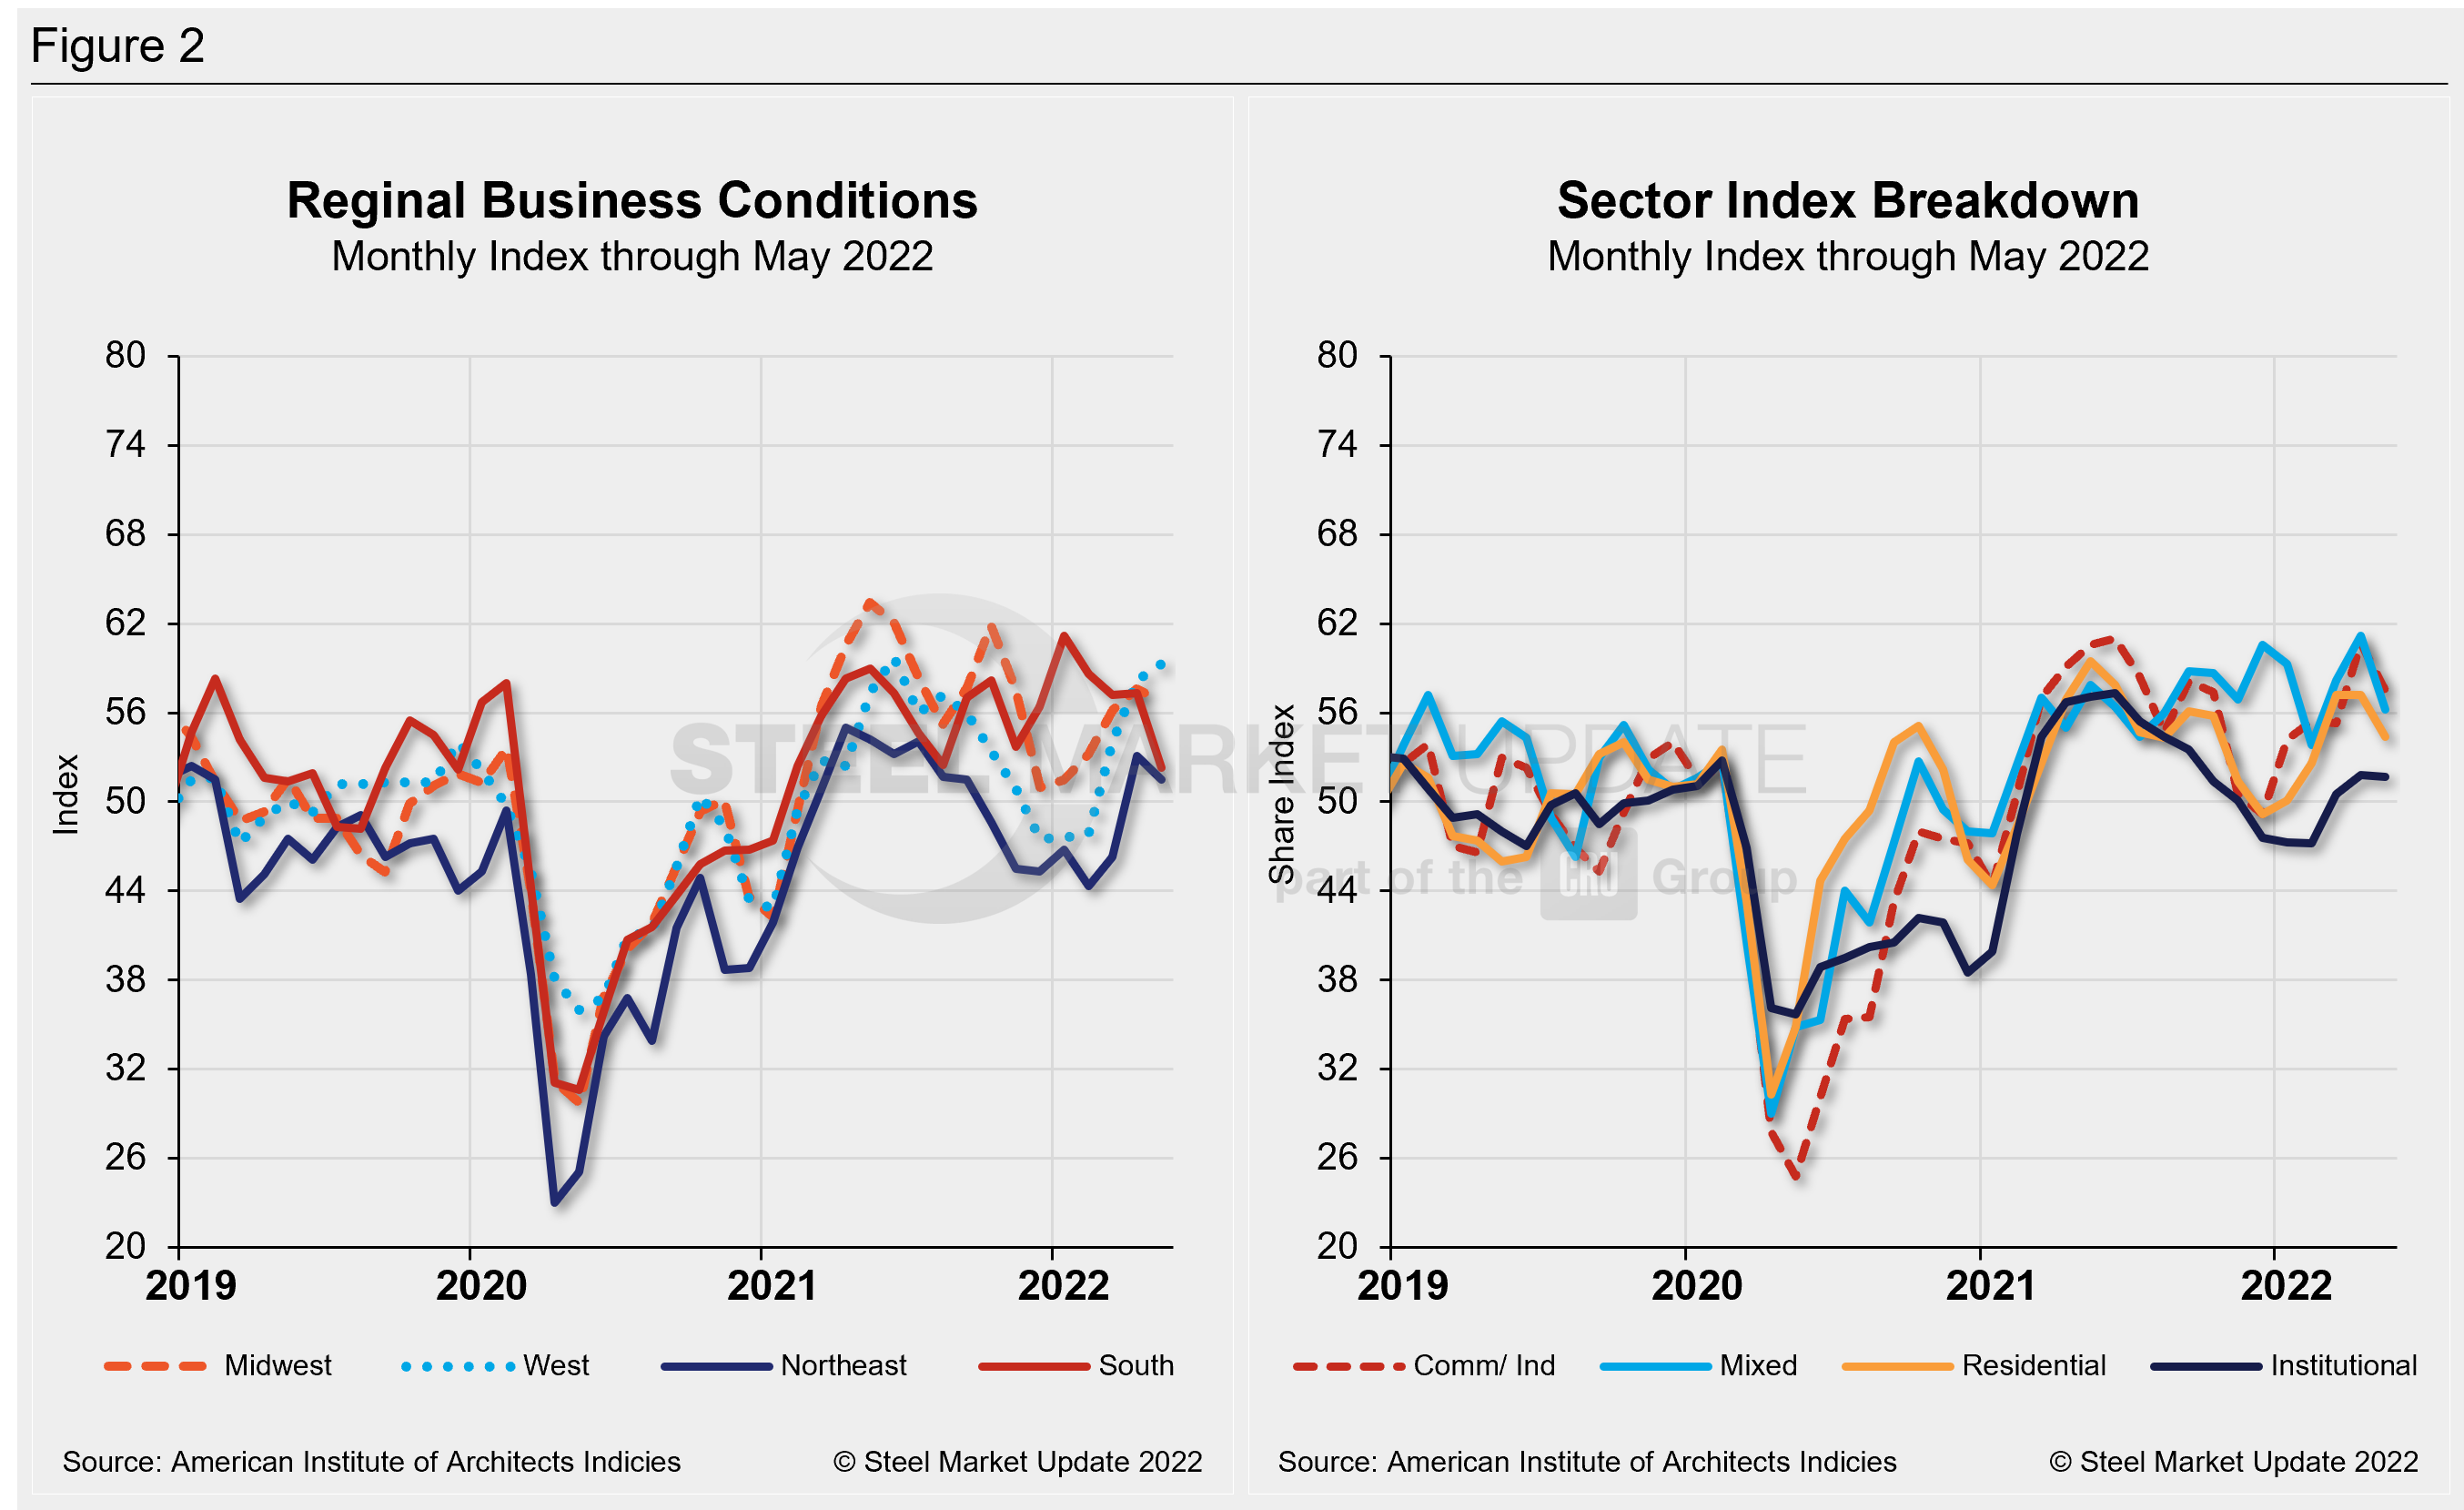
The MoM changes in scores for regional billings – which, unlike the national score, are calculated as three-month moving averages (3MMA) – moderated in May (Figure 2). Only one regional billing score gained ground, but all four remained above 50.0. Billings in the Midwest decreased 0.8 points, while billings in the West rose 1.1 points. Billings in the South fell 5 points, and billings in the Northeast decreased 2.3 points in May.
All four of May’s sector billings scores remained above 50.0 while decreasing from their April values. The commercial/industrial sector fell by 3 points and the institutional sector decreased by 0.1 points. The multifamily residential score fell 2.5 points while the mixed-practice sector decreased 5 points. Like the regional billings scores, sector billings scores are also calculated as 3MMA and are displayed in Figure 2.
“The strength in design activity over the past three months has produced a broader base of gains. The Northeast region and institutional sector have struggled with slow billings activity, but now have posted consecutive months of positive scores,” AIA chief economist Kermit Baker said. “With the improvement in inquiries and new design projects, demand for design services will likely remain high for the next several months, despite strong economic headwinds.”
Key ABI highlights for May include:
- Regional averages: West (59.3); Midwest (56.8); South (52.3); Northeast (51.4)
- Sector index breakdown: commercial/industrial (57.7); mixed practice (56.2); multi-family residential (54.5); institutional (51.7)
Regional and sector scores are calculated as three-month averages. Below are three charts showing the history of the AIA Architecture Billings Index, Reginal Business Conditions, and Sectors.
An interactive history of the AIA Architecture Billings Index is available on our website. Please contact us at info@SteelMarketUpdate.com if you need assistance logging into or navigating the website.
By David Schollaert, David@SteelMarketUpdate.com


