

Analysis

July 8, 2022
CPIP Data: US Construction Spending Edges Down Unexpectedly
Written by David Schollaert
US construction spending in May totaled $1.780 trillion at a seasonally adjusted annual rate, 0.1% below April’s upwardly revised $1.783 trillion. This is the first drop since September 2021. The surprising decline month-on-month (MoM) came as a drop in public spending dragged on stalling single-family homebuilding, the Commerce Department reported.
The construction spending decline in May followed a 0.8% increase MoM after the April data was revised up from an initial estimate of 0.2%. The miss was a complete turn from an expected 0.3% advance in construction spending in May.
While MoM growth disappointed in May, year-on-year (YoY) gains were a bright spot. Construction spending in May was 9.7% higher YoY, while year-to-date, construction spending amounted to $686.9 billion, 11% above the $619.0 billion for the same period in 2021.
The Census Bureau’s report on construction shows spending on private construction was unchanged in May, as did spending on new single-family and multi-family homes. Private spending on nonresidential construction declined 0.4% MoM, while total public construction spending fell 0.8% MoM.
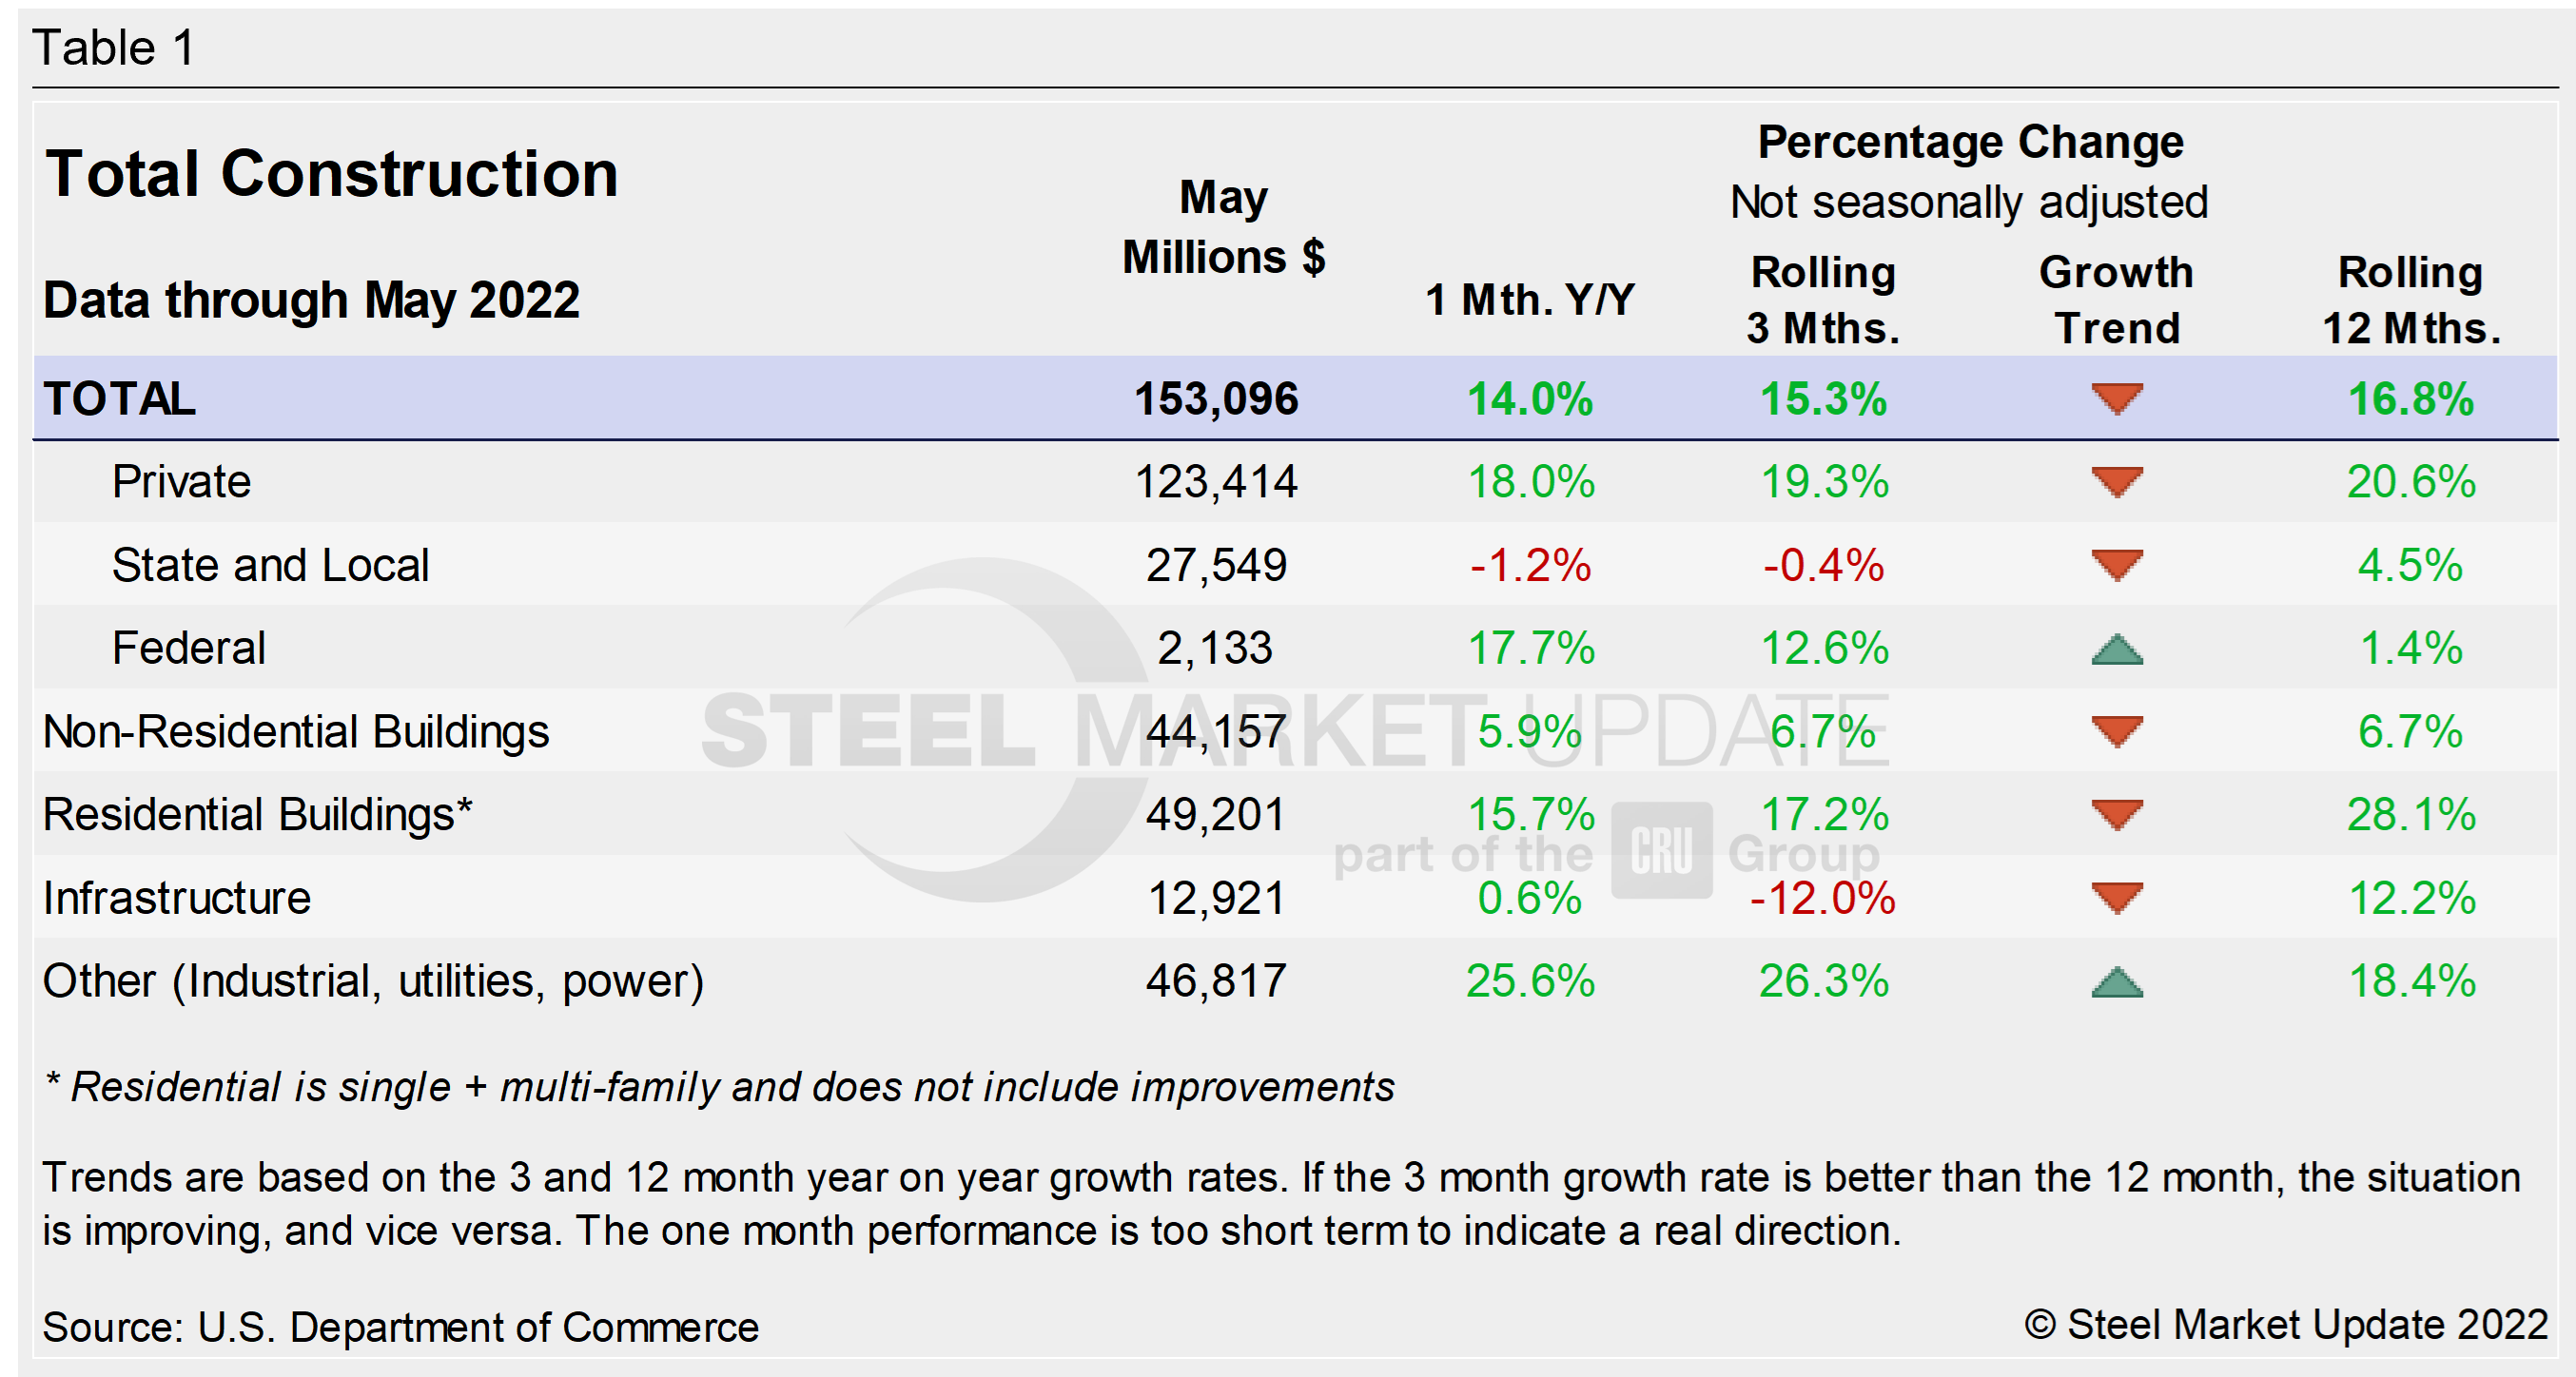
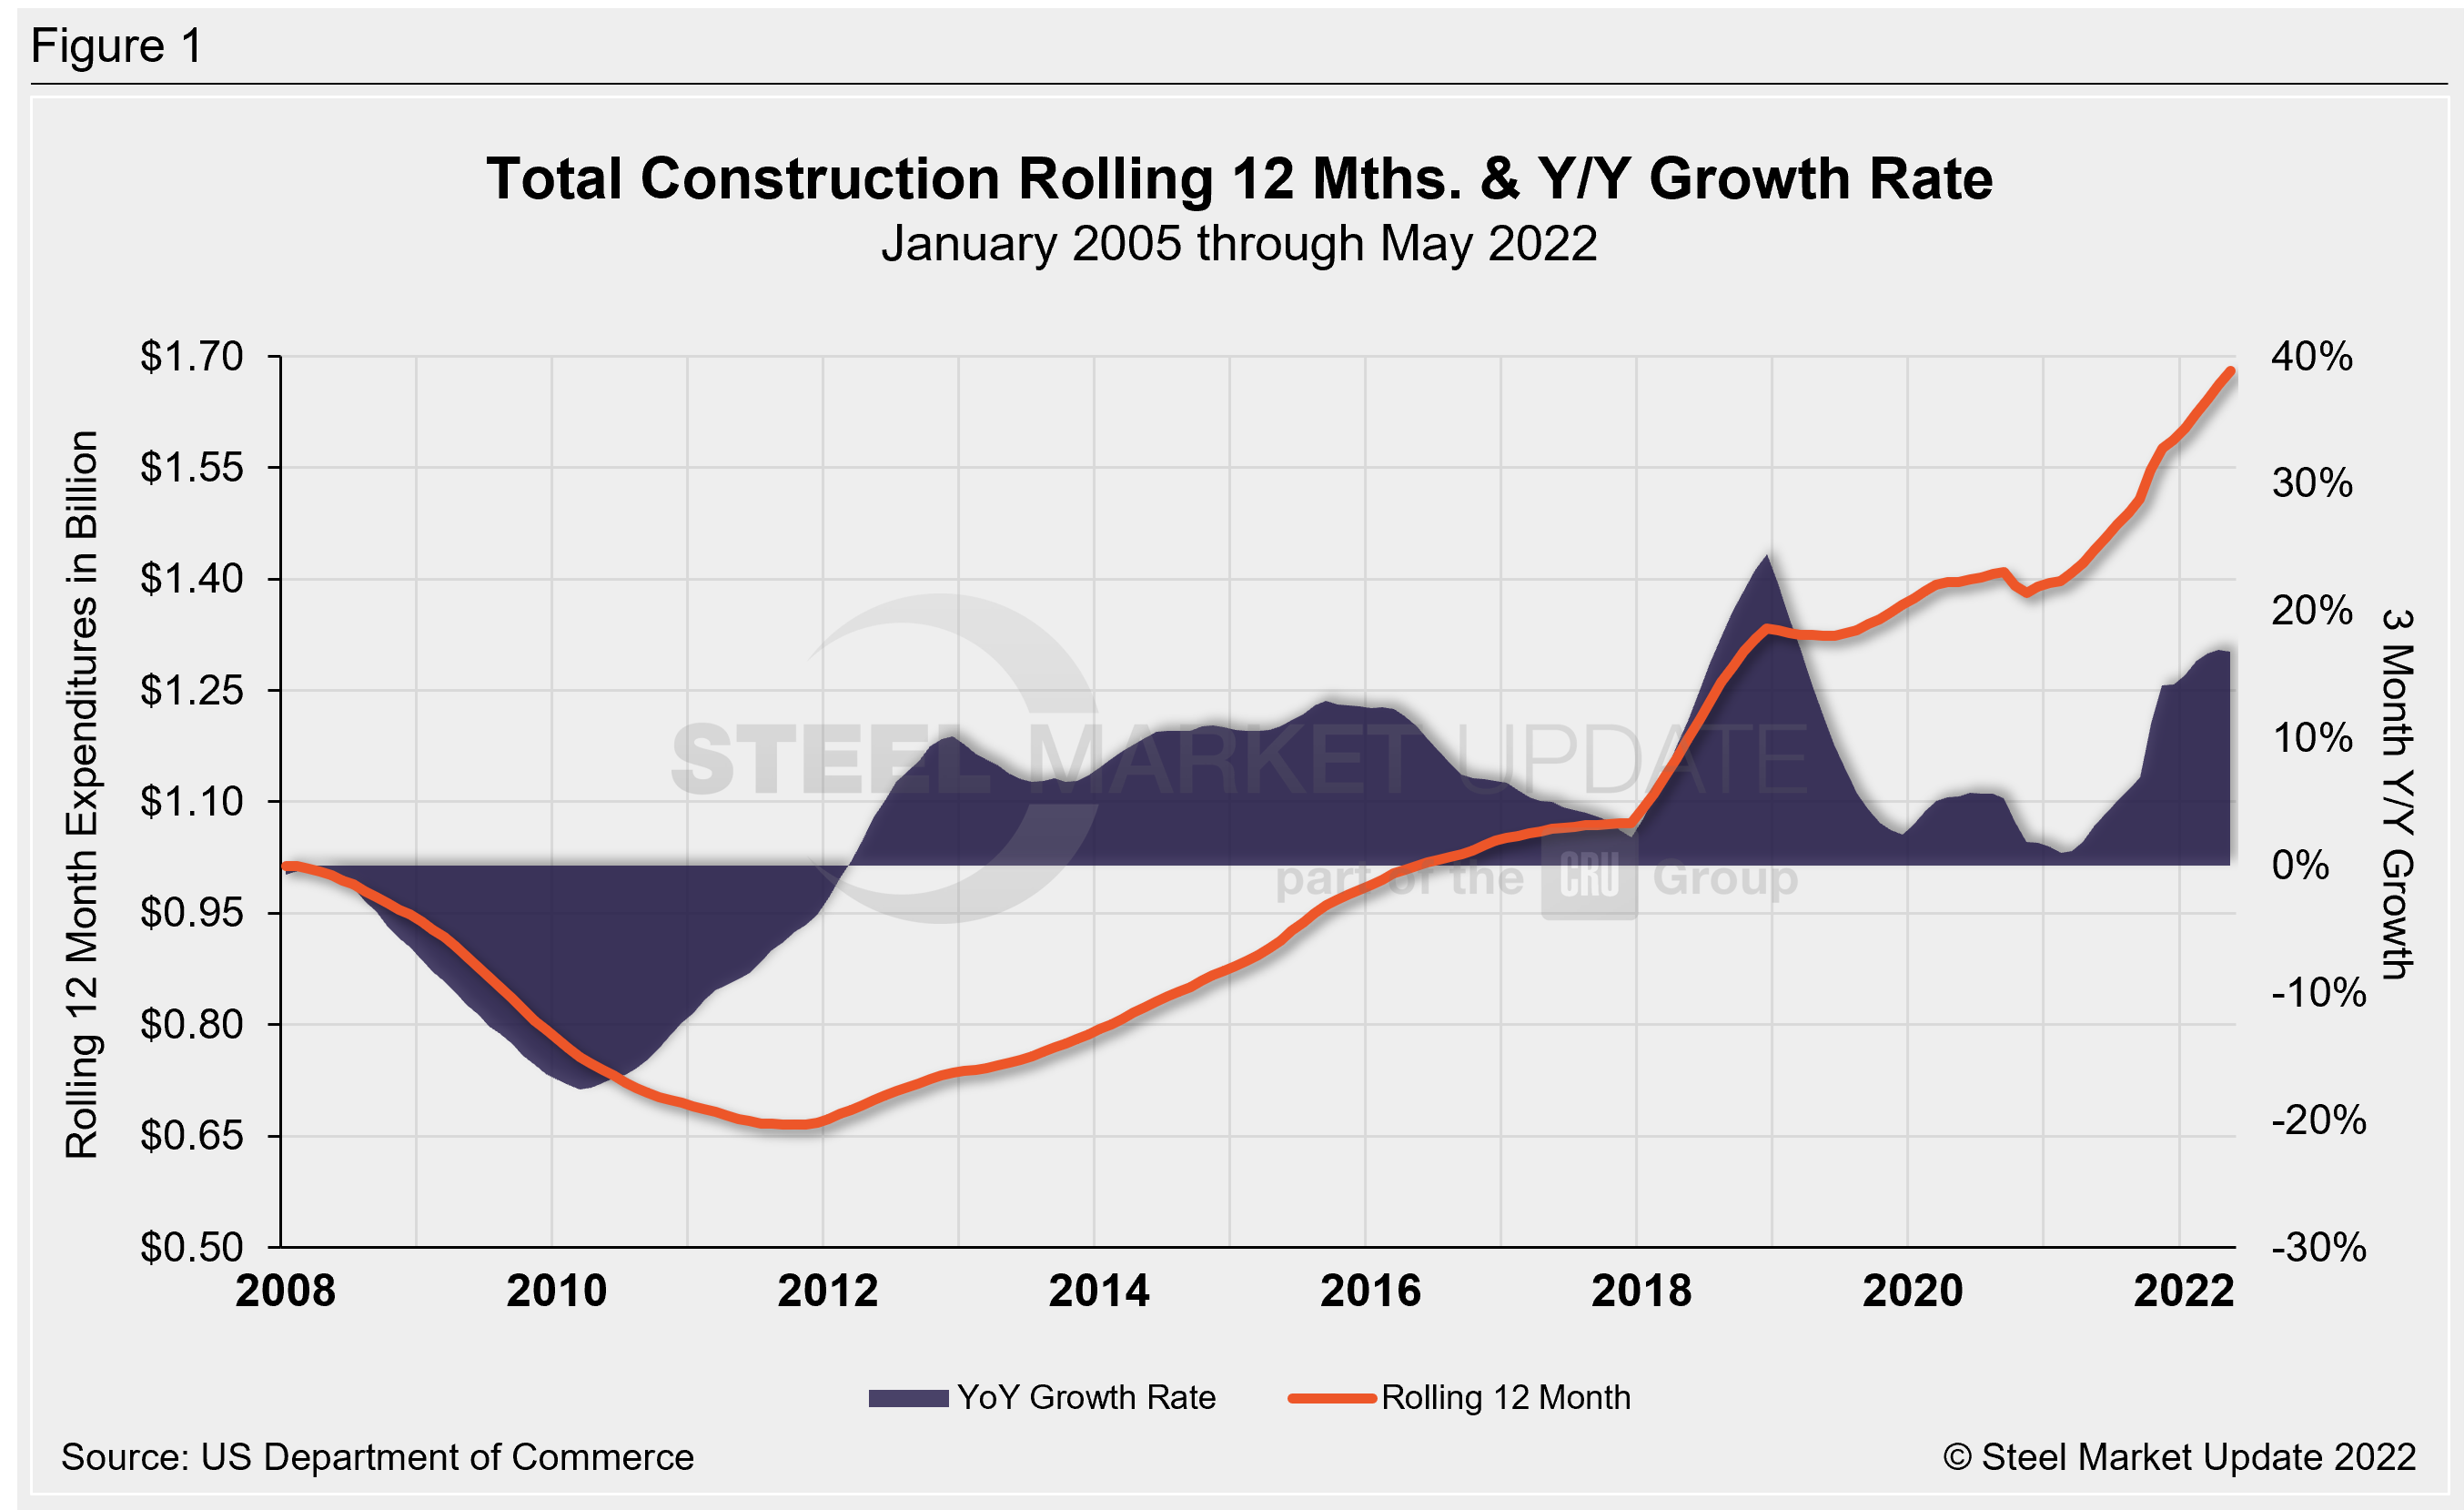
Total construction expenditures and their major categories are shown in Table 1 below. Figure 1 shows total construction and infrastructure expenditures. It details the YoY growth rate versus a rolling 12-month average.
Private Construction
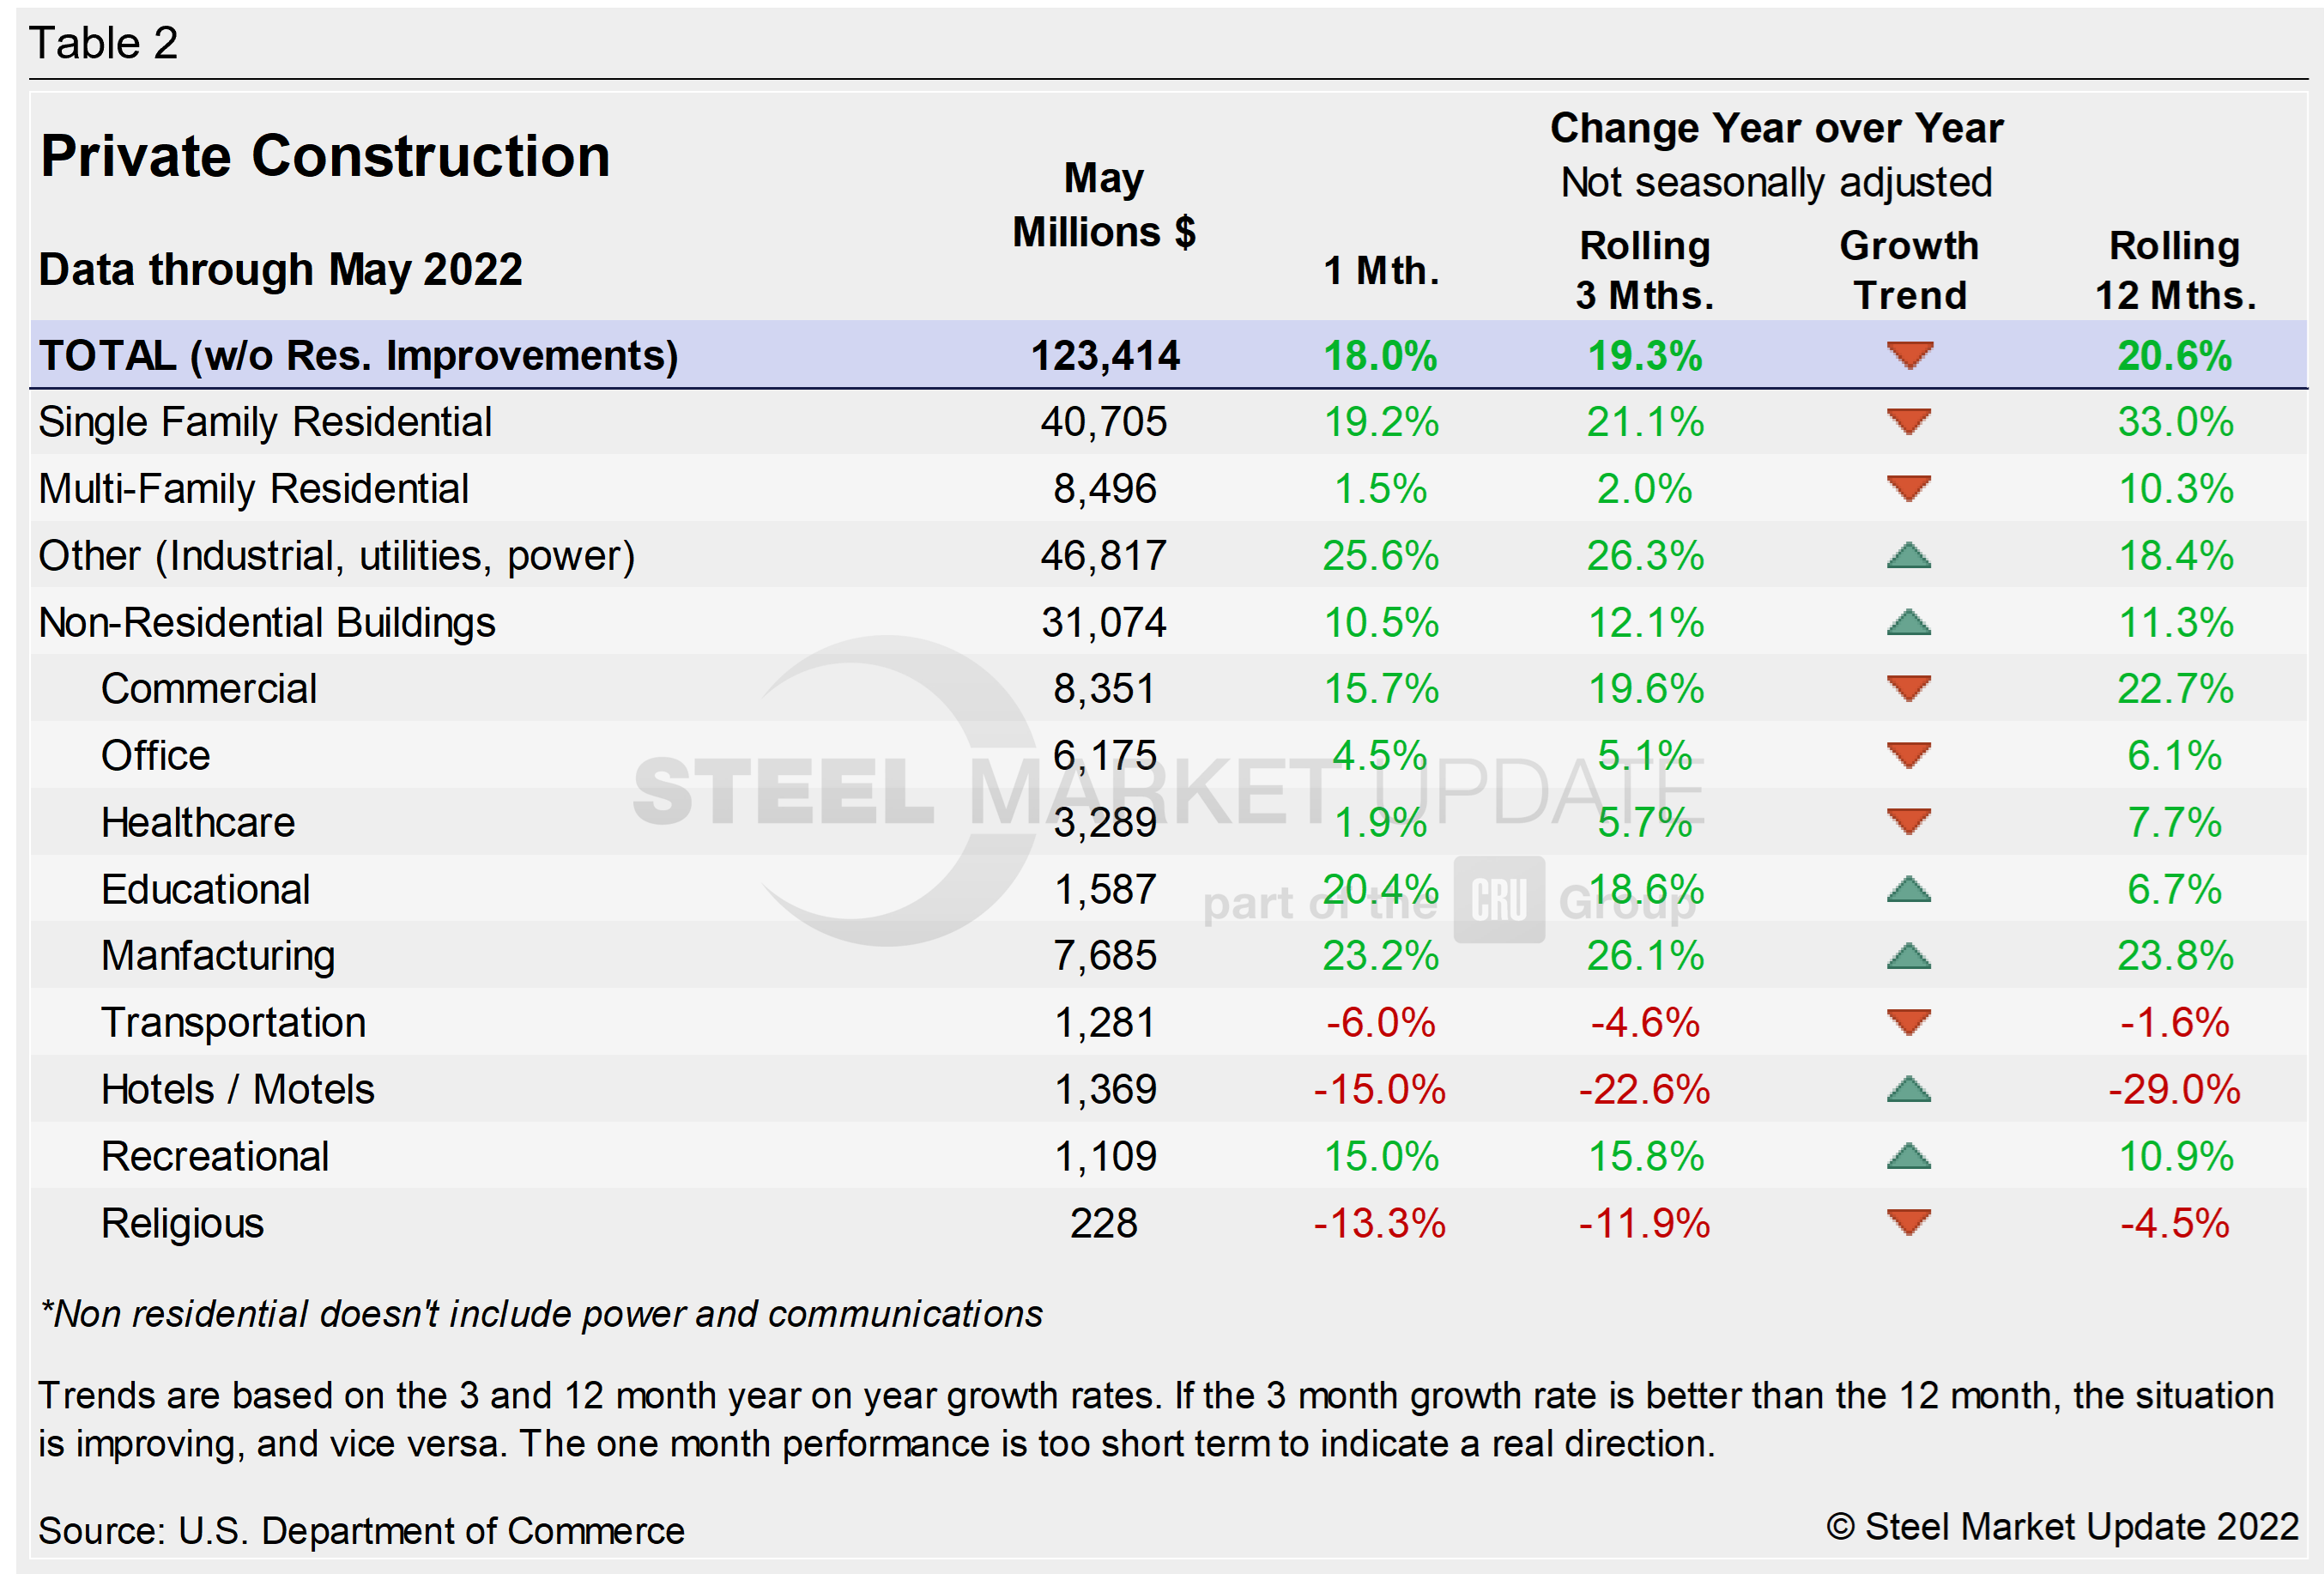
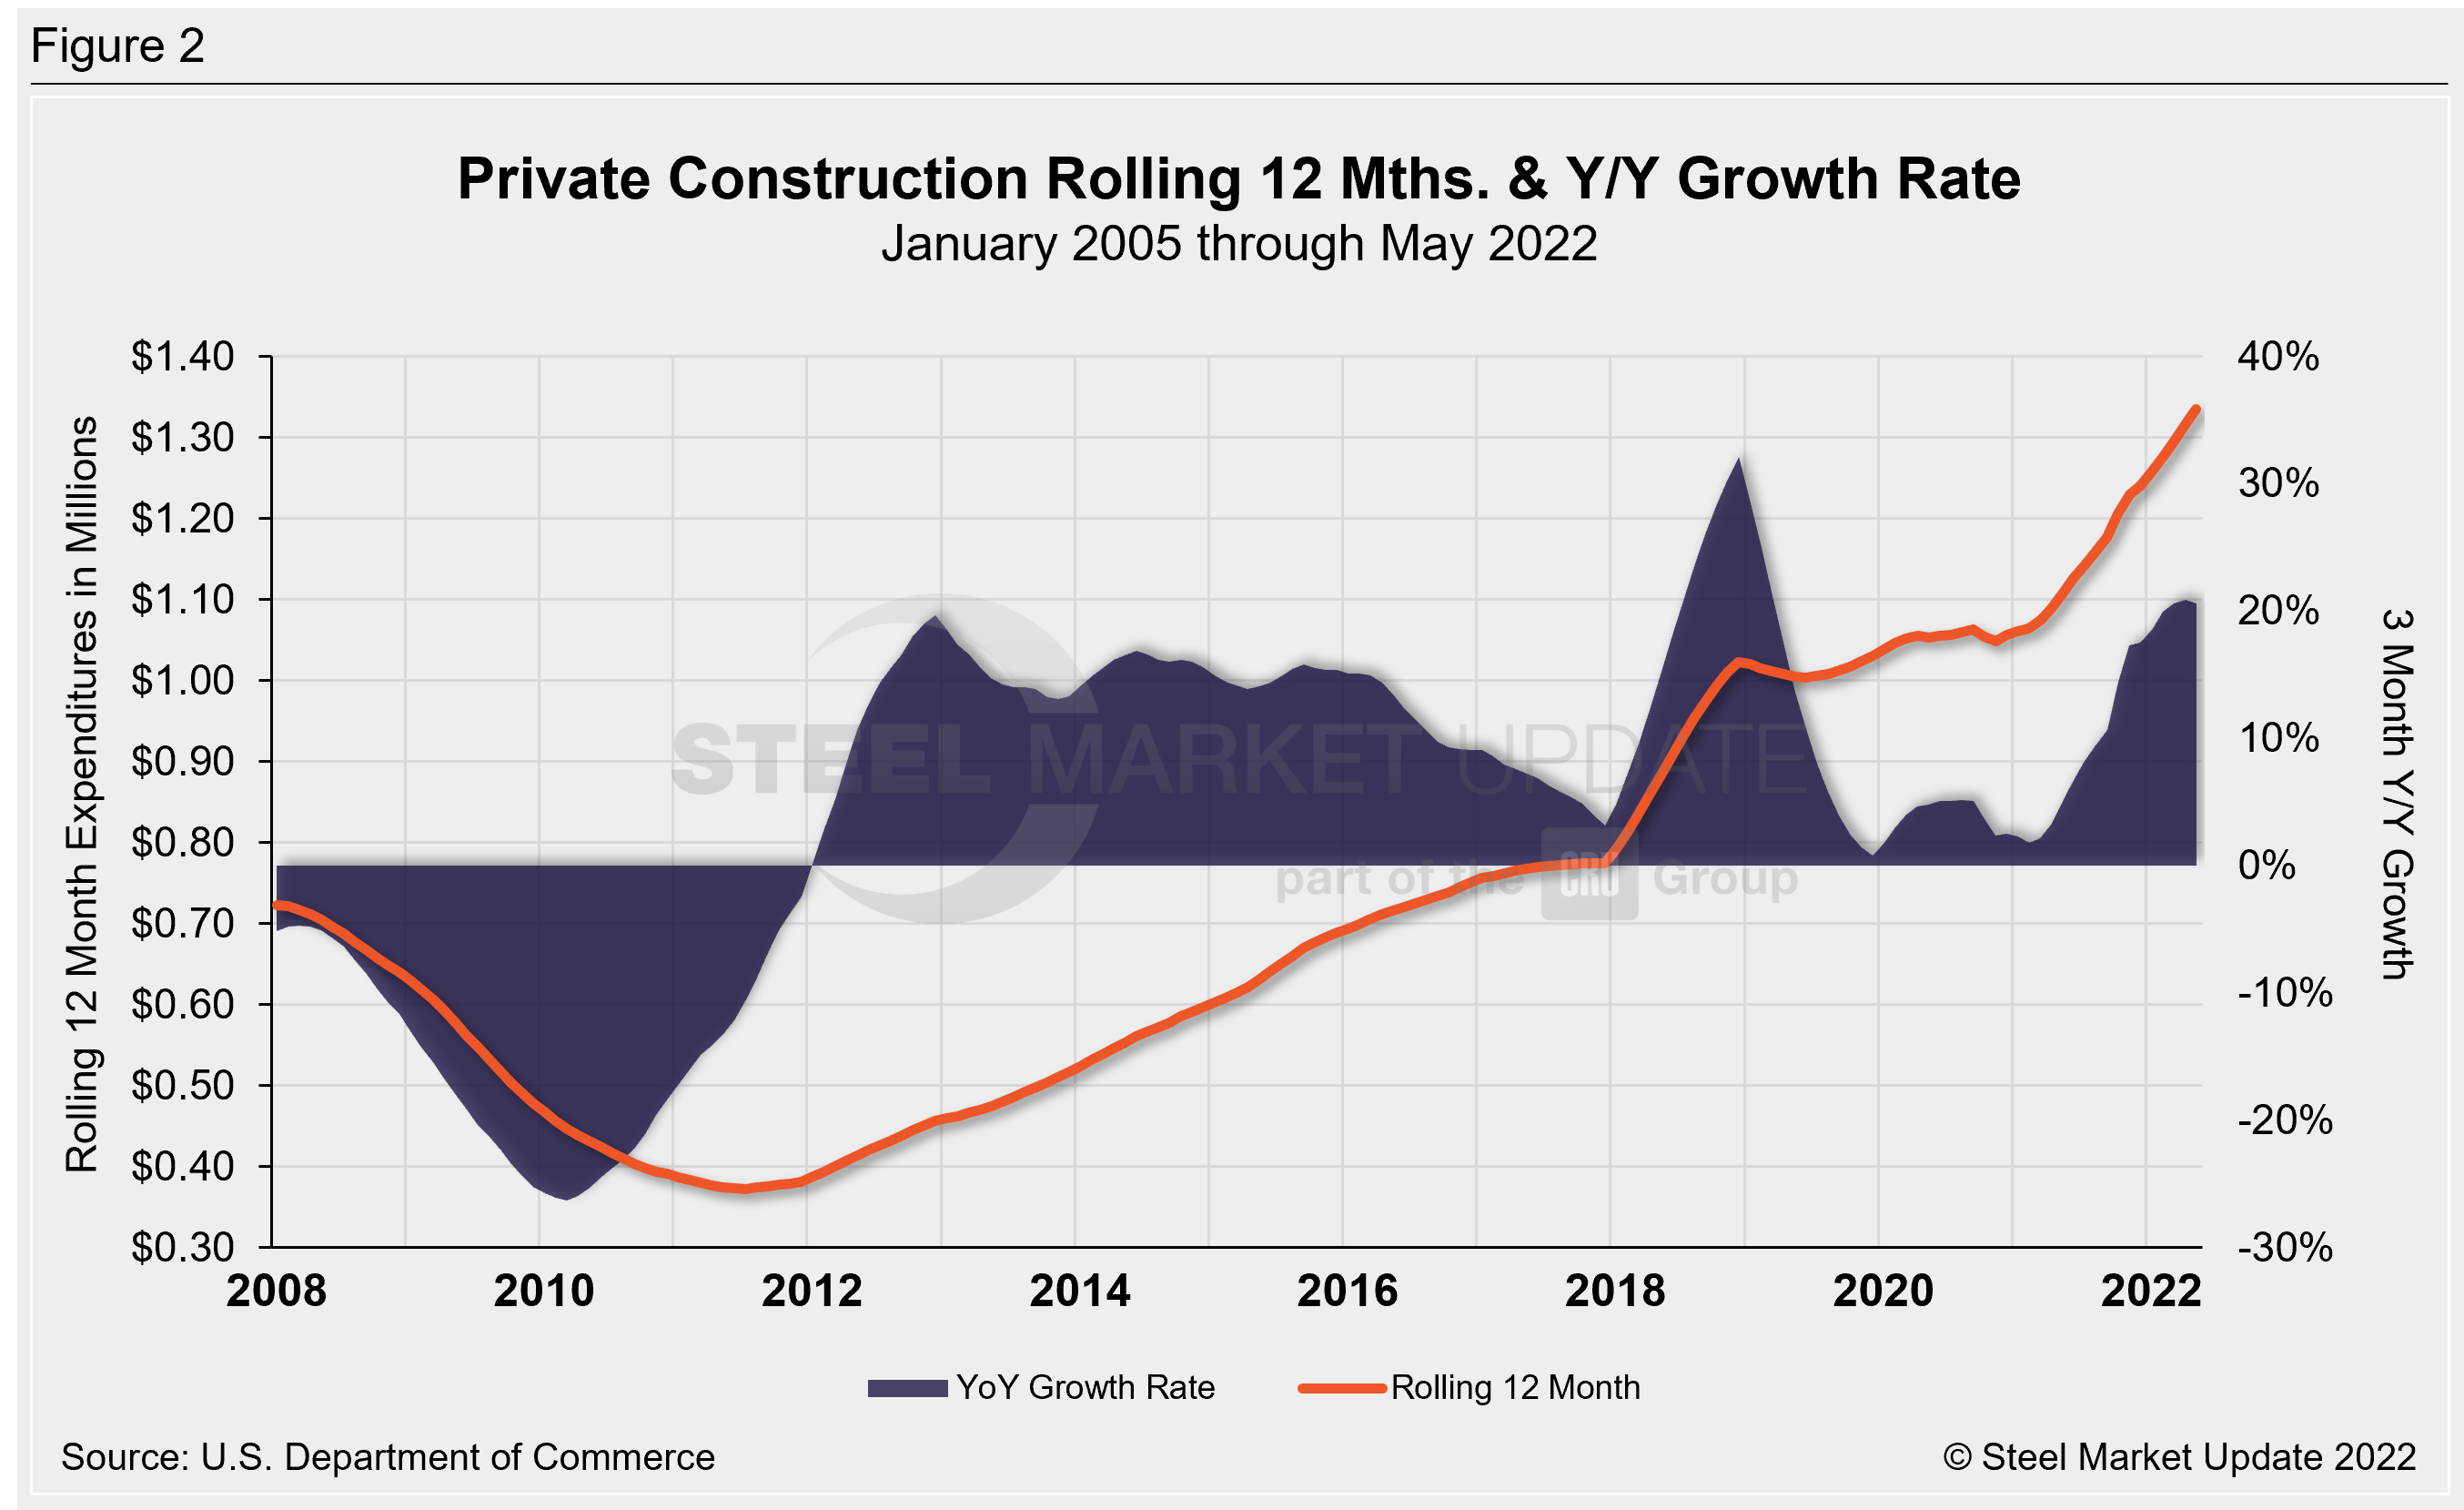
The breakdown of the $1.436 trillion private expenditures into residential and nonresidential, and their subsectors, are highlighted in Table 2 and Figure 2 below. Construction put in place in the private sector in May was virtually unchanged from April’s revised estimate of $1.436 trillion.
Within that category, residential construction was at a seasonally adjusted annual rate of $938.2 billion in May, 0.2% above the revised April estimate of $935.9 billion. Nonresidential construction was at a seasonally adjusted annual rate of $497.8 billion in May, 0.4% below the revised April estimate of $499.9 billion.
Spending was down MoM in 10 of the 16 nonresidential subcategories. Private nonresidential spending was down 0.4%, while public nonresidential construction spending was down 0.8% in May.
Nonresidential construction spending is up 1% over the past year. Manufacturing saw the largest YoY gain, with construction spending increasing by 26.3%.
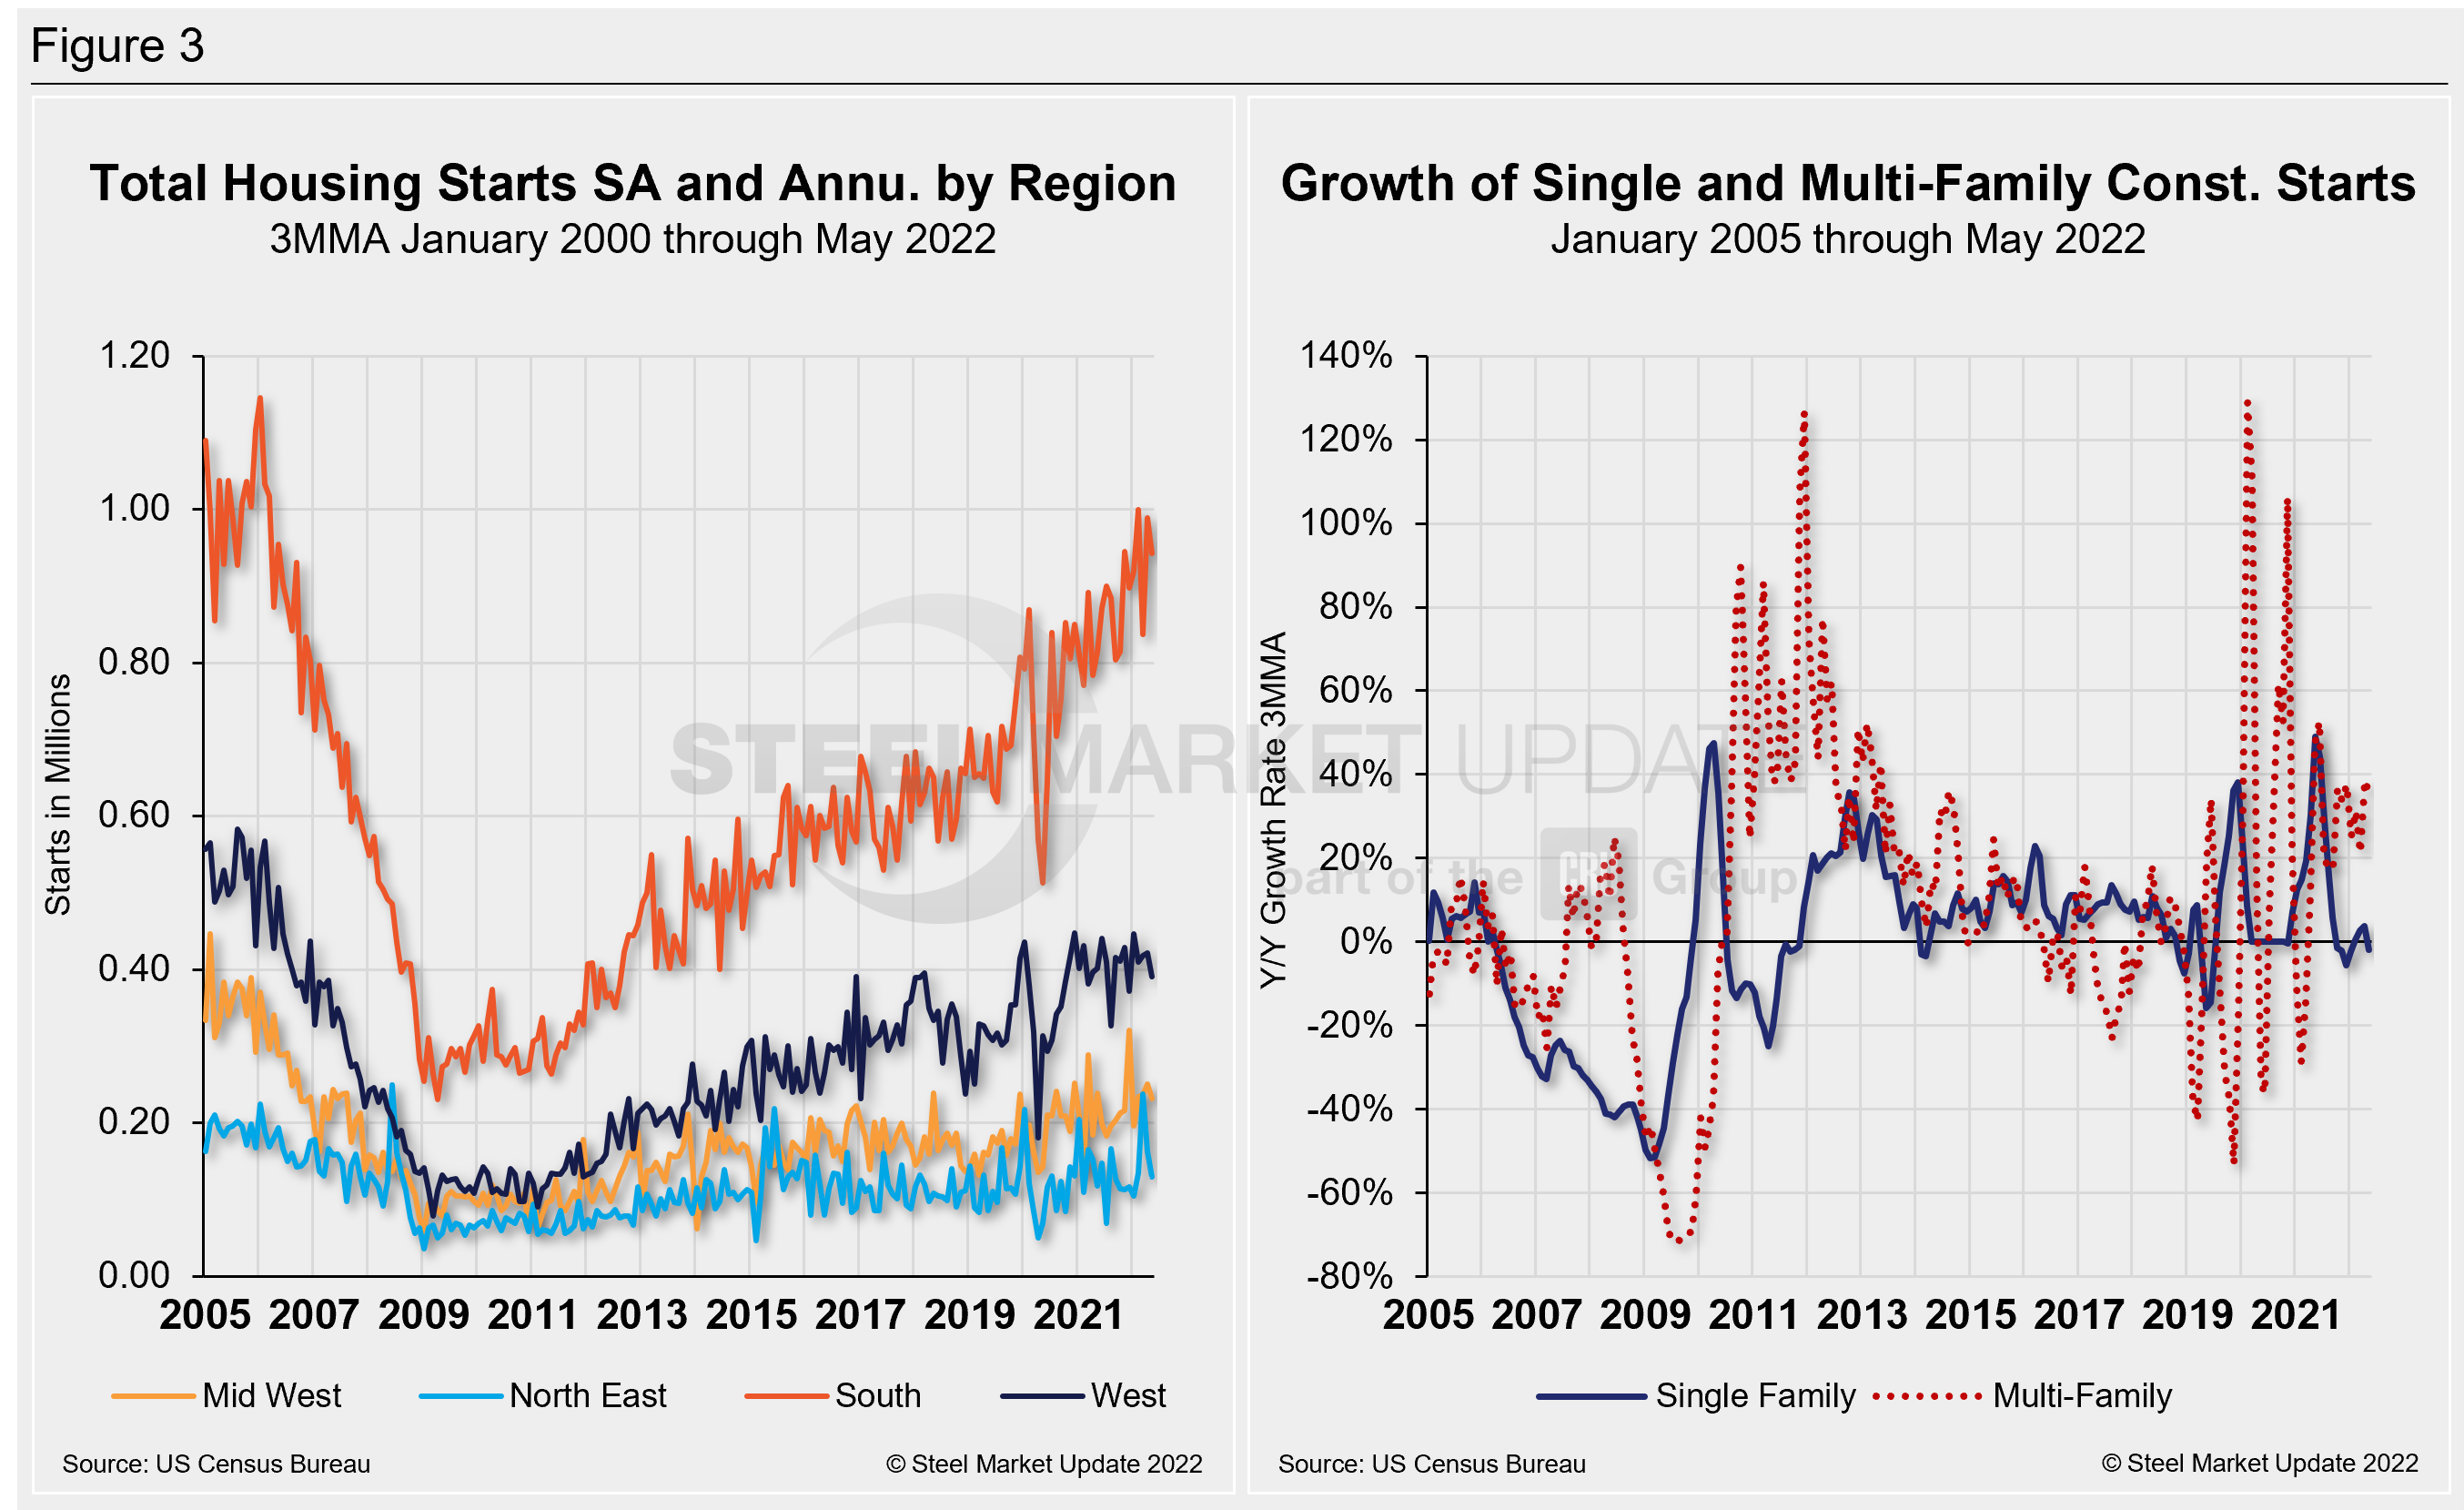
May’s homebuilding totals disappointed in May as growth stalled among residential segments. Growing homebuilding constraints, driven by higher prices for building materials, are weighing down new construction. Total housing starts in four regions – the Midwest, Northeast, South, and West – are displayed below (Figure 3). Figure 3 also displays the growth of single- and multi-family construction starts. Privately-owned housing starts in May were at a seasonally adjusted annual rate of 1.549 million, down 14.4% from the revised April estimate of 1.810 million.
Regional results were all down. The South saw the largest decline in total starts in May, 46,000 less starts MoM (-4.7%) to a total of 943,000 starts, while the Northeast saw the largest percentage decline during the same period, down 20.2% or 33,000 less starts MoM, totaling 130,000 starts in May. The Midwest was down 7.6% (19,000 fewer starts) MoM at 231,000 starts, while the West was down 7.1% (30,000 fewer starts) at 391,000 starts in May.
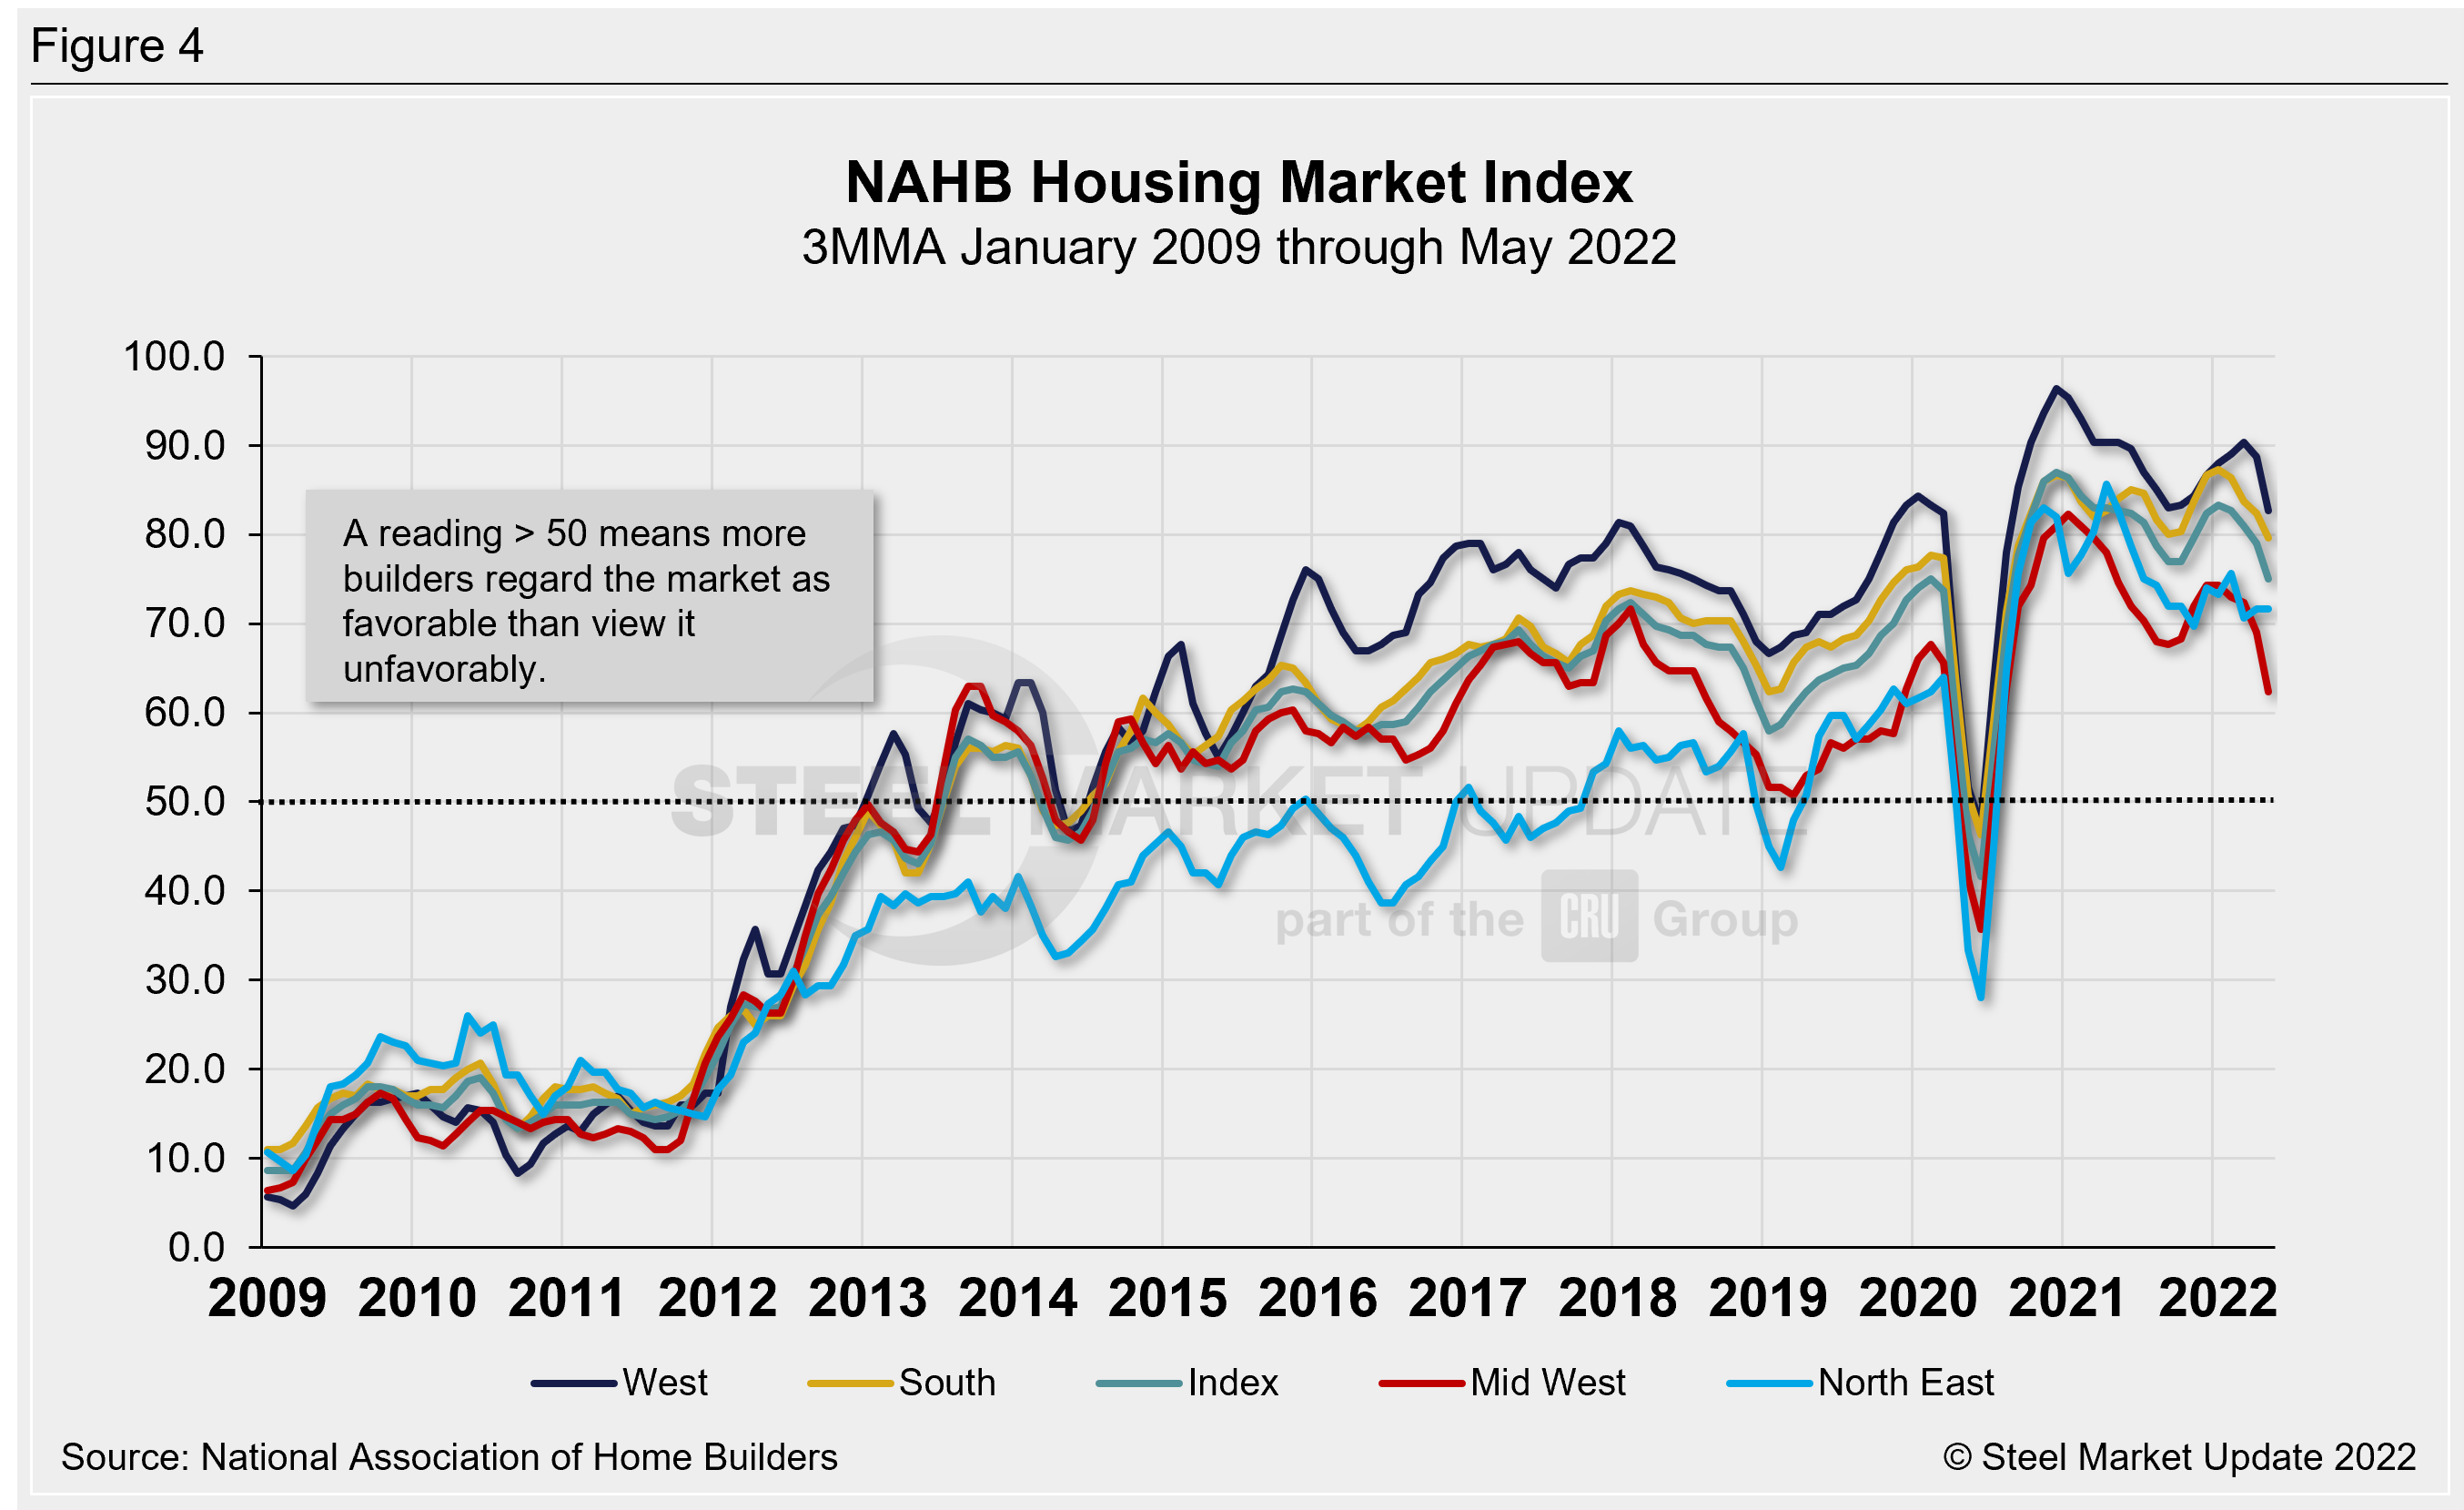
The National Association of Homebuilders (NAHB) said that prices for construction materials have increased 20% in the past year, during a period of intense demand and insufficient supply. That dynamic led to building material production bottlenecks, coupled with rising inflation, which are driving construction costs higher and further delaying projects. NAHB’s Optimism Index registered 69 in May, down from 77 in April, and slipping for the fifth straight month. Advance reports indicate that the index will fall further in June (Figure 4).
State and Local Construction
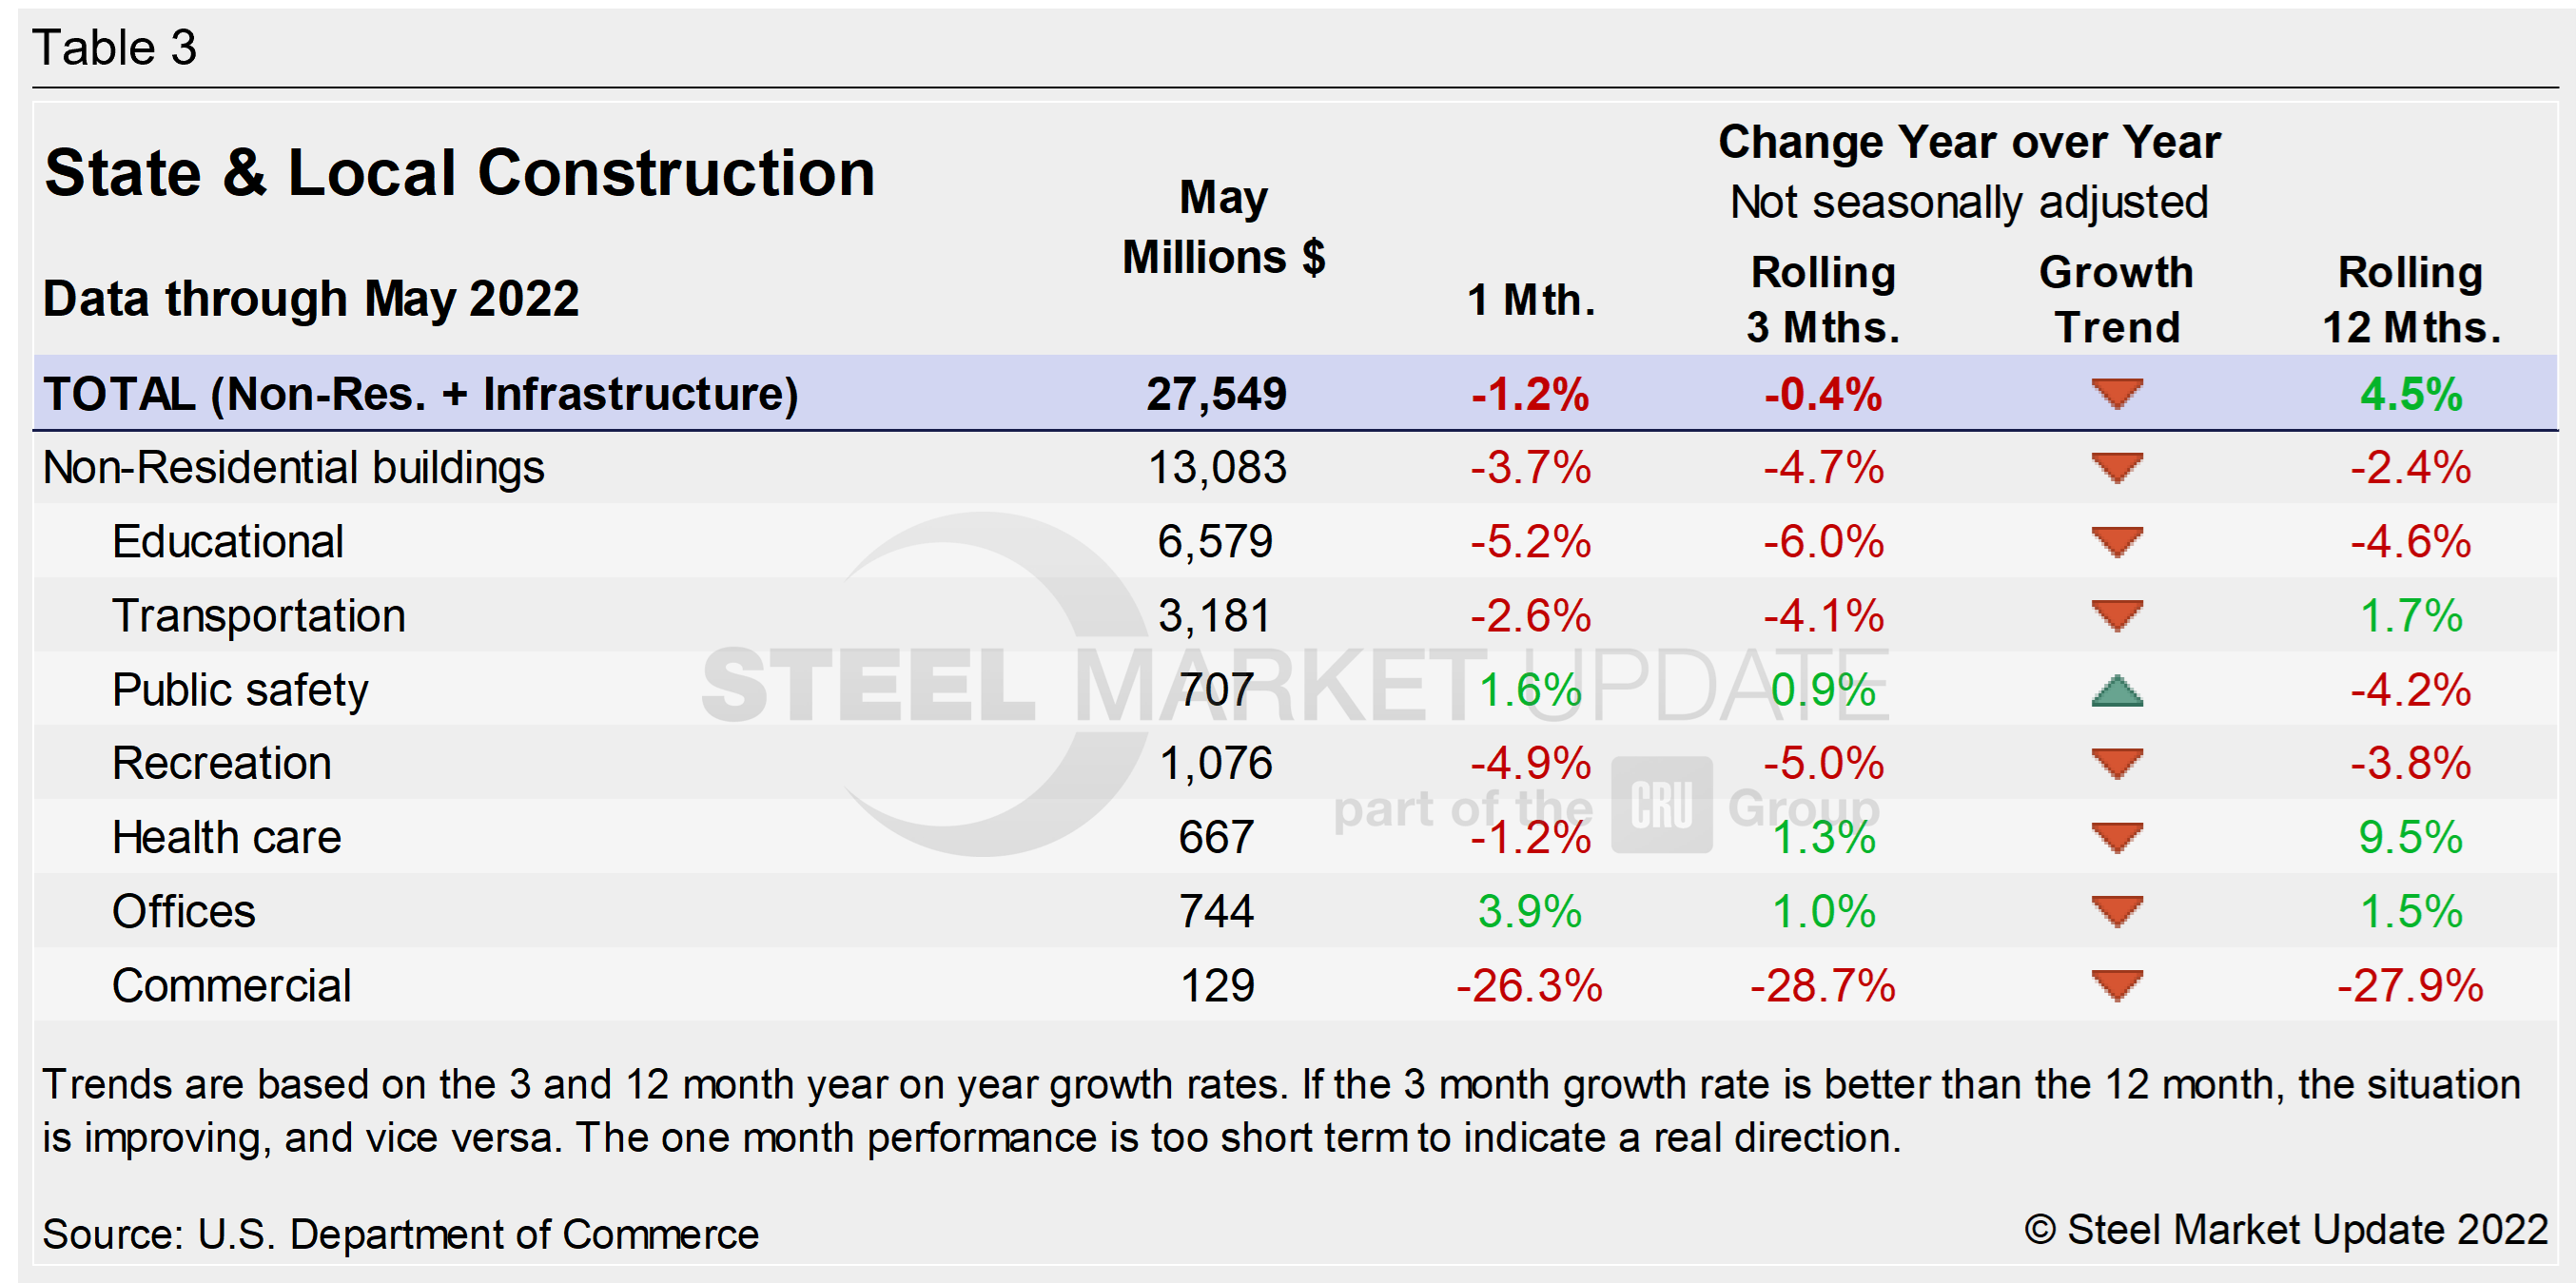
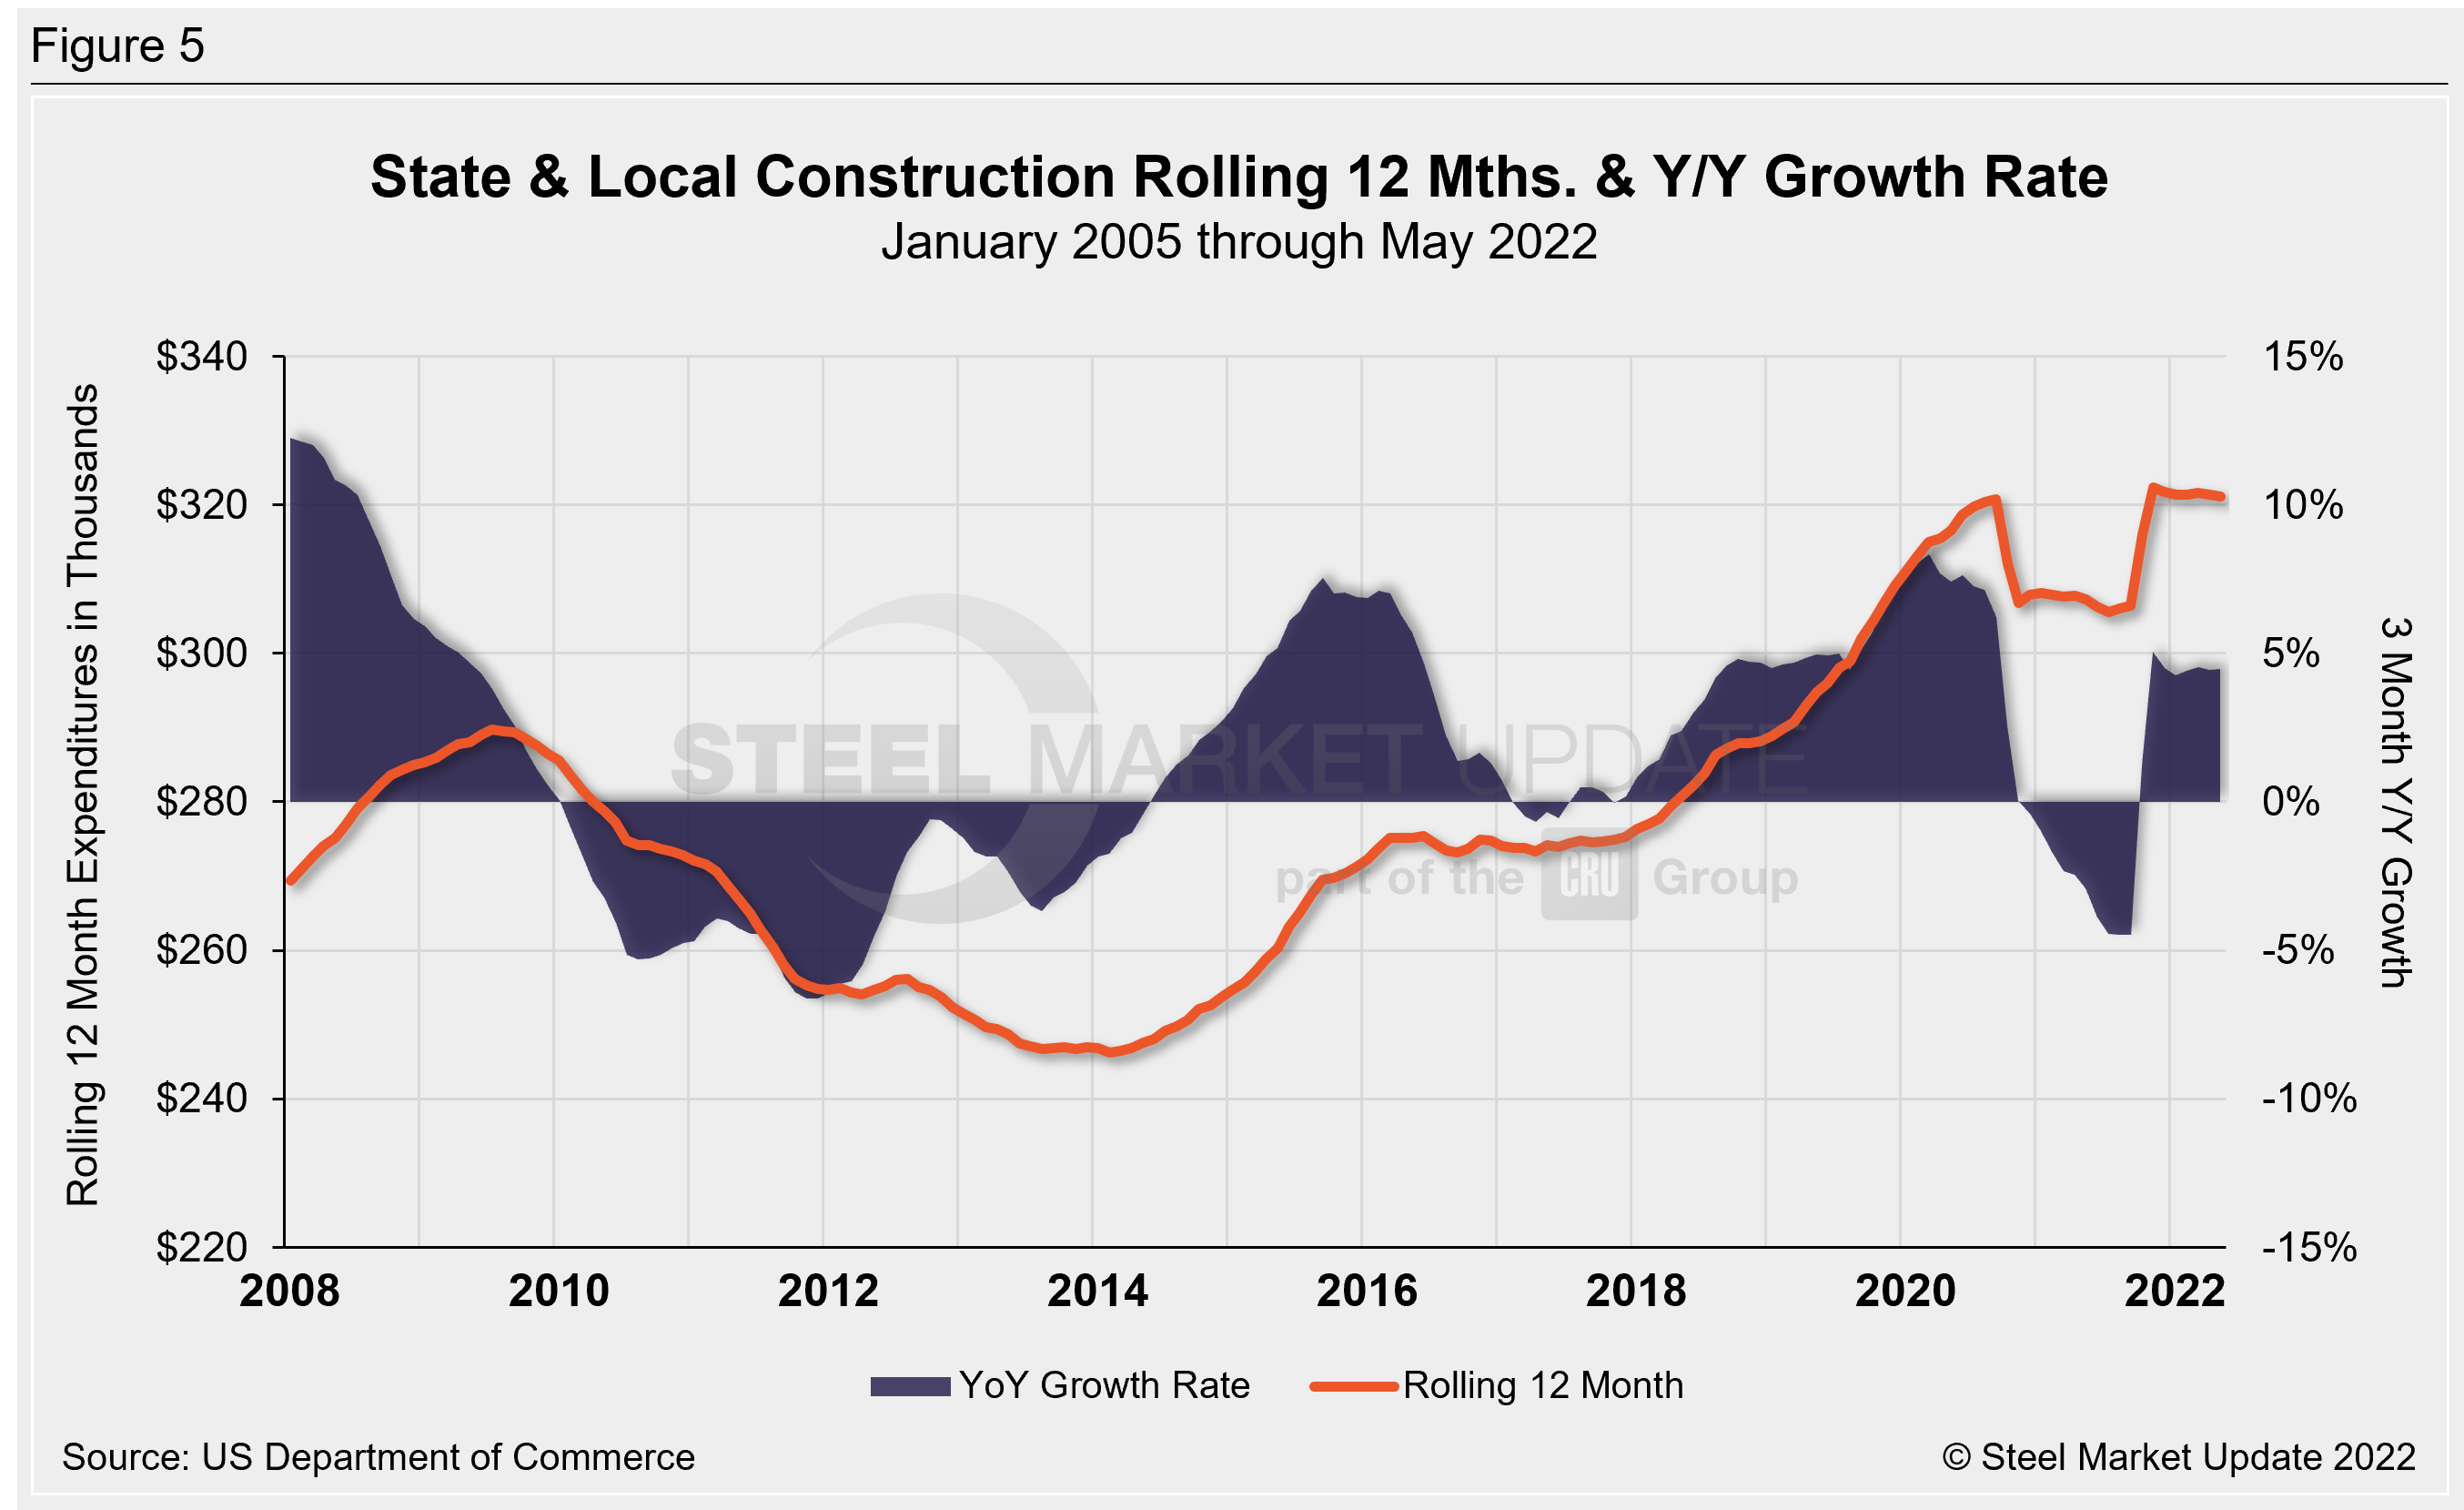
Publicly funded construction spending in May was $343.8 billion, at a seasonally adjusted rate, falling for the fourth straight month. May’s outlays slipped 0.8% below the revised April estimate of $346.6 billion. Spending on state and local government construction projects rose 10.6%, while federal government spending was up 4% month on month in May (see Table 3 and Figure 5 below).
Educational construction was at a seasonally adjusted annual rate of $78.4 billion, 0.4% below the revised April estimate of $78.7 billion. Highway construction was at a seasonally adjusted annual rate of $98.1 billion, 2.3% below the revised April estimate of $100.4 billion.
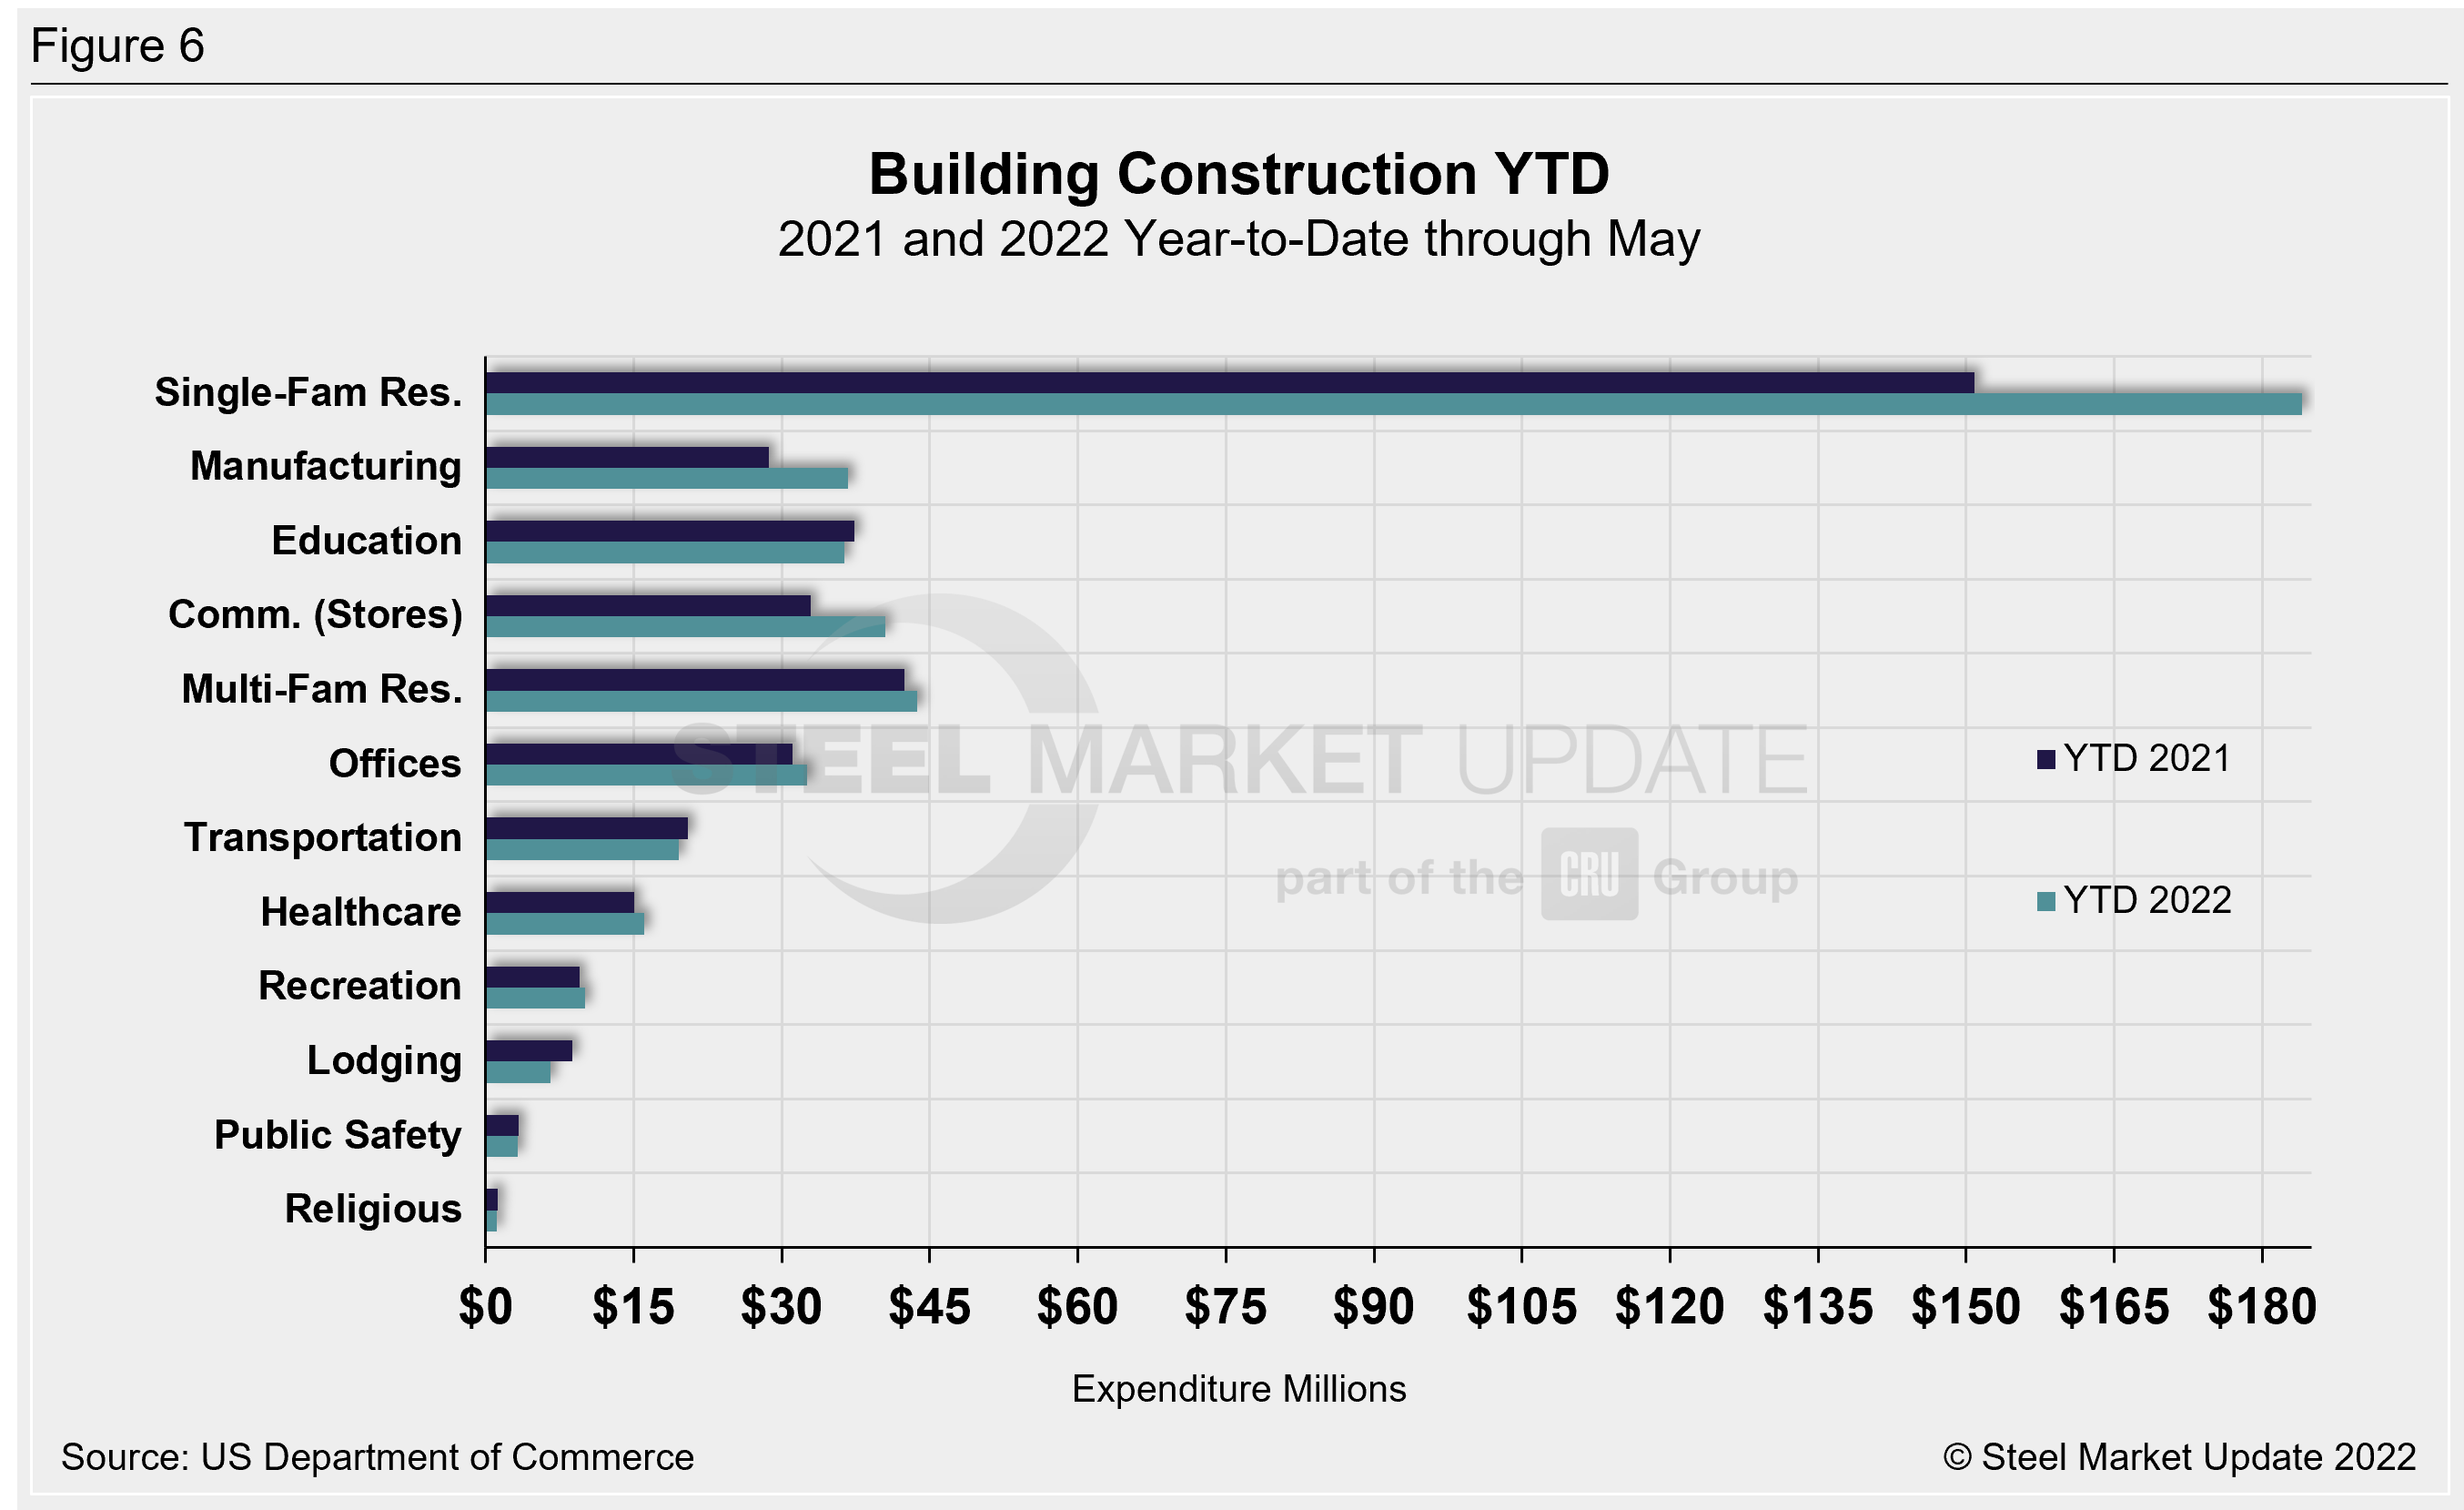
Year-to-date expenditures for construction of the various building sectors for 2021 and 2022 are compared in Figure 6. Single-family residential construction was dominant in 2021, with expenditures totaling $409.9 billion. The trend has continued into 2022: single-family residential totaled $184.1 billion through May, 22% above $150.9 billion a year ago. Manufacturing (+28.1%) saw the strongest subsector growth versus last year followed by commercial (+23.1%). Multifamily residential grew by 3.2% and totaled $43.8 billion when compared to the same year-ago period. Lodging is behind by double digits at -25.6% YoY, followed by religious and transportation, down by 11.9% and 4.2% respectively.
Explanation: Each month, the Commerce Department issues its Construction Put in Place (CPIP) data, usually on the first working day covering activity one month and one day earlier. There are three major categories based on funding source: private, state and local, and federal. Within these three groups are about 120 subcategories of construction projects. SMU analyzes the expenditures from the three funding categories to provide a concise summary of the steel-consuming sectors.
By David Schollaert, David@SteelMarketUpdate.com


