

Market Data

July 8, 2022
US Jobs Creation Outpaces Expectations in June
Written by David Schollaert
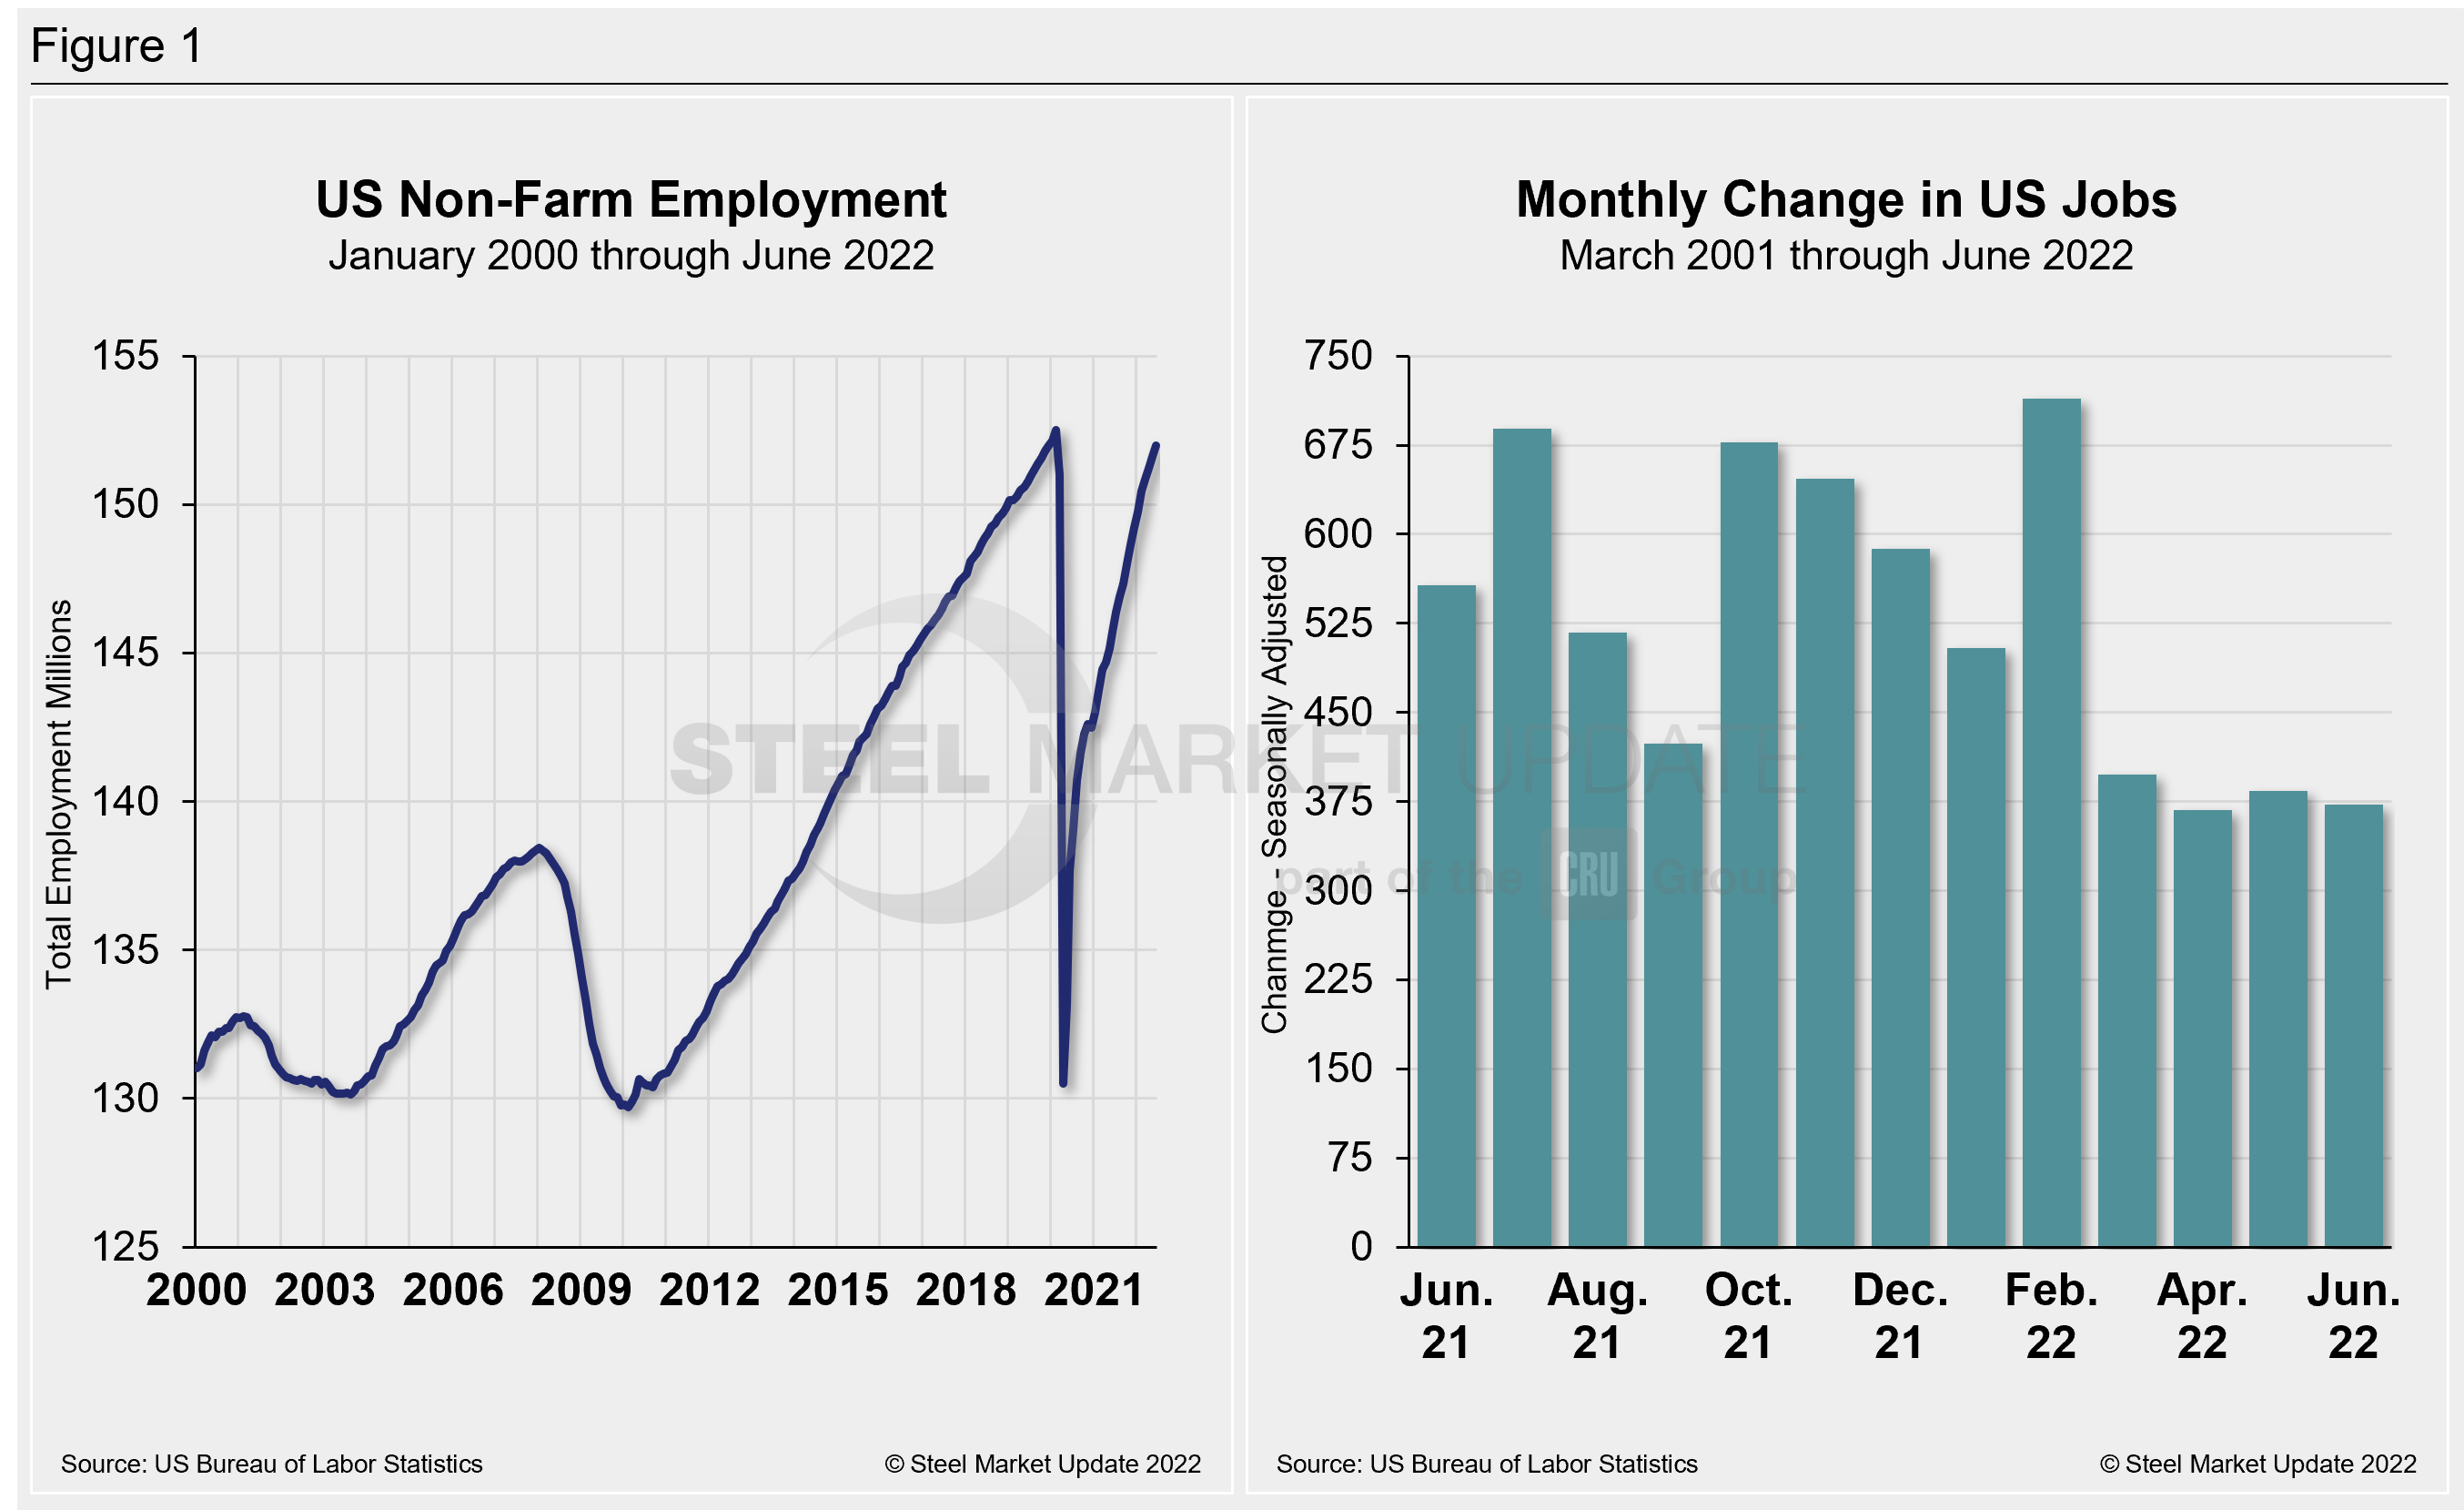
The US economy added 372,000 new jobs in June, while the unemployment rate held unchanged at 3.6%, and the labor force shrank by 353,000 people, according to the Labor Department.
Hiring last month slowed only slightly, and the US job market remains resilient despite high inflation and waning economic growth.
Job gains have slowed since April when employers were adding nearly 500,000 jobs per month on average. The slowdown, though, isn’t surprising given that the US has largely replaced most of the jobs lost during the pandemic downturn two years ago. Employment at private-sector businesses is higher now than it was in February of 2020, while government employment still lags.
Despite the surprising performance, June’s total still represented a pullback from the downwardly revised 384,000 in May.
Most industries, with the exception of leisure and hospitality, manufacturing, healthcare, wholesale trade, and local government education, have recovered all the jobs lost during the pandemic.
While demand for labor is cooling in the goods-producing sector of the economy – an interest-rate-sensitive sector – businesses in the vast services industry are scrambling for workers. There were 11.3 million job openings at the end of May, with 1.9 jobs for every unemployed person.
Wages in June were still on the rise, but continue to be outpaced by the highest inflation in 40 years. Average hourly earnings were up 5.1% during the past 12 months. The labor force participation rate, at 62.2%, changed little from the previous month but remains below the pre-pandemic level of 63.4%.
Side-by-side in Figure 1 below is a snapshot of the pace of hiring since April 2021 and the total number of non-farm workers employed in the US since 2000.
The number of long-term unemployed (out of work for at least 27 consecutive weeks) was essentially unchanged at 1.3 million in June versus May. That figure accounted for 22.6% of the total unemployed in the month. This measure is 215,000 higher than in February 2020.
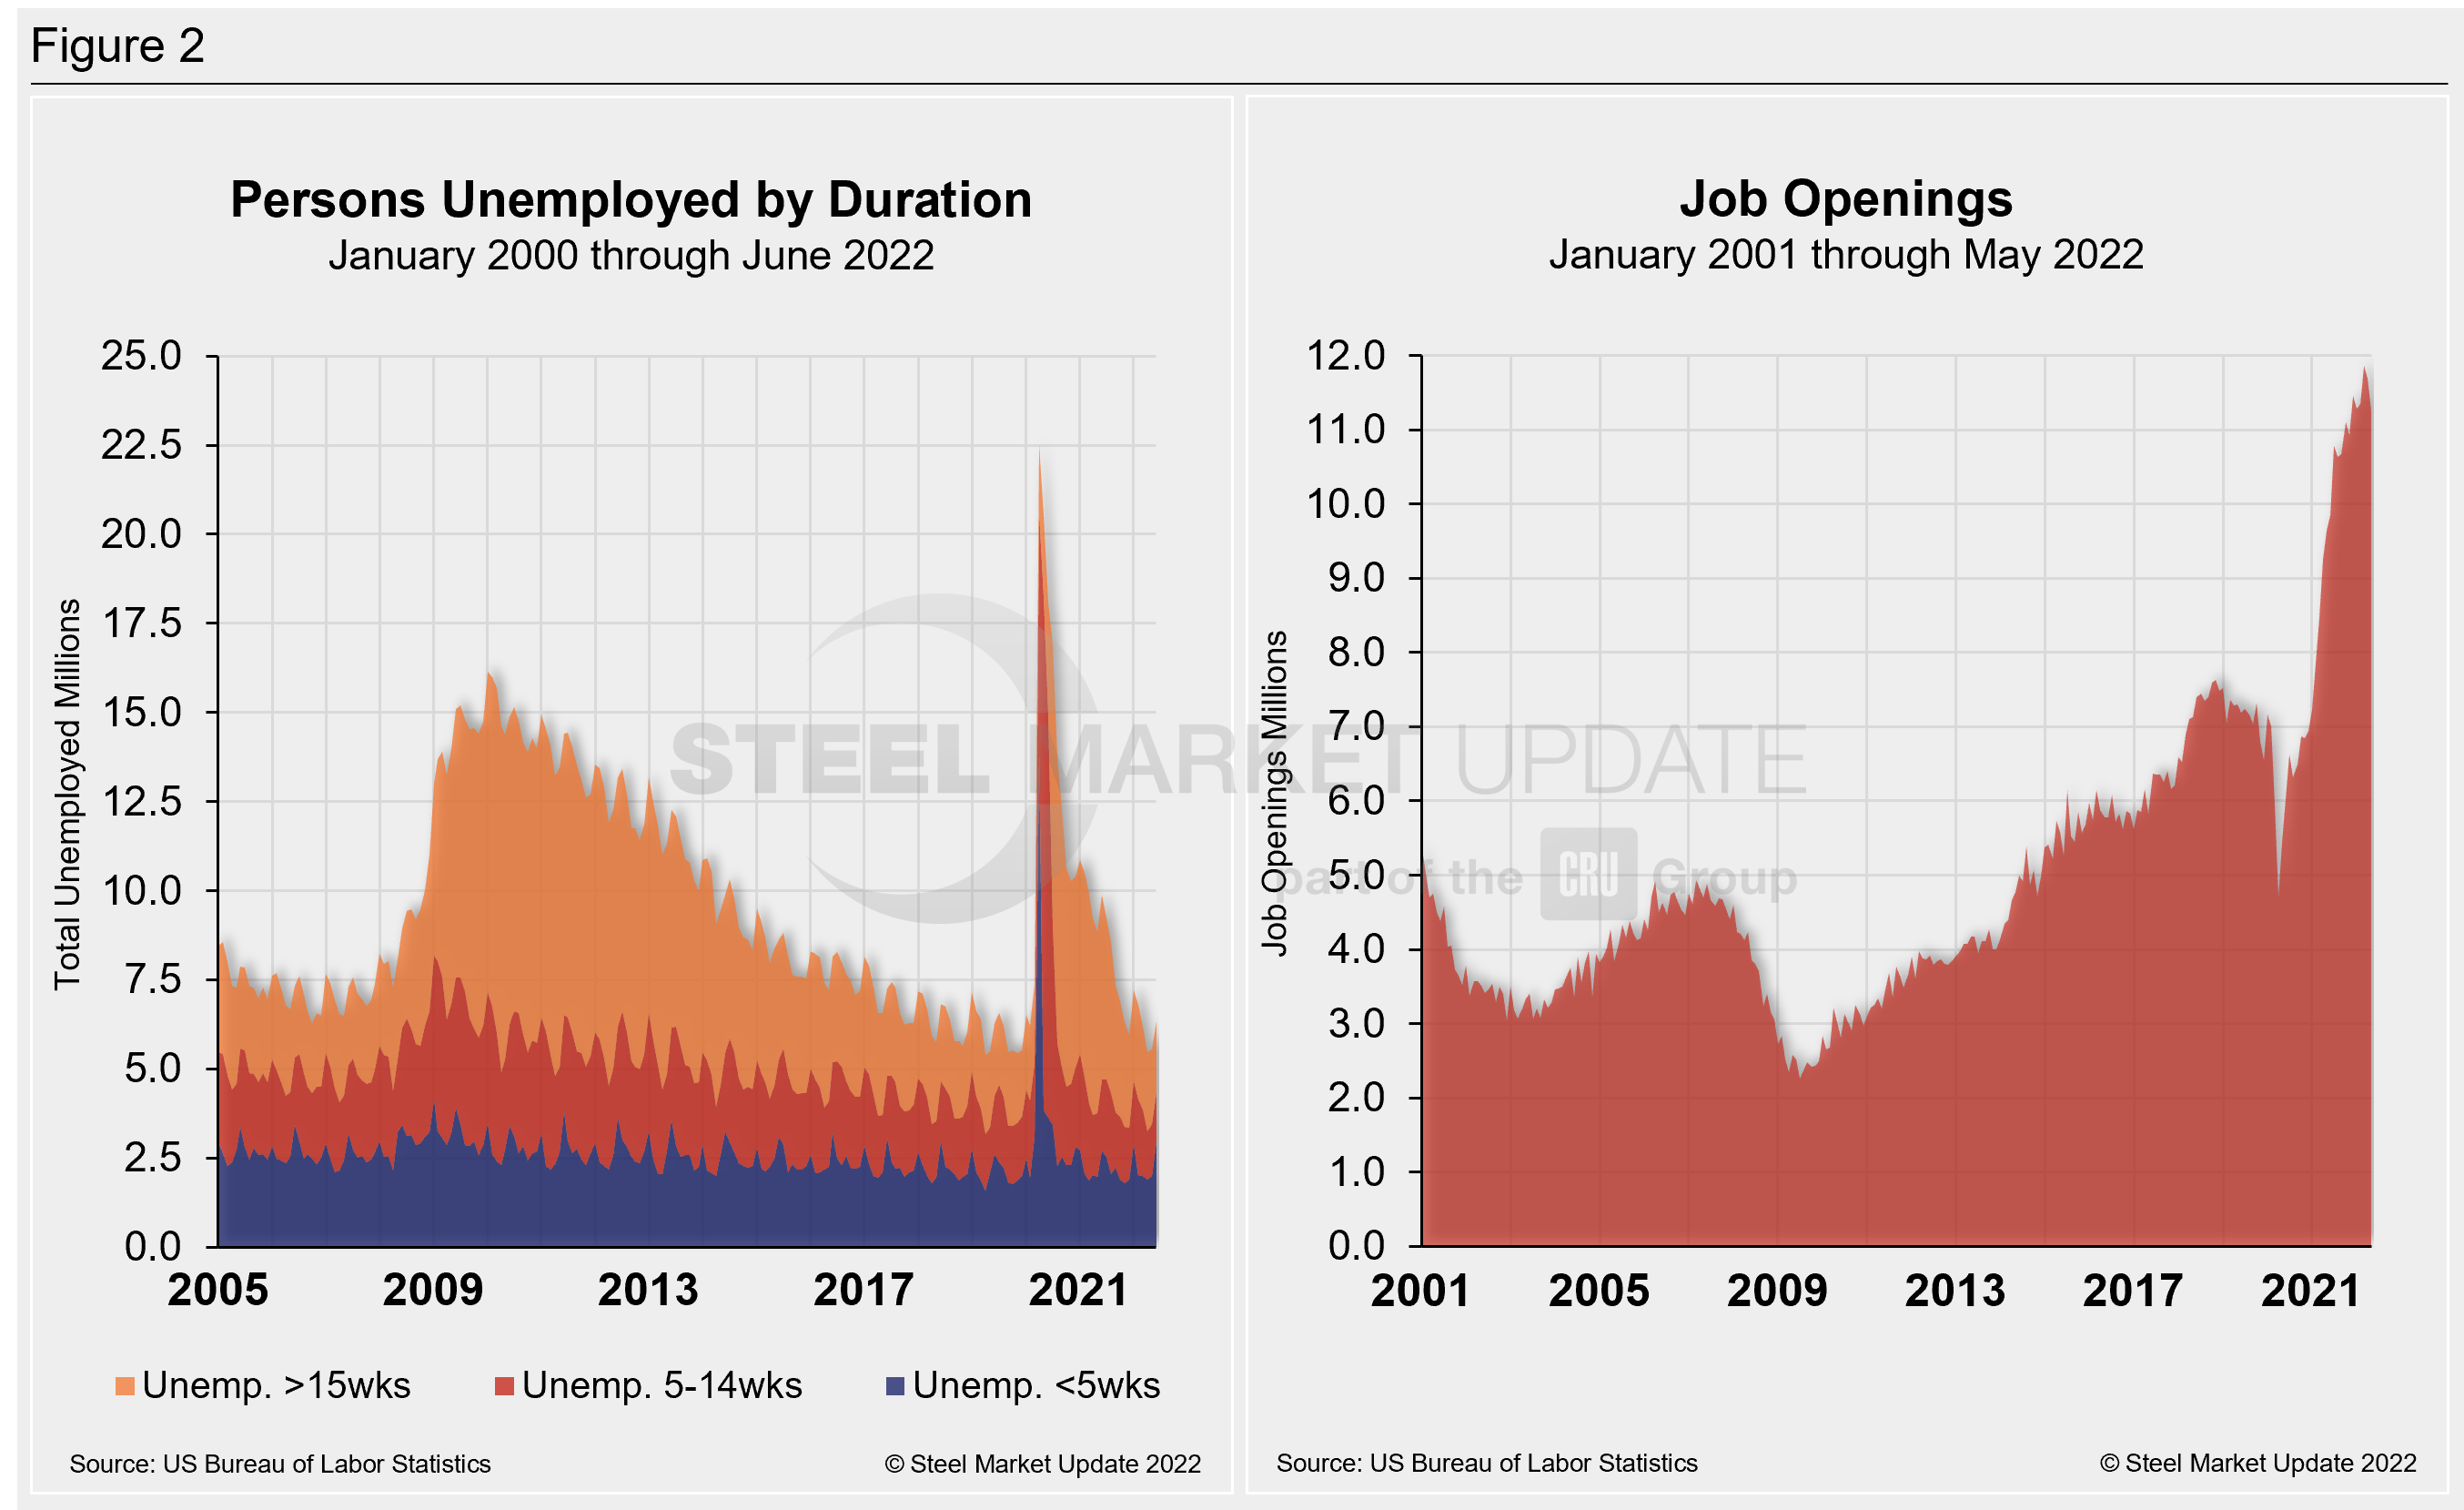
The historic picture for the duration of unemployment since January 2000 is broken down into <5 weeks, 5 to 14 weeks, and >15 weeks in Figure 2. The total number of unemployed was 6.334 million at the end of June, an increase of 786,000 compared to May. This increase put the result slightly above the pre-pandemic unemployment total in February 2020 for the first time in four months.
June’s results show that roughly 16.1 million more people now have jobs compared to the 22.5 million thrown out of work during the worst of the pandemic in April 2020. As of July 8, 31.2% had been unemployed for more than 15 weeks, 21.9% for 5 to 14 weeks, and 46.8% for less than 5 weeks.
As part of June’s employment report, the Labor Department released its monthly report on job openings, layoffs, and quitting through the last day of May. Also known as the “JOLTS” report, the data serve as an indicator of how much demand there is for workers in the US economy and the extent to which employers are still struggling with labor shortages nearly two years removed from the worst of the pandemic.
May’s job openings has declined consecutively from the record number set in March. The report suggests that workers remain in high demand and are still quitting more often. There were about 11.3 million job openings in May, 427,000 fewer job openings than April, and 601,000 fewer than the record of 11.9 million set in March.
The charts below (Figure 2) detail the total persons unemployed by duration from 2005 through May 2022 and the total job openings over the same period.
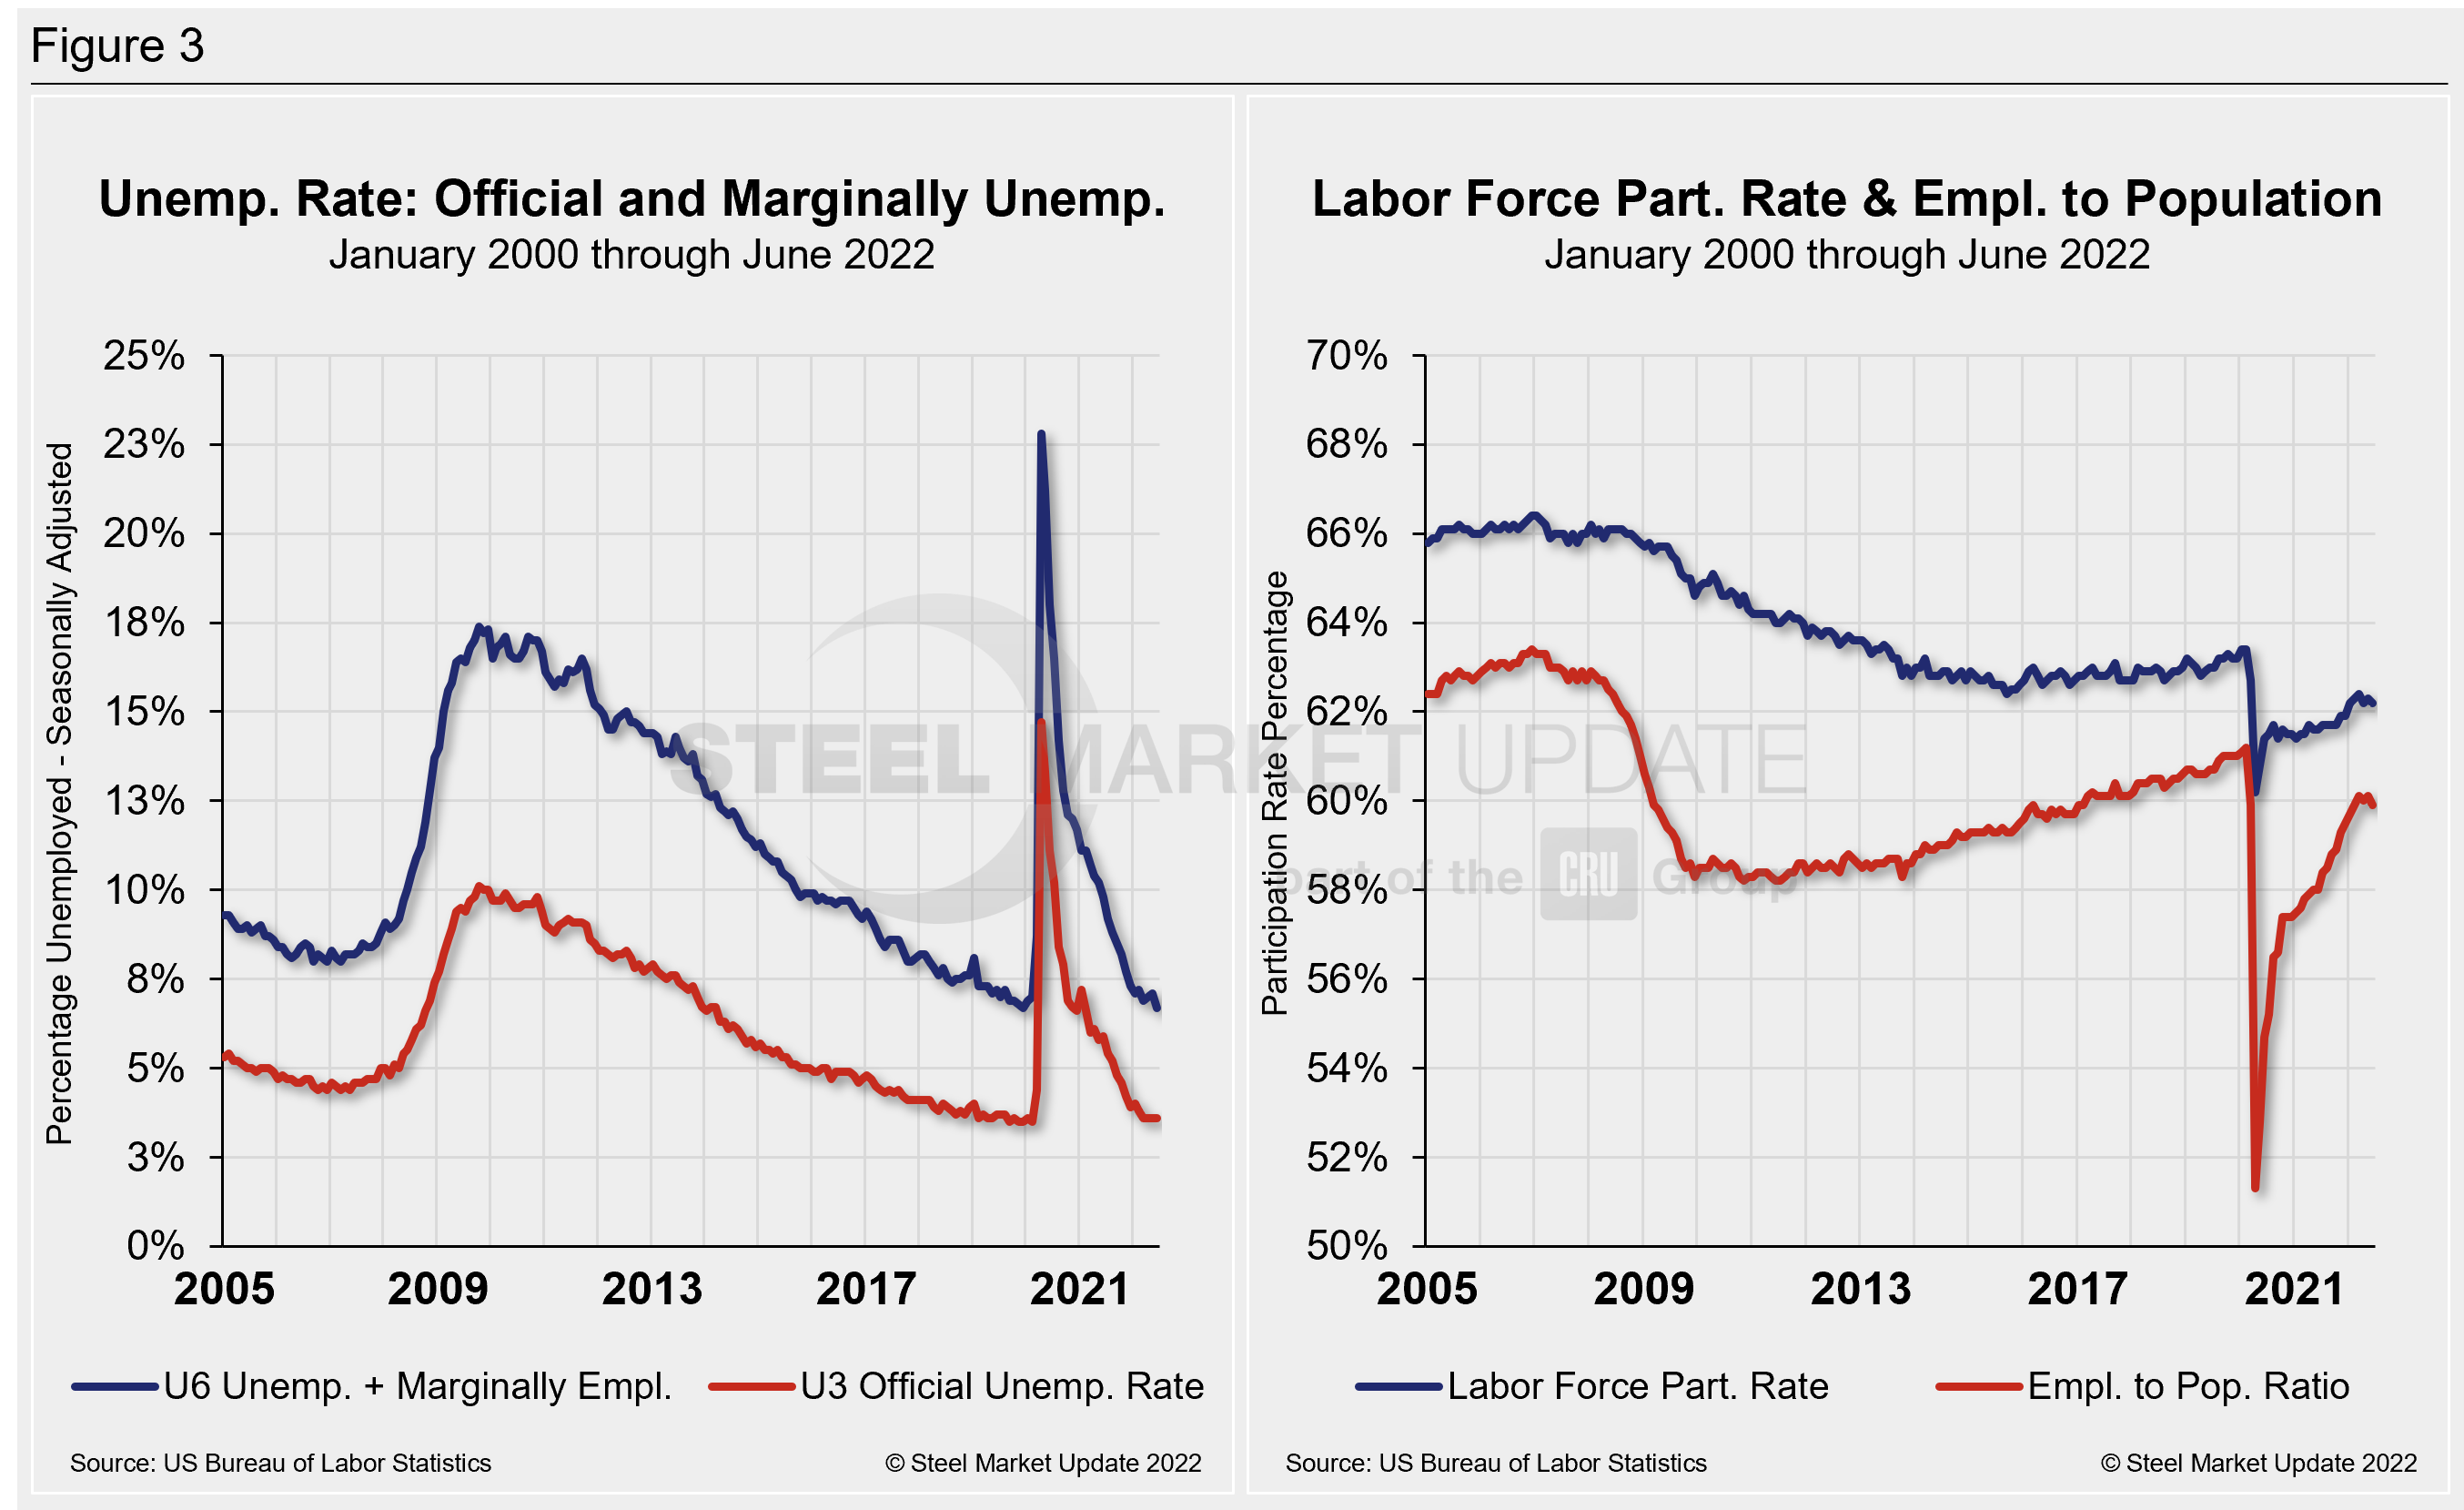
The official unemployment rate, U3, reported in the Bureau of Labor Statistics Household survey (see explanation below), increased from 3.5% in February 2020 to 14.7% in April 2020. Since April 2020, it has trended down despite some oscillations to start the year. Since March, the U3 rate has held unchanged at its lowest mark in two years at 3.6. U6, a more encompassing measure of unemployment that includes discouraged workers and those holding part-time jobs for economic reasons, fell for the first time in three months, slipping to 6.7last month from 7.1 in May.
Another gauge, and a more definitive view, are the number employed as a percentage of the population. Last month, the employment-to-population ratio was 59.9%, a marginal decrease from 60.1% in May, and the first decline since March.
Figure 3 details side-by-side parallels of the unemployment rate (both the U3 and U6 rates) since 2005 as well as the labor force participation rate and employment to population ratio over the same period.
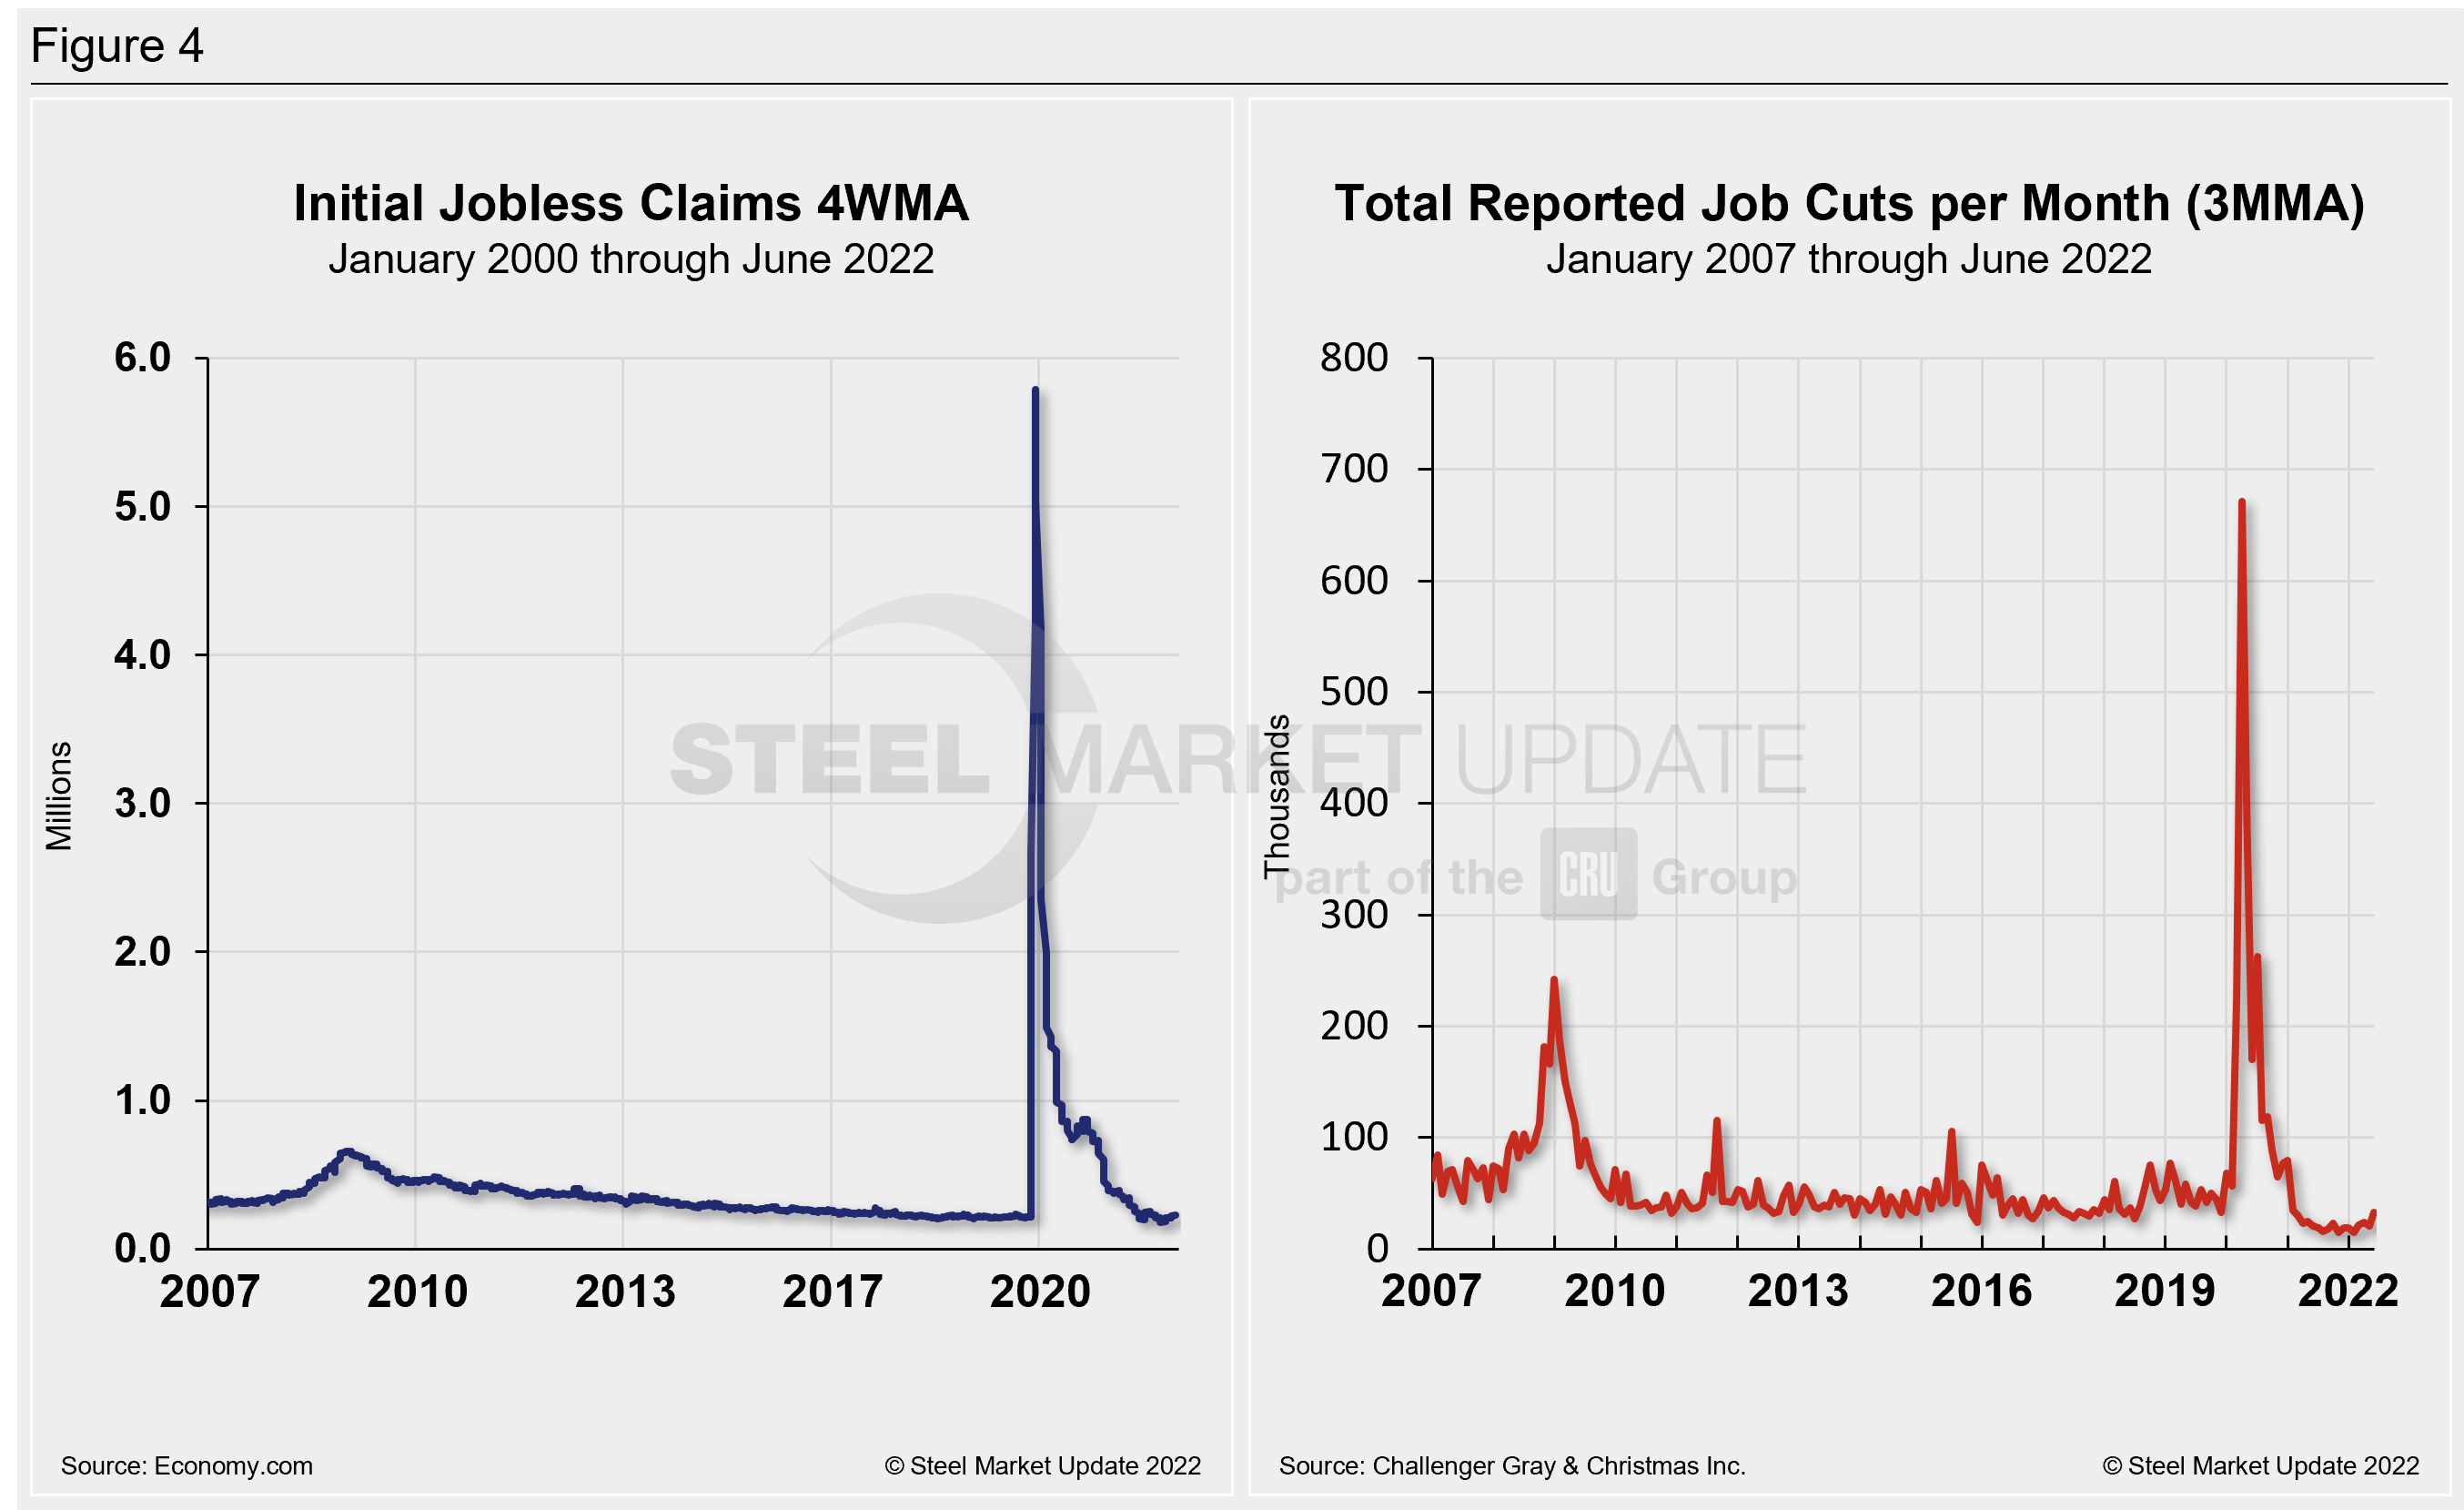
Initial claims for unemployment insurance, which are reported weekly by the Department of Labor, rose by 2,000 to 235,000 in the week ended July 2, and up 35,000 news claims since our list report a month ago. Despite the increase, they remain below the 250,000 threshold which would raise a red flag about the health of the labor market, the DOL said.
“Continuing claims, a proxy for hiring, rose 51,000 to 1.375 million in the week ended June 25. Recession concerns could be causing businesses to pause hiring. The insured unemployment rate rose from 0.9% to 1% in the week ended June 25,” Economy.com reported.
Human resources consulting firm Challenger, Gray and Christmas Inc. produces a monthly employment update for the US. It reported that job cuts in June totaled 32,517 an increase of 58.8% from 20,476 announced the prior month. May’s total is 57% higher than the same year-ago period when 20,712 cuts were announced.
June marks the highest monthly total since February 2021, when 34,531 cuts were announced. It is the second time this year that cuts were higher in 2022 than the corresponding month a year earlier, the report said.
Year to date, employers announced 133,211 cuts, down 37% from the 212,661 cuts announced through the same period in 2021. It is the lowest January to June total since Challenger began tracking job cuts in 1993.
In the second quarter though, employers announced 77,515 job cuts, the highest quarterly total since Q1 of 2021, when 144,686 cuts were recorded. It is 39% higher than the 55,696 cuts announced in Q1 of this year and 14% higher than the 67,975 cuts announced in the same quarter last year.
“Employers are beginning to respond to financial pressures and slowing demand by cutting costs. While the labor market is still tight, that tightness may begin to ease in the next few months,” said Challenger.
Of the 30 industries Challenger tracks, 10 saw more job cuts announced in 2022 than in the same period last year. In June, the automotive sector announced the most cuts with 10,198, bringing the year-to-date total to 15,578, a 155% increase from the 6,111 cuts announced through June last year. The industry, plagued by supply chain issues, semiconductor shortages, and now surging gas prices, is finding its footing as it pivots amid increased demand for electric vehicles, the report said.
Health care/products manufacturers and providers announced the most job cuts this year with 19,390, up 54% from the 12,620 announced through June 2021. Figure 4 shows the four-week moving average of new claims since January 2005, seasonally adjusted. It also shows the total reported job cuts per month, according to Challenger, on a three-month moving average.
Explanation: On the first Friday of each month, the Bureau of Labor Statistics releases the employment data for the previous month. Data is available at www.bls.gov. The BLS reports on the results of two surveys. The Establishment survey reports the actual number employed by industry. The Household survey reports on the unemployment rate, participation rate, earnings, average workweek, the breakout into full-time and part-time workers and lots more details describing the age breakdown of the unemployed, reasons for and duration of unemployment.
By David Schollaert, David@SteelMarketUpdate.com


