

Analysis

August 9, 2022
CPIP Data: US Construction Spending Down Again
Written by David Schollaert
US construction spending in June totaled $1.762 trillion at a seasonally adjusted annual rate, 1.1% below May’s upwardly revised estimate of $1.782 trillion. Though down for the second straight month, this is only the second drop since September 2021, according to data from the Commerce Department.
The decline came as outlays on single-family homebuilding declined sharply amid rising mortgage rates.
While month-on-month (MoM) growth disappointed in June, construction spending increased 8.3% on a year-on-year (YoY) basis. Spending on private construction projects decreased 1.3% after increasing 0.2% in May.
The Census Bureau’s report on construction shows investment in residential construction dropped 1.6%, with spending on single-family projects plunging 3.1%. Outlays on multi-family housing projects increased 0.4%.
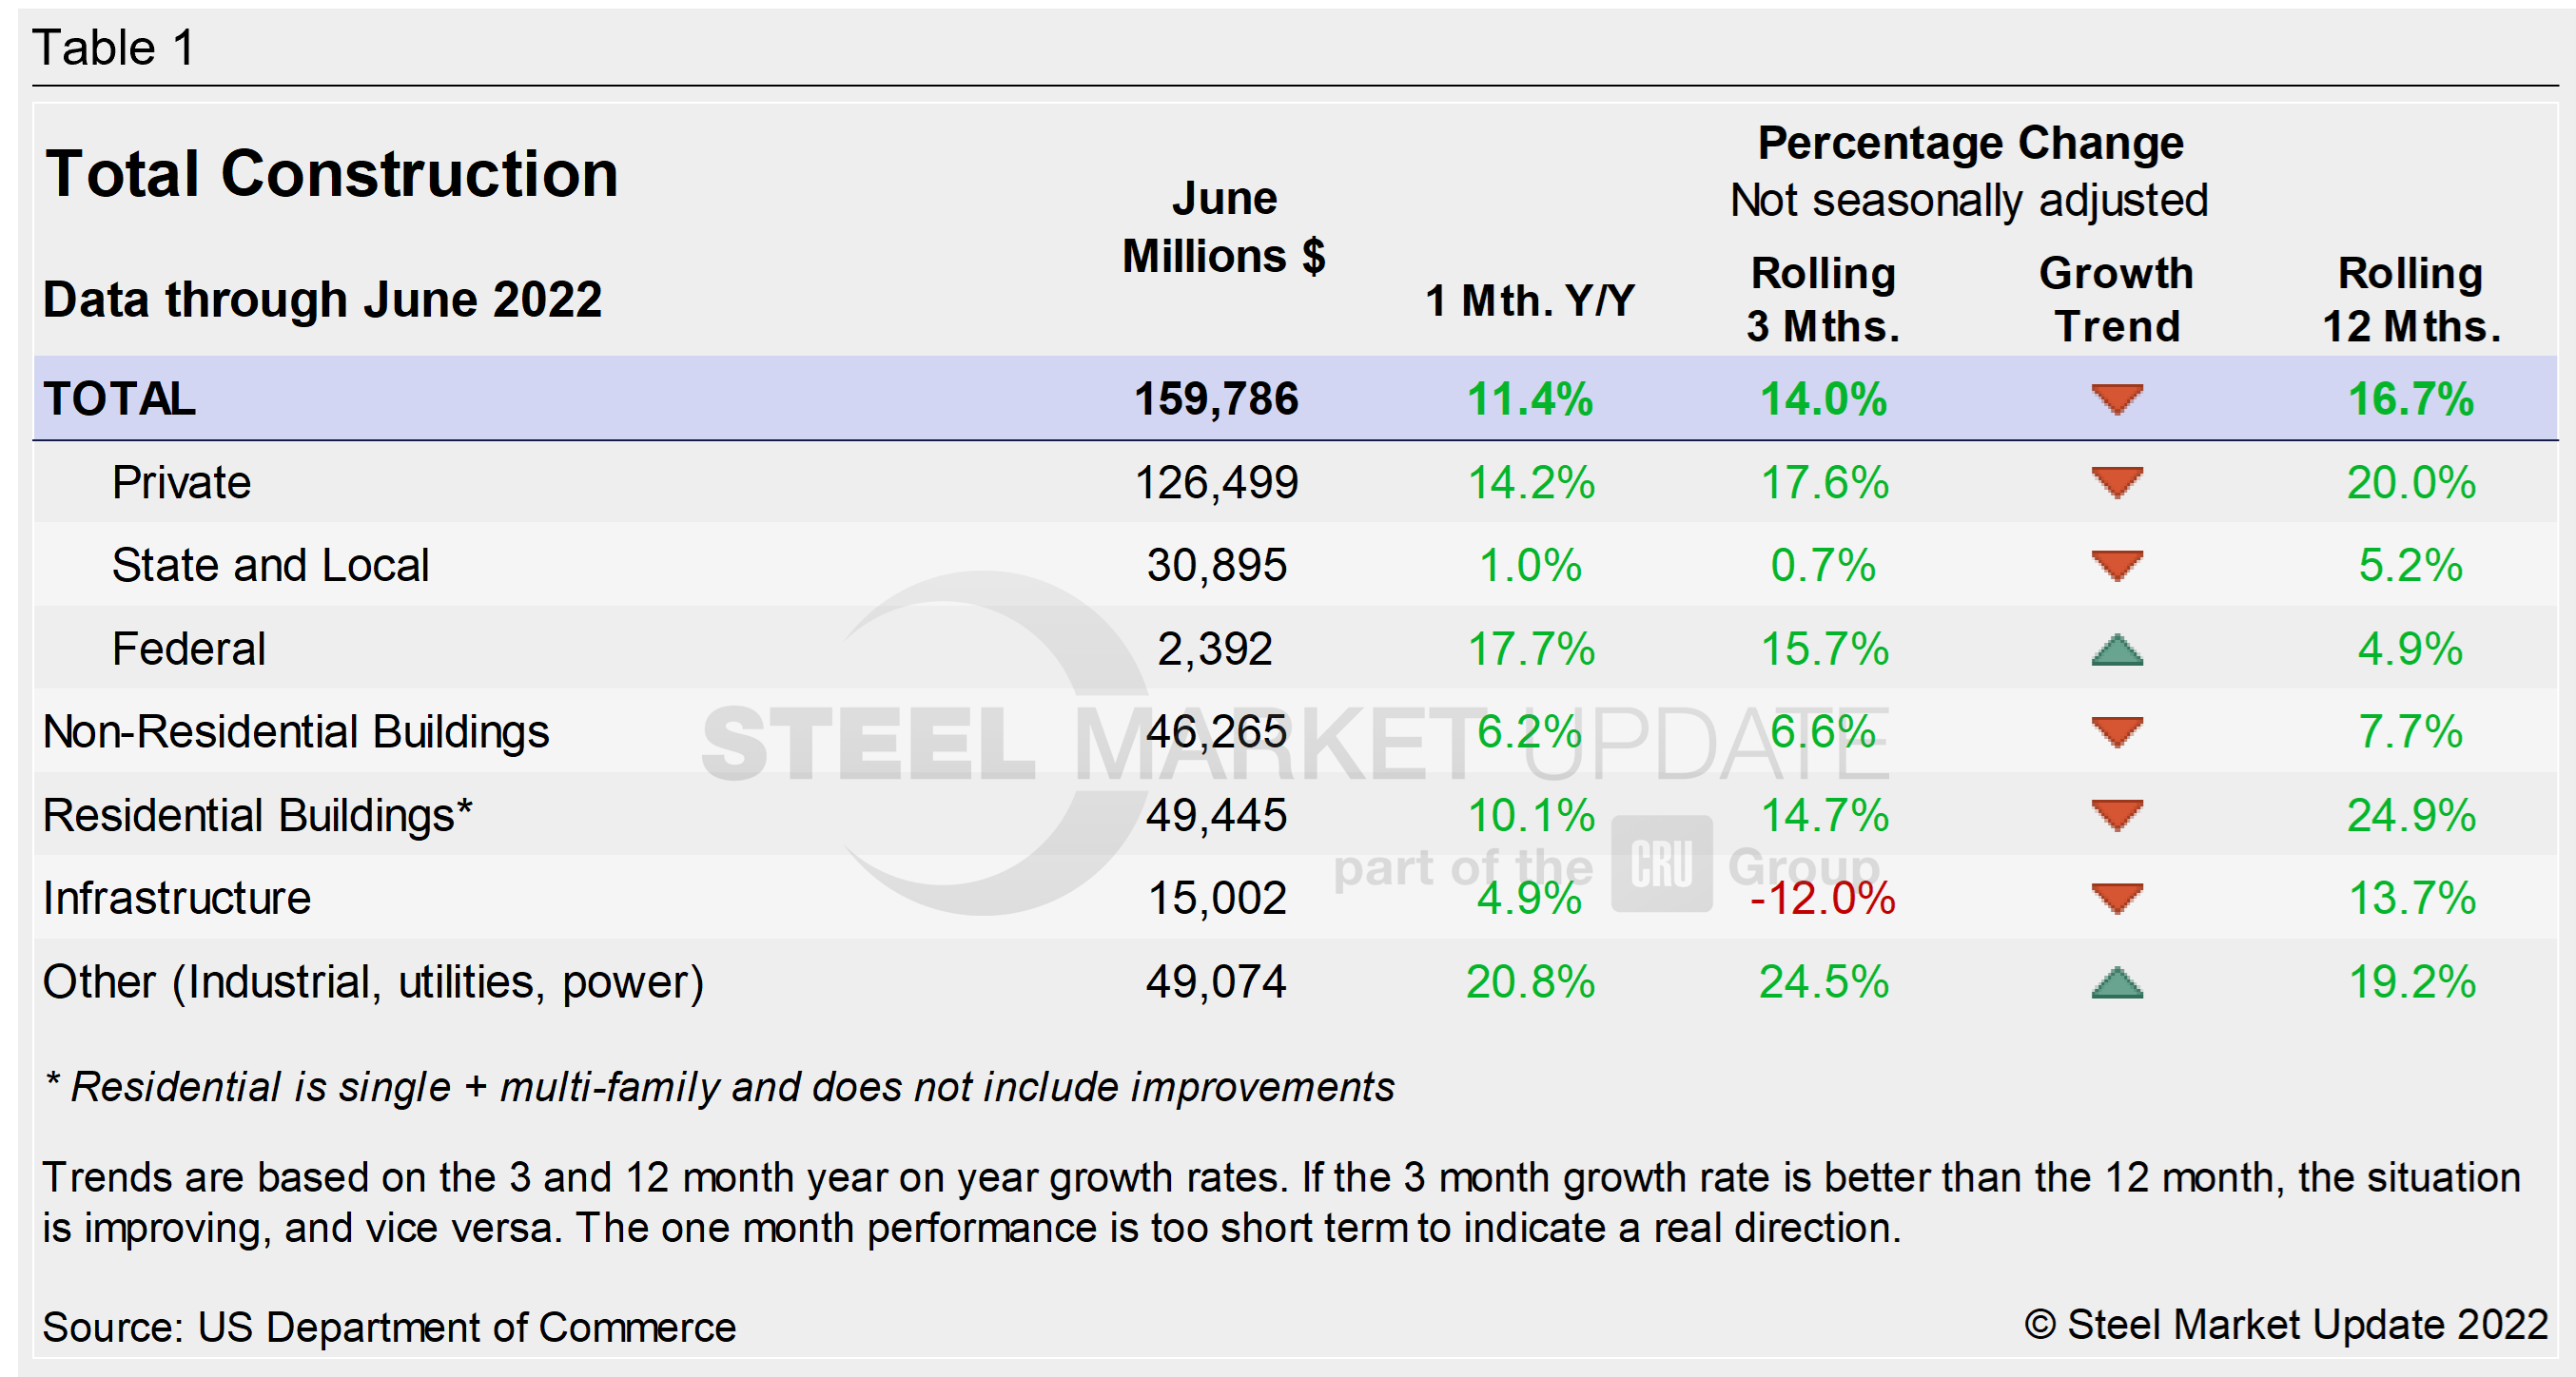
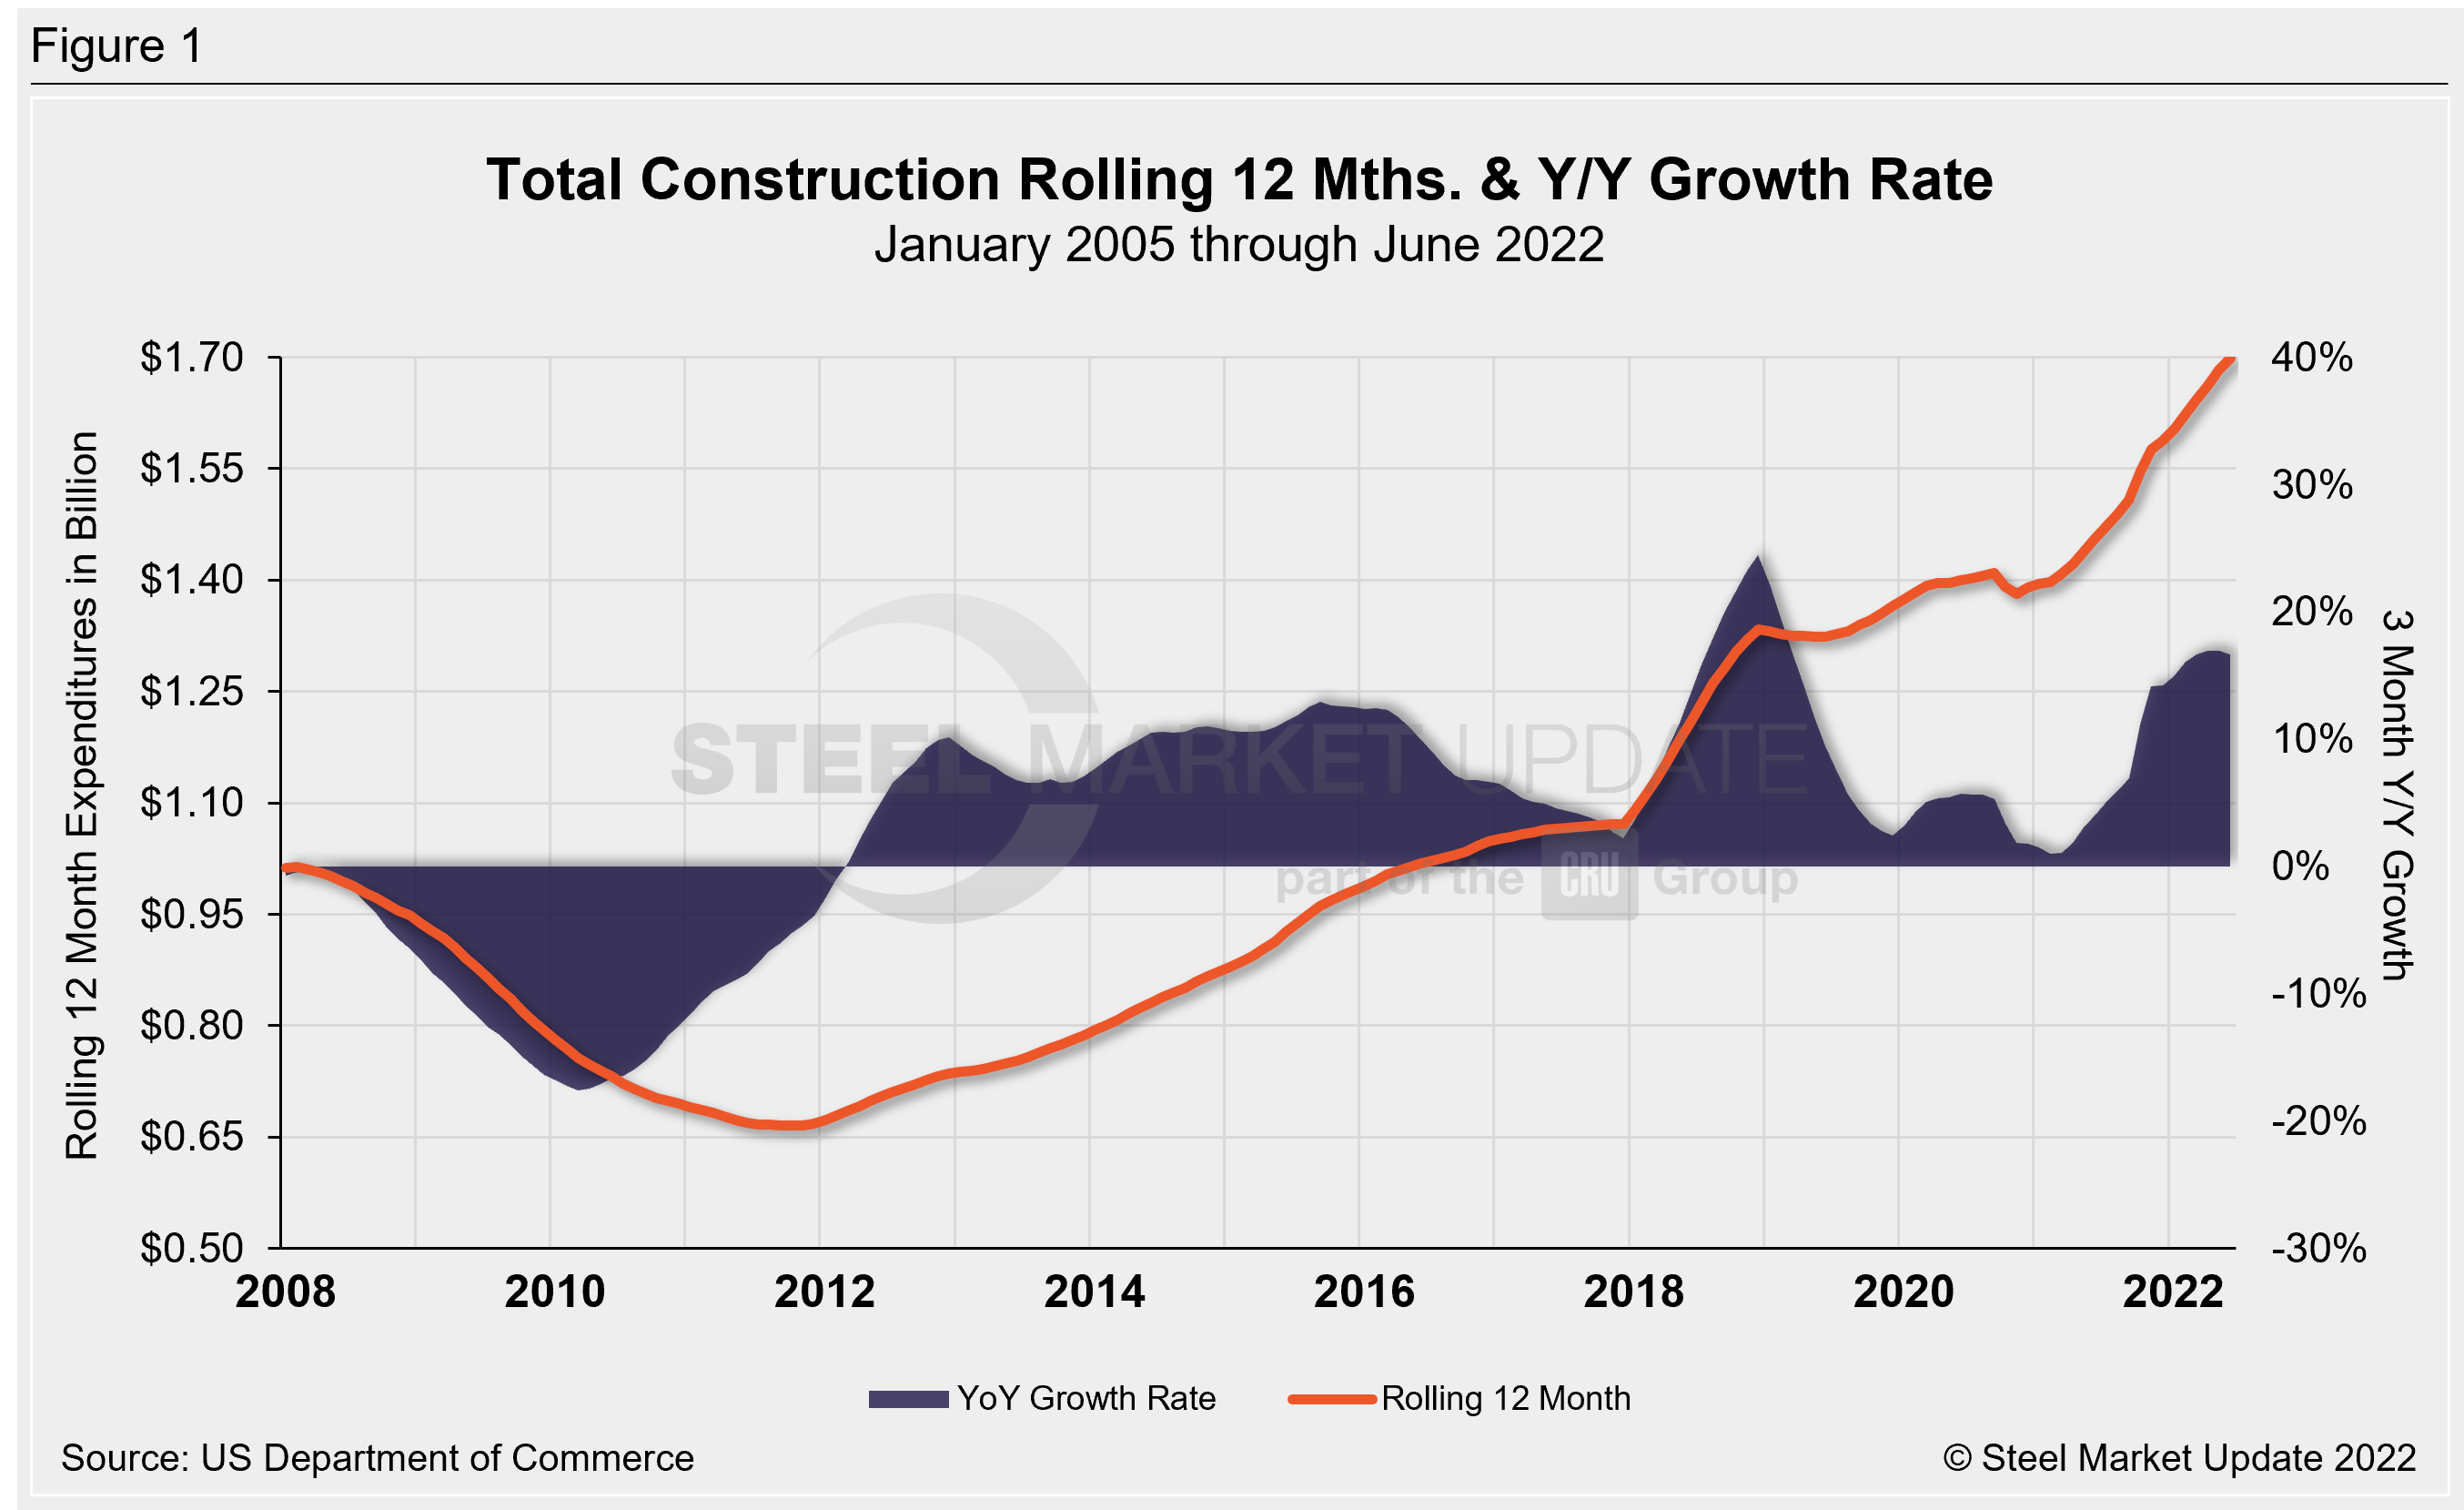
Total construction expenditures and their major categories are shown in Table 1 below. Figure 1 shows total construction and infrastructure expenditures. It details the YoY growth rate versus a rolling 12-month average.
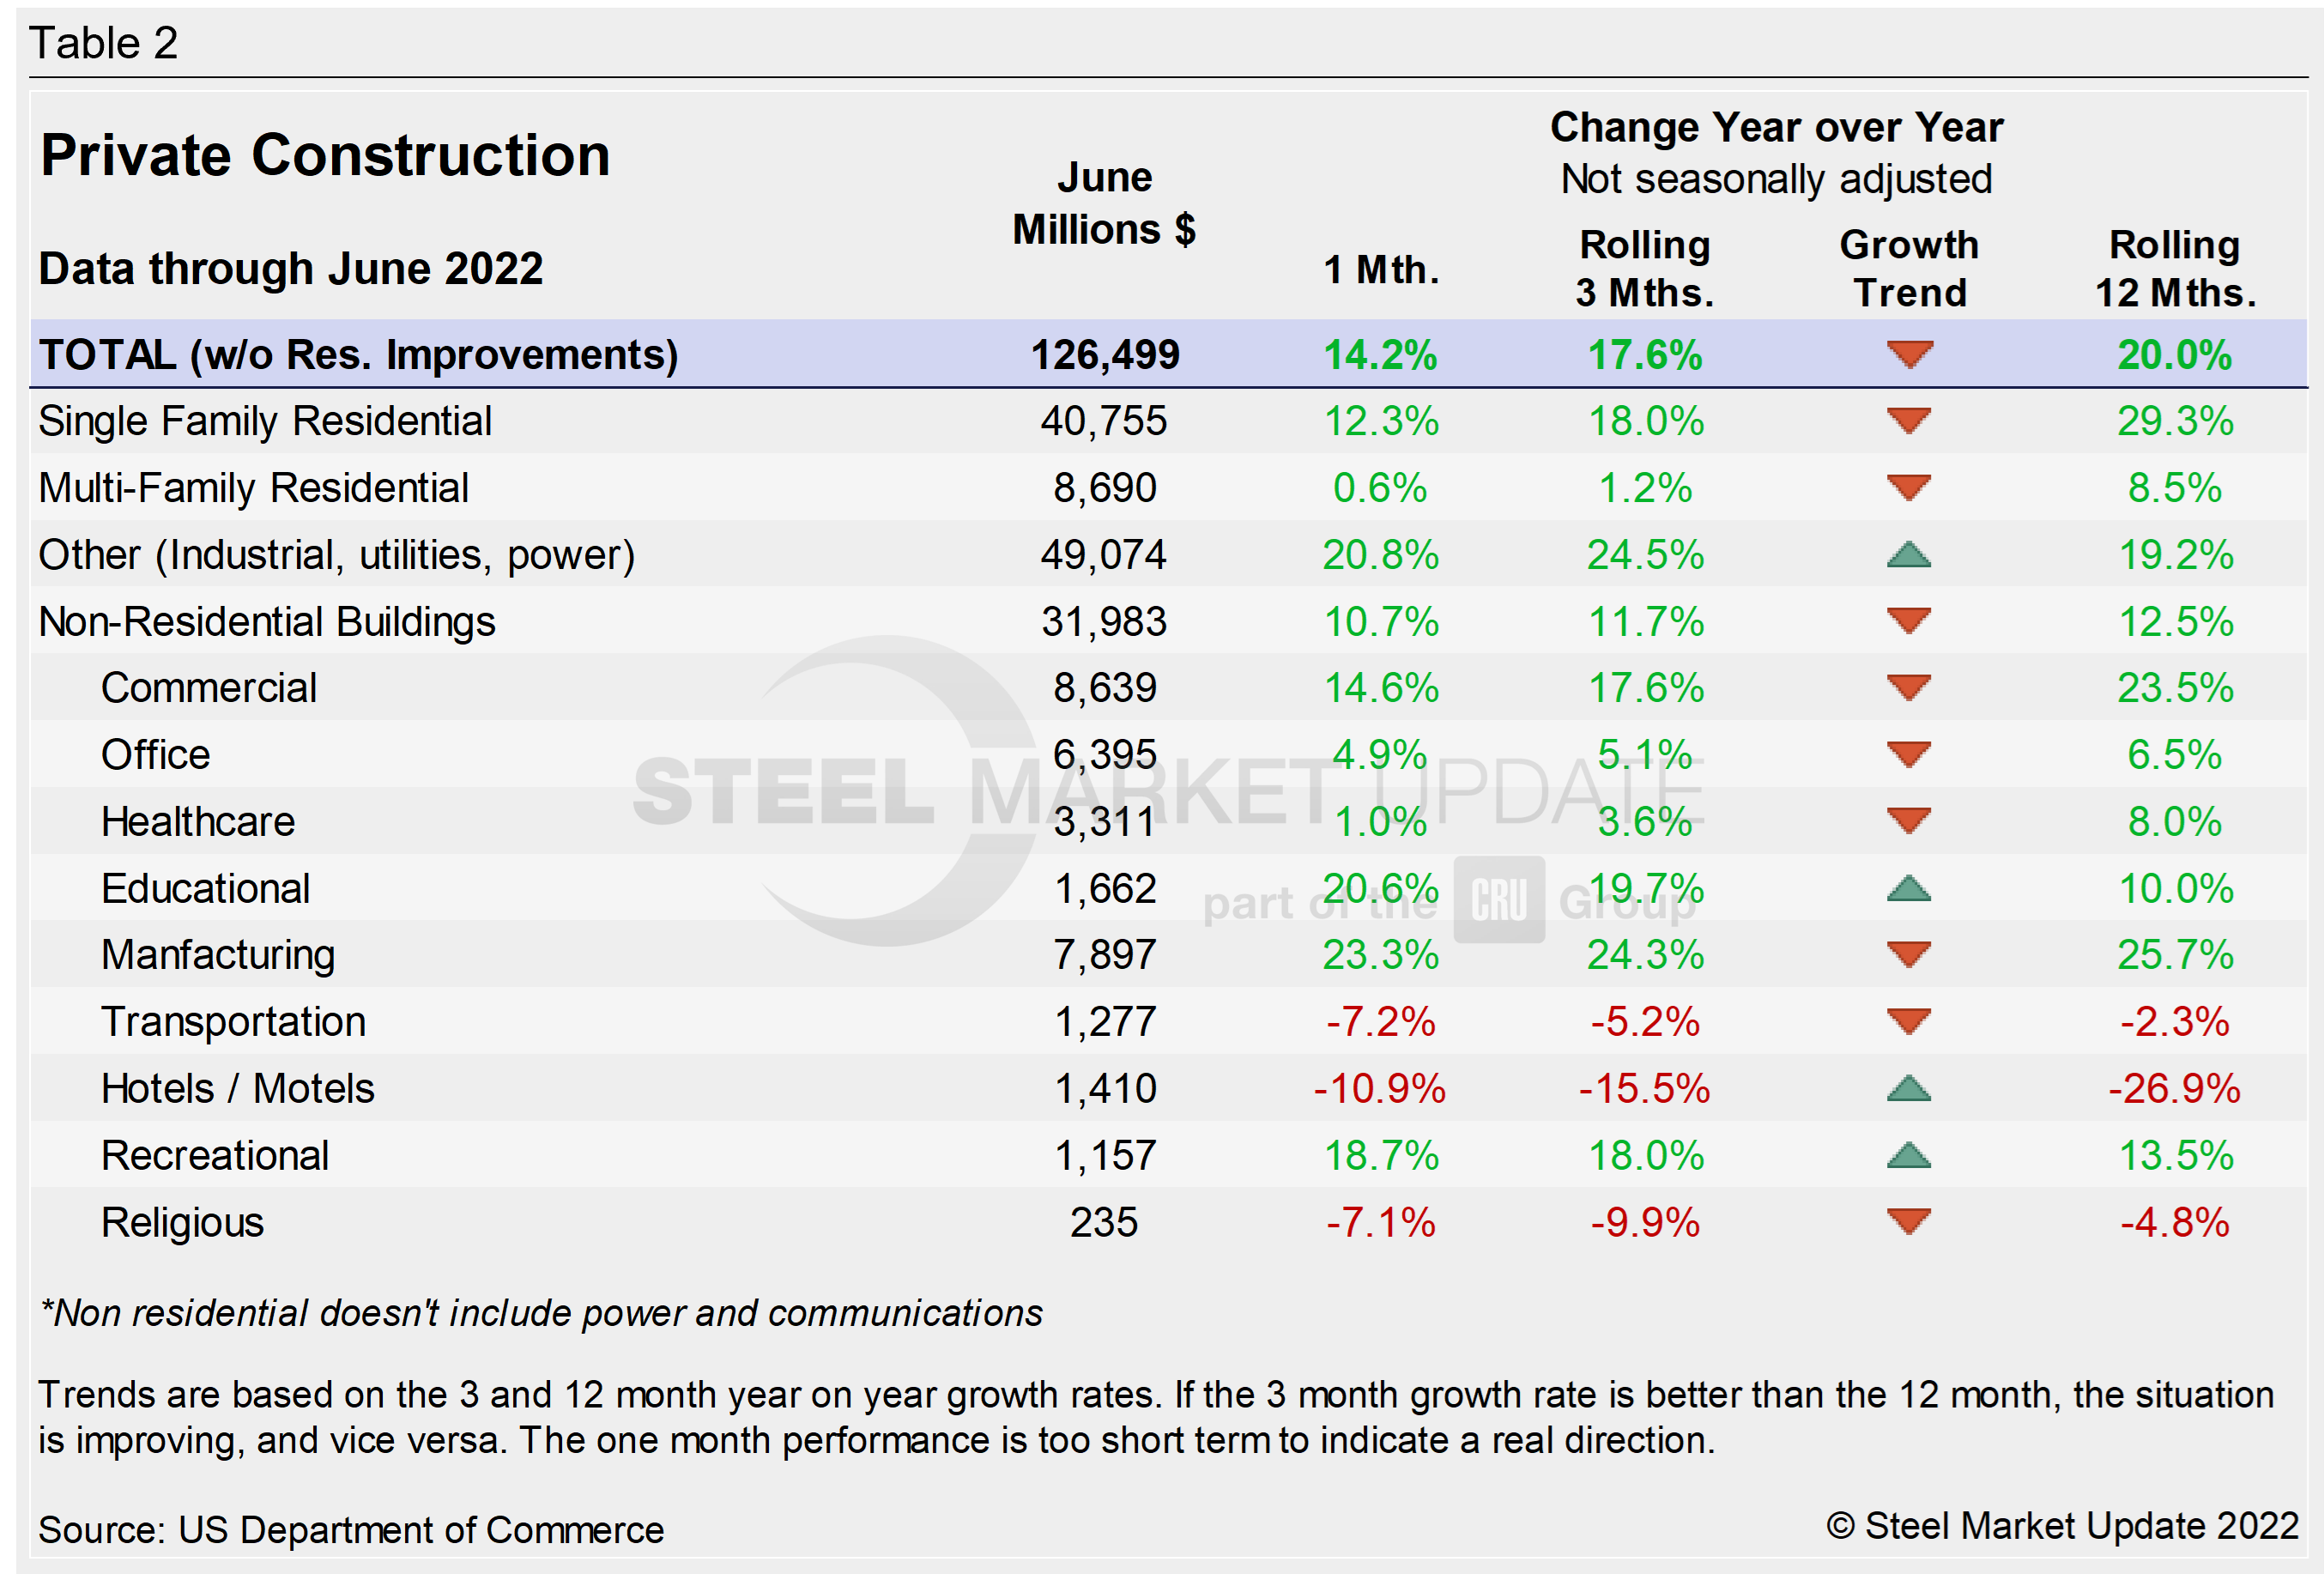
Private Construction
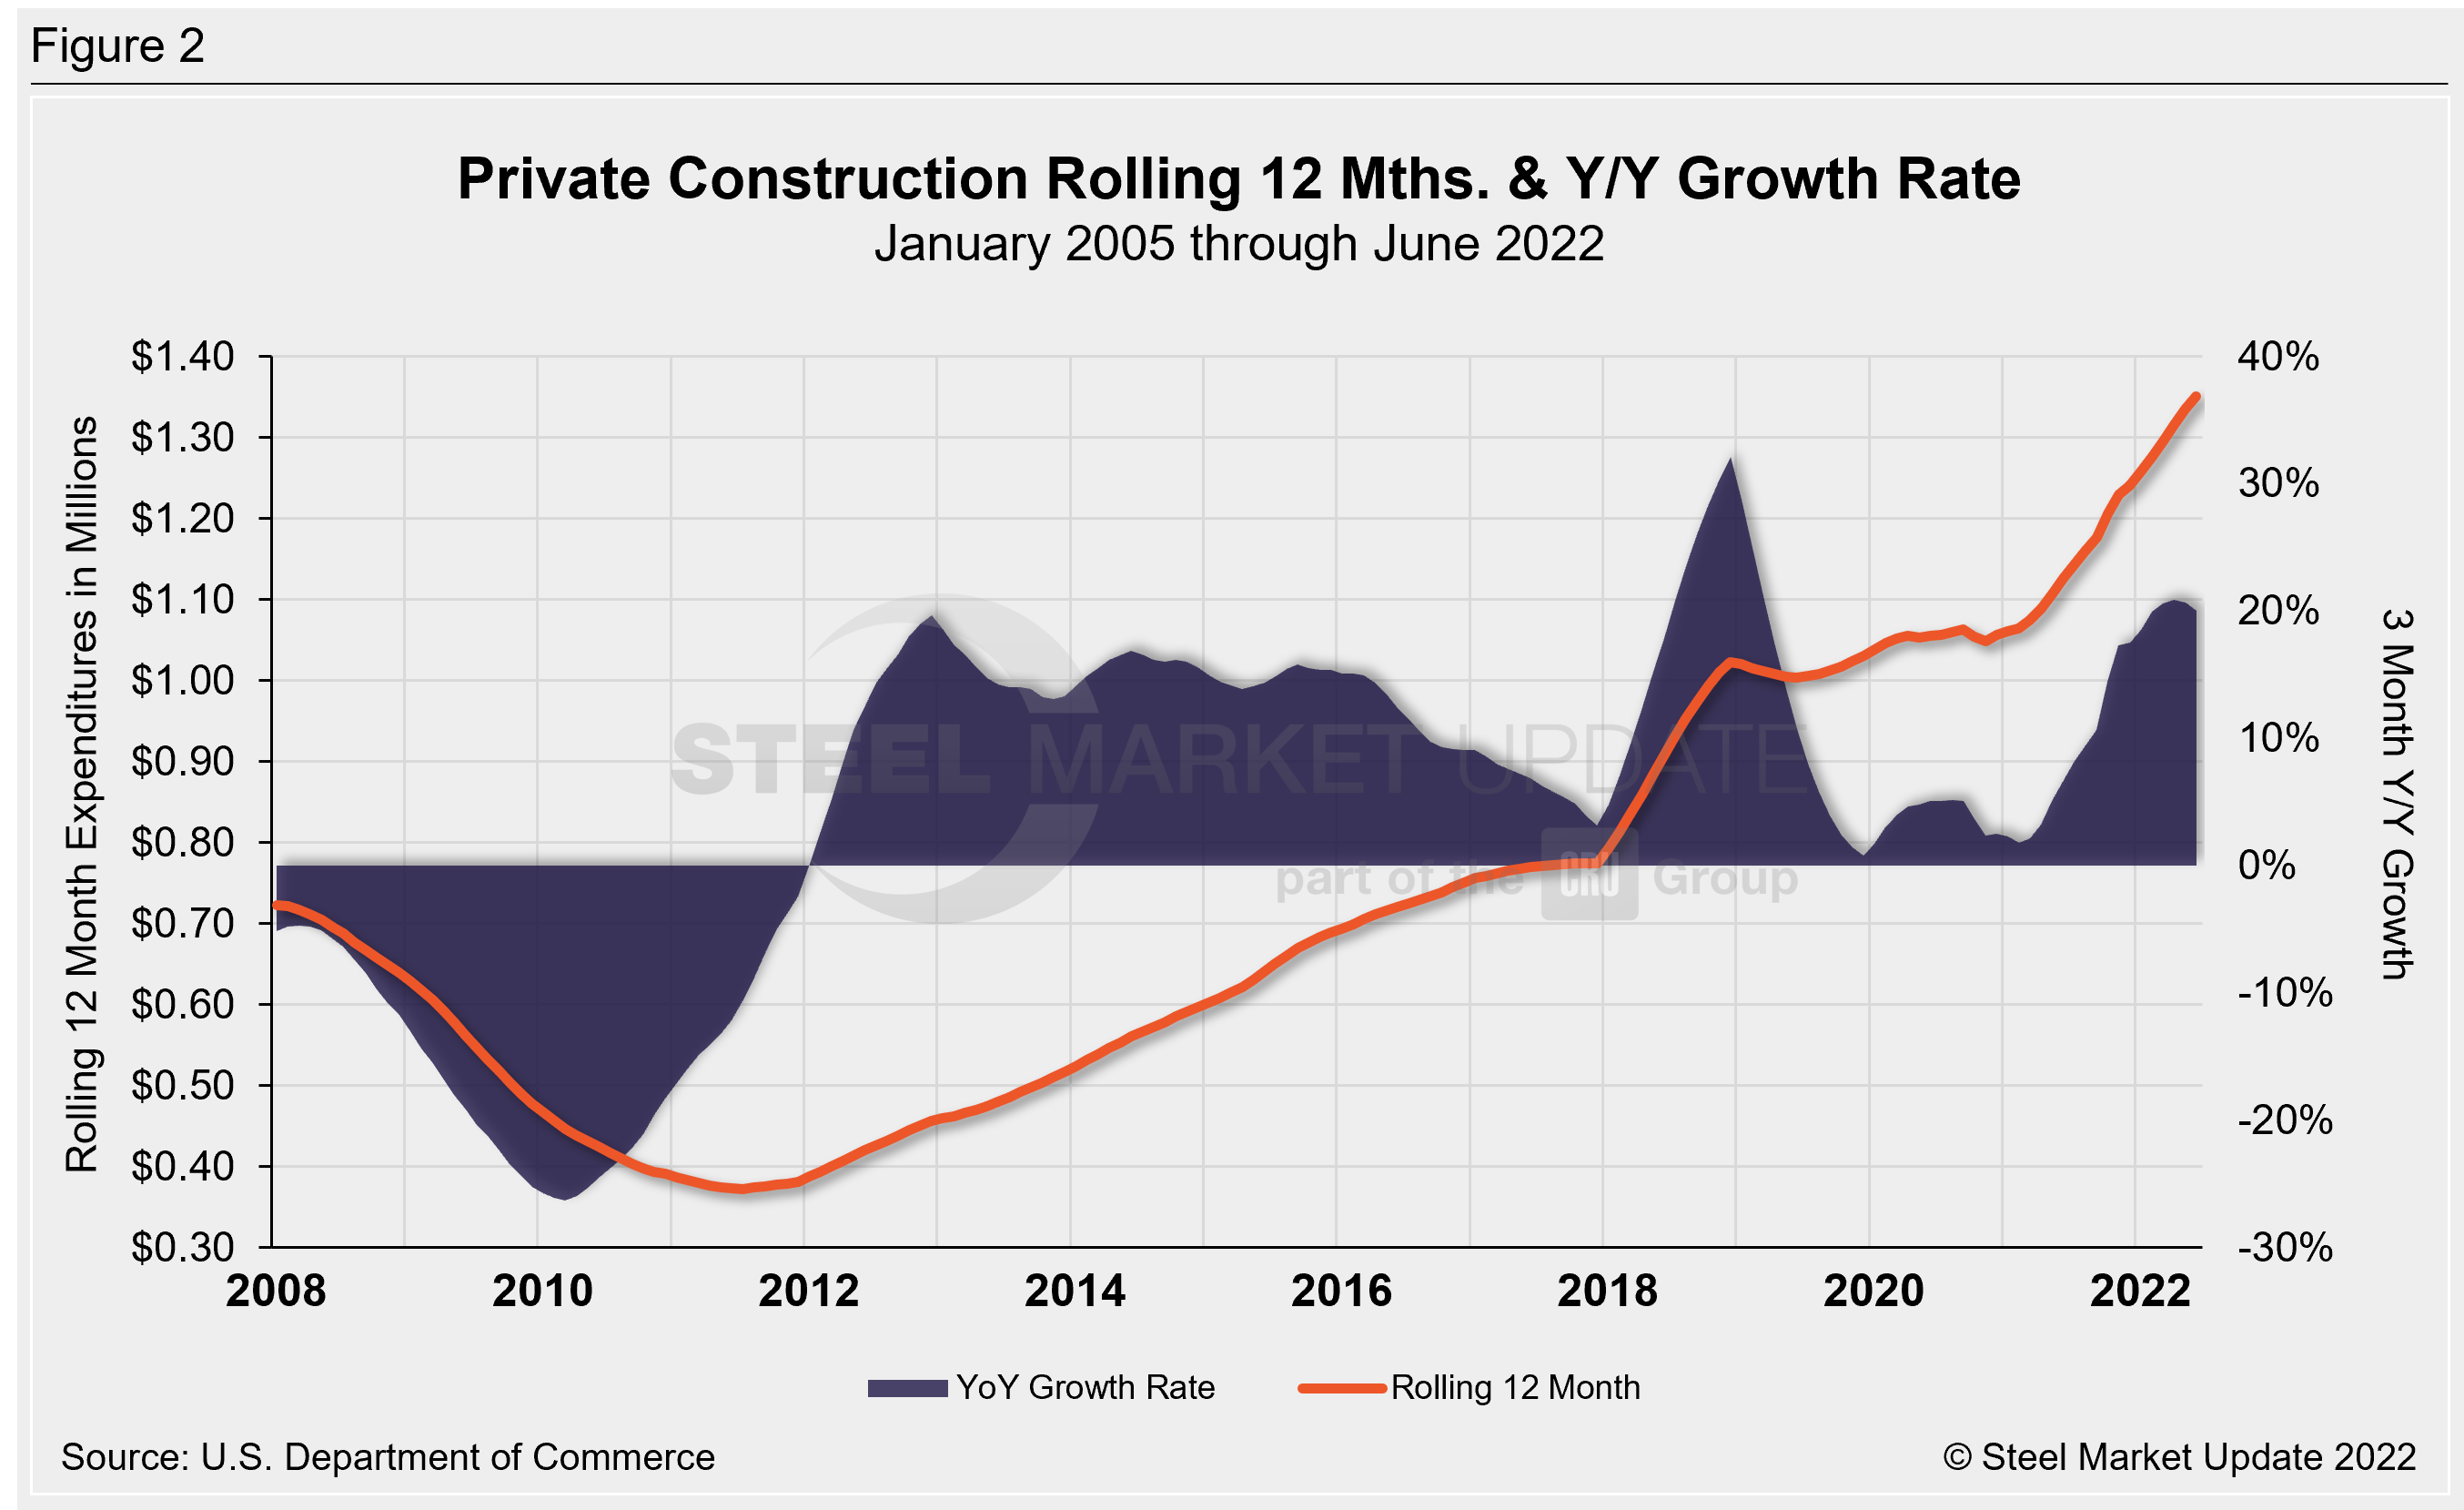
The breakdown of the $1.416 trillion private expenditures into residential and nonresidential, and their subsectors, is highlighted in Table 2 and Figure 2 below. Construction put in place in the private sector in June was down 1.3% from May’s upwardly revised estimate of $1.434 trillion.
Within that category, residential construction was at a seasonally adjusted annual rate of $923.7 billion in June, 1.6% below the revised May estimate of $939.2 billion.
Residential spending contracted at its steepest pace in two years in the second quarter. That contributed to gross domestic product declining at an annualized rate of 0.9% last quarter after shrinking at a 1.6% pace in the January–March quarter.
Nonresidential construction was at a seasonally adjusted annual rate of $492.7 billion in June, 0.5% below the revised May estimate of $495.3 billion. Outlays on non-residential structures have declined for five straight quarters.
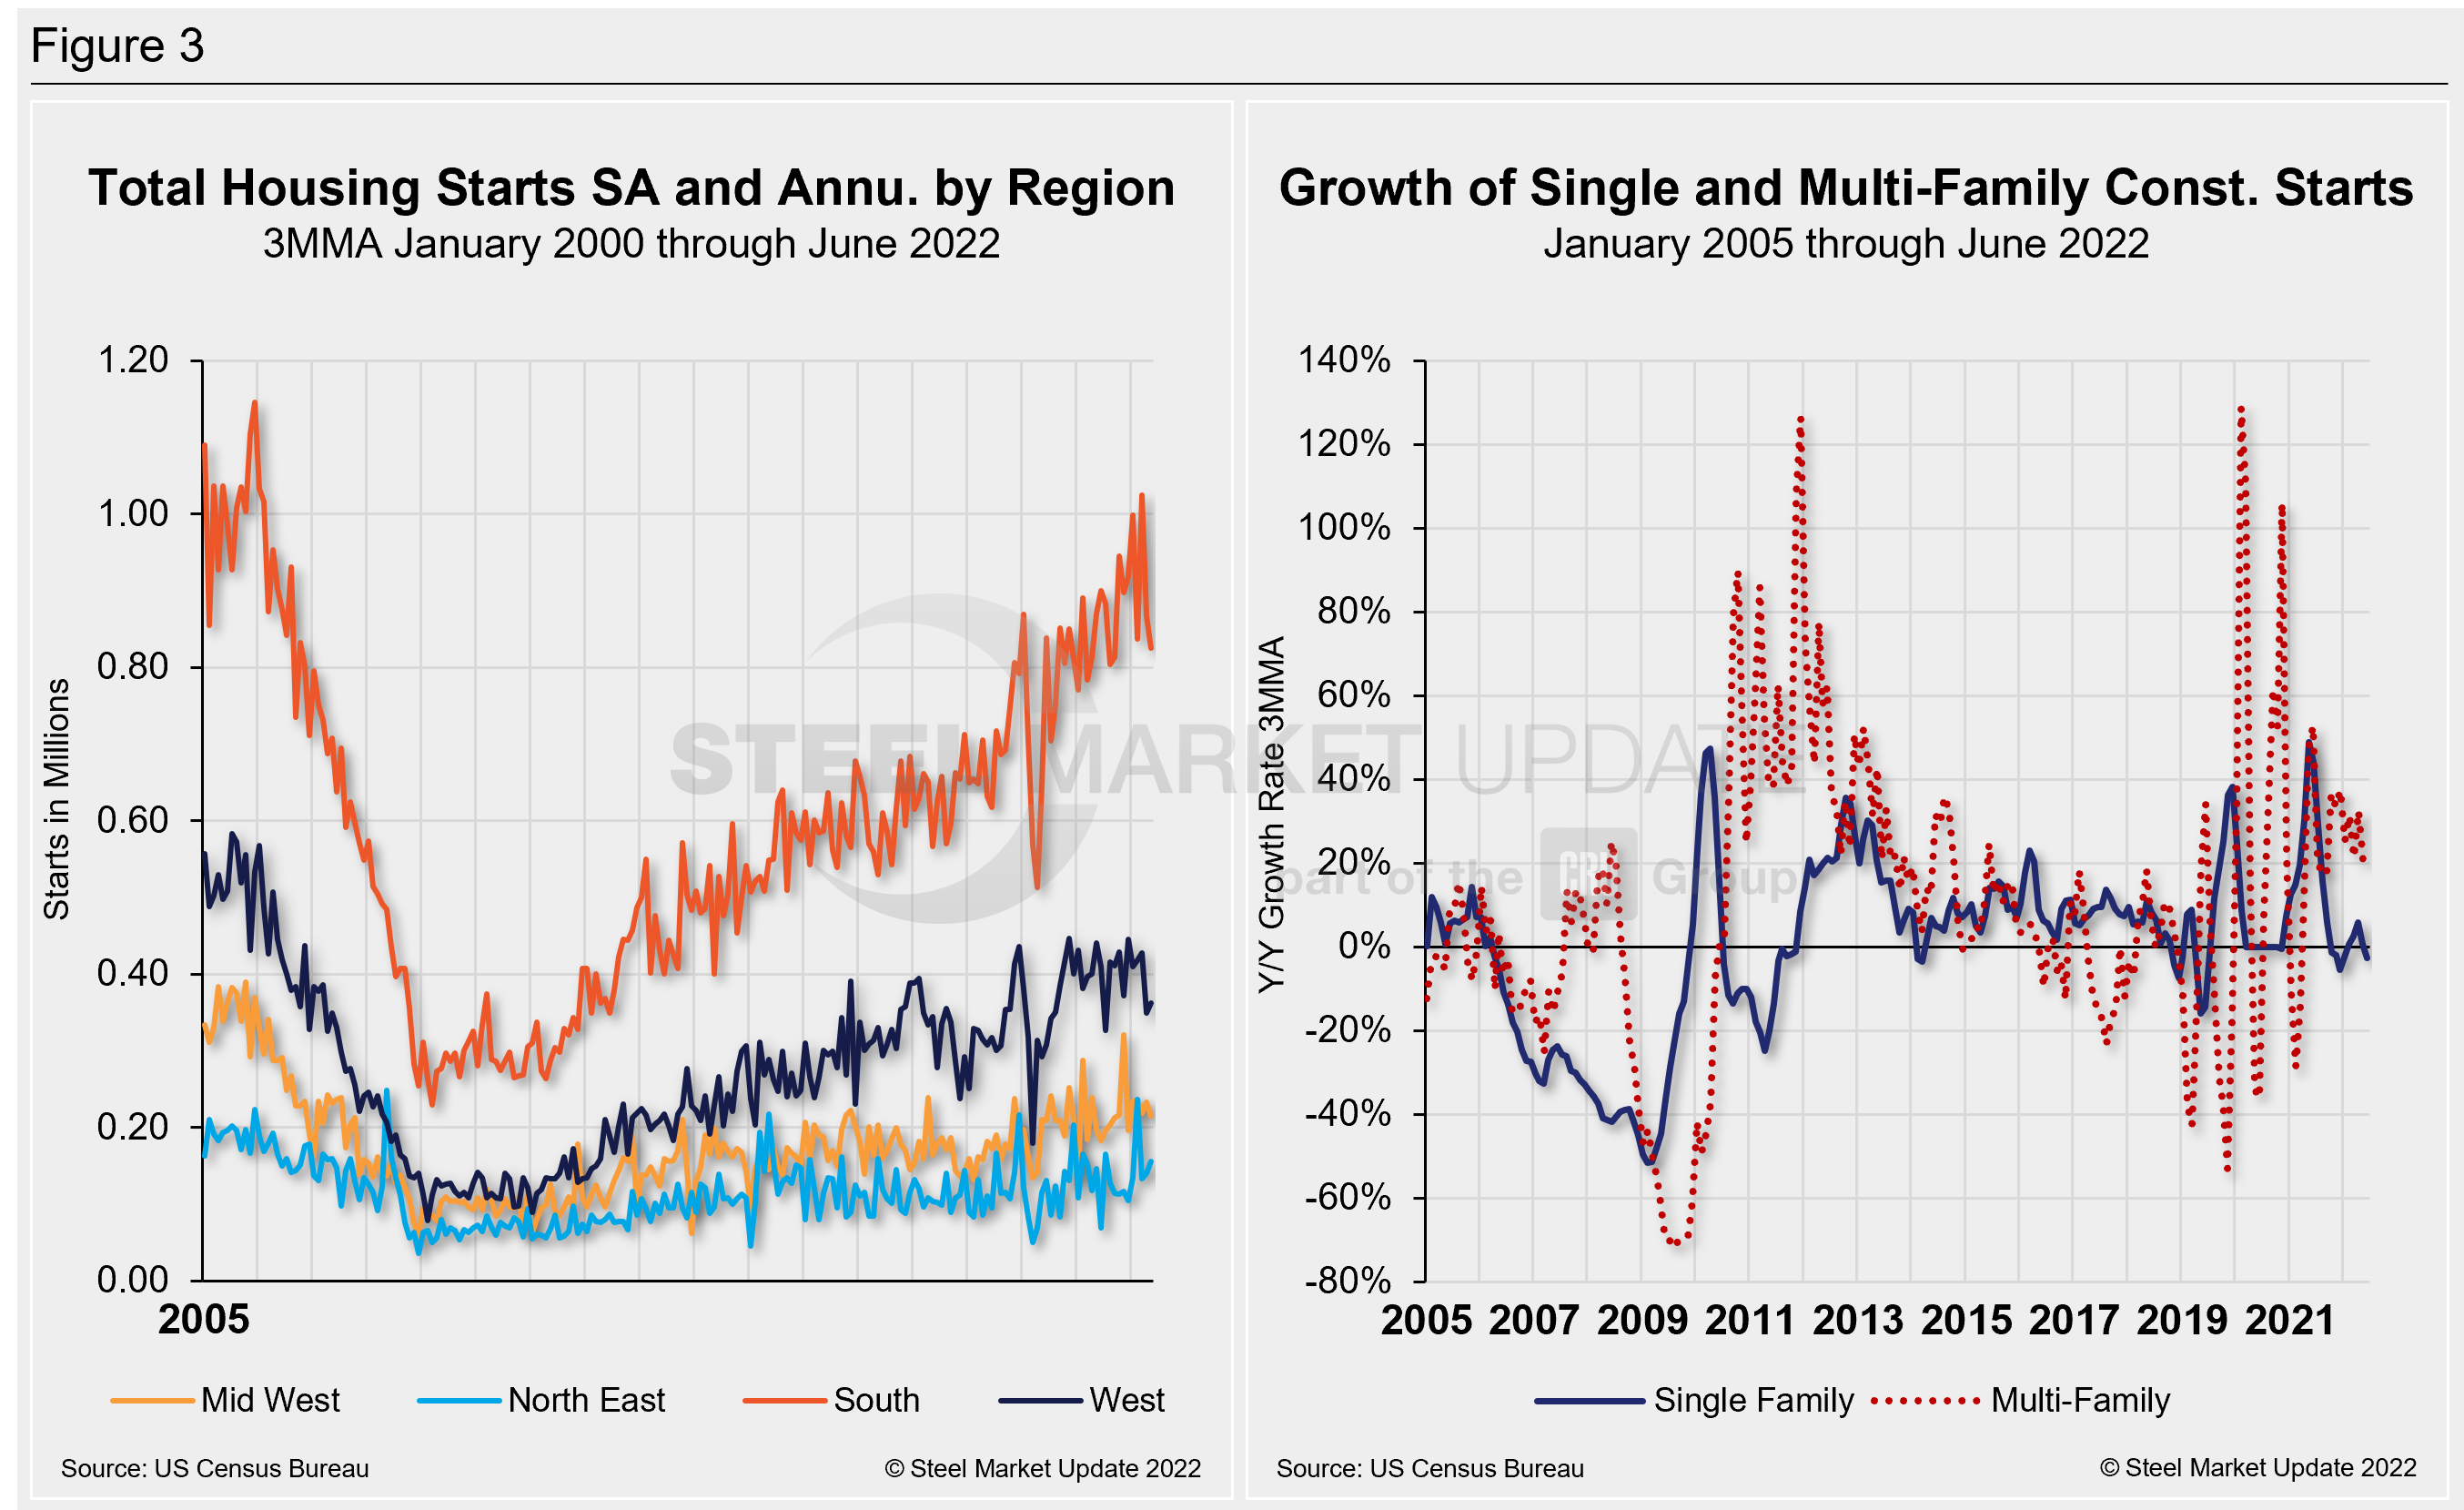
June’s homebuilding totals disappointed as growth stalled among residential segments. Builders are hitting the brakes as building costs rise and prospective buyers get priced out of the market with rising interest rates. Total housing starts in four regions—the Midwest, Northeast, South, and West—are displayed below (Figure 3). It also displays the growth of single- and multi-family construction starts. Privately-owned housing starts in May were at a seasonally adjusted annual rate of 1.559 million, down 2.0% from the revised May estimate of 1.591 million, and falling for the second straight month.
Regional results were mixed. The South and Midwest were both down in June, while the Northeast and West rebounded. The South saw the largest decline in total starts in last month, 42,000 less starts MoM (-4.8%) to a total of 825,000 starts, while the Midwest saw the largest percentage decline during the same period, down 7.7% or 18,000 less starts MoM, totaling 215,000 starts in June.
The Northeast saw the greatest growth over the same period, up 10.6% or 15,000 more starts MoM to a total of 156,000. The West was up 3.7% with 13,000 more starts in June versus May at a sum of 363,000.
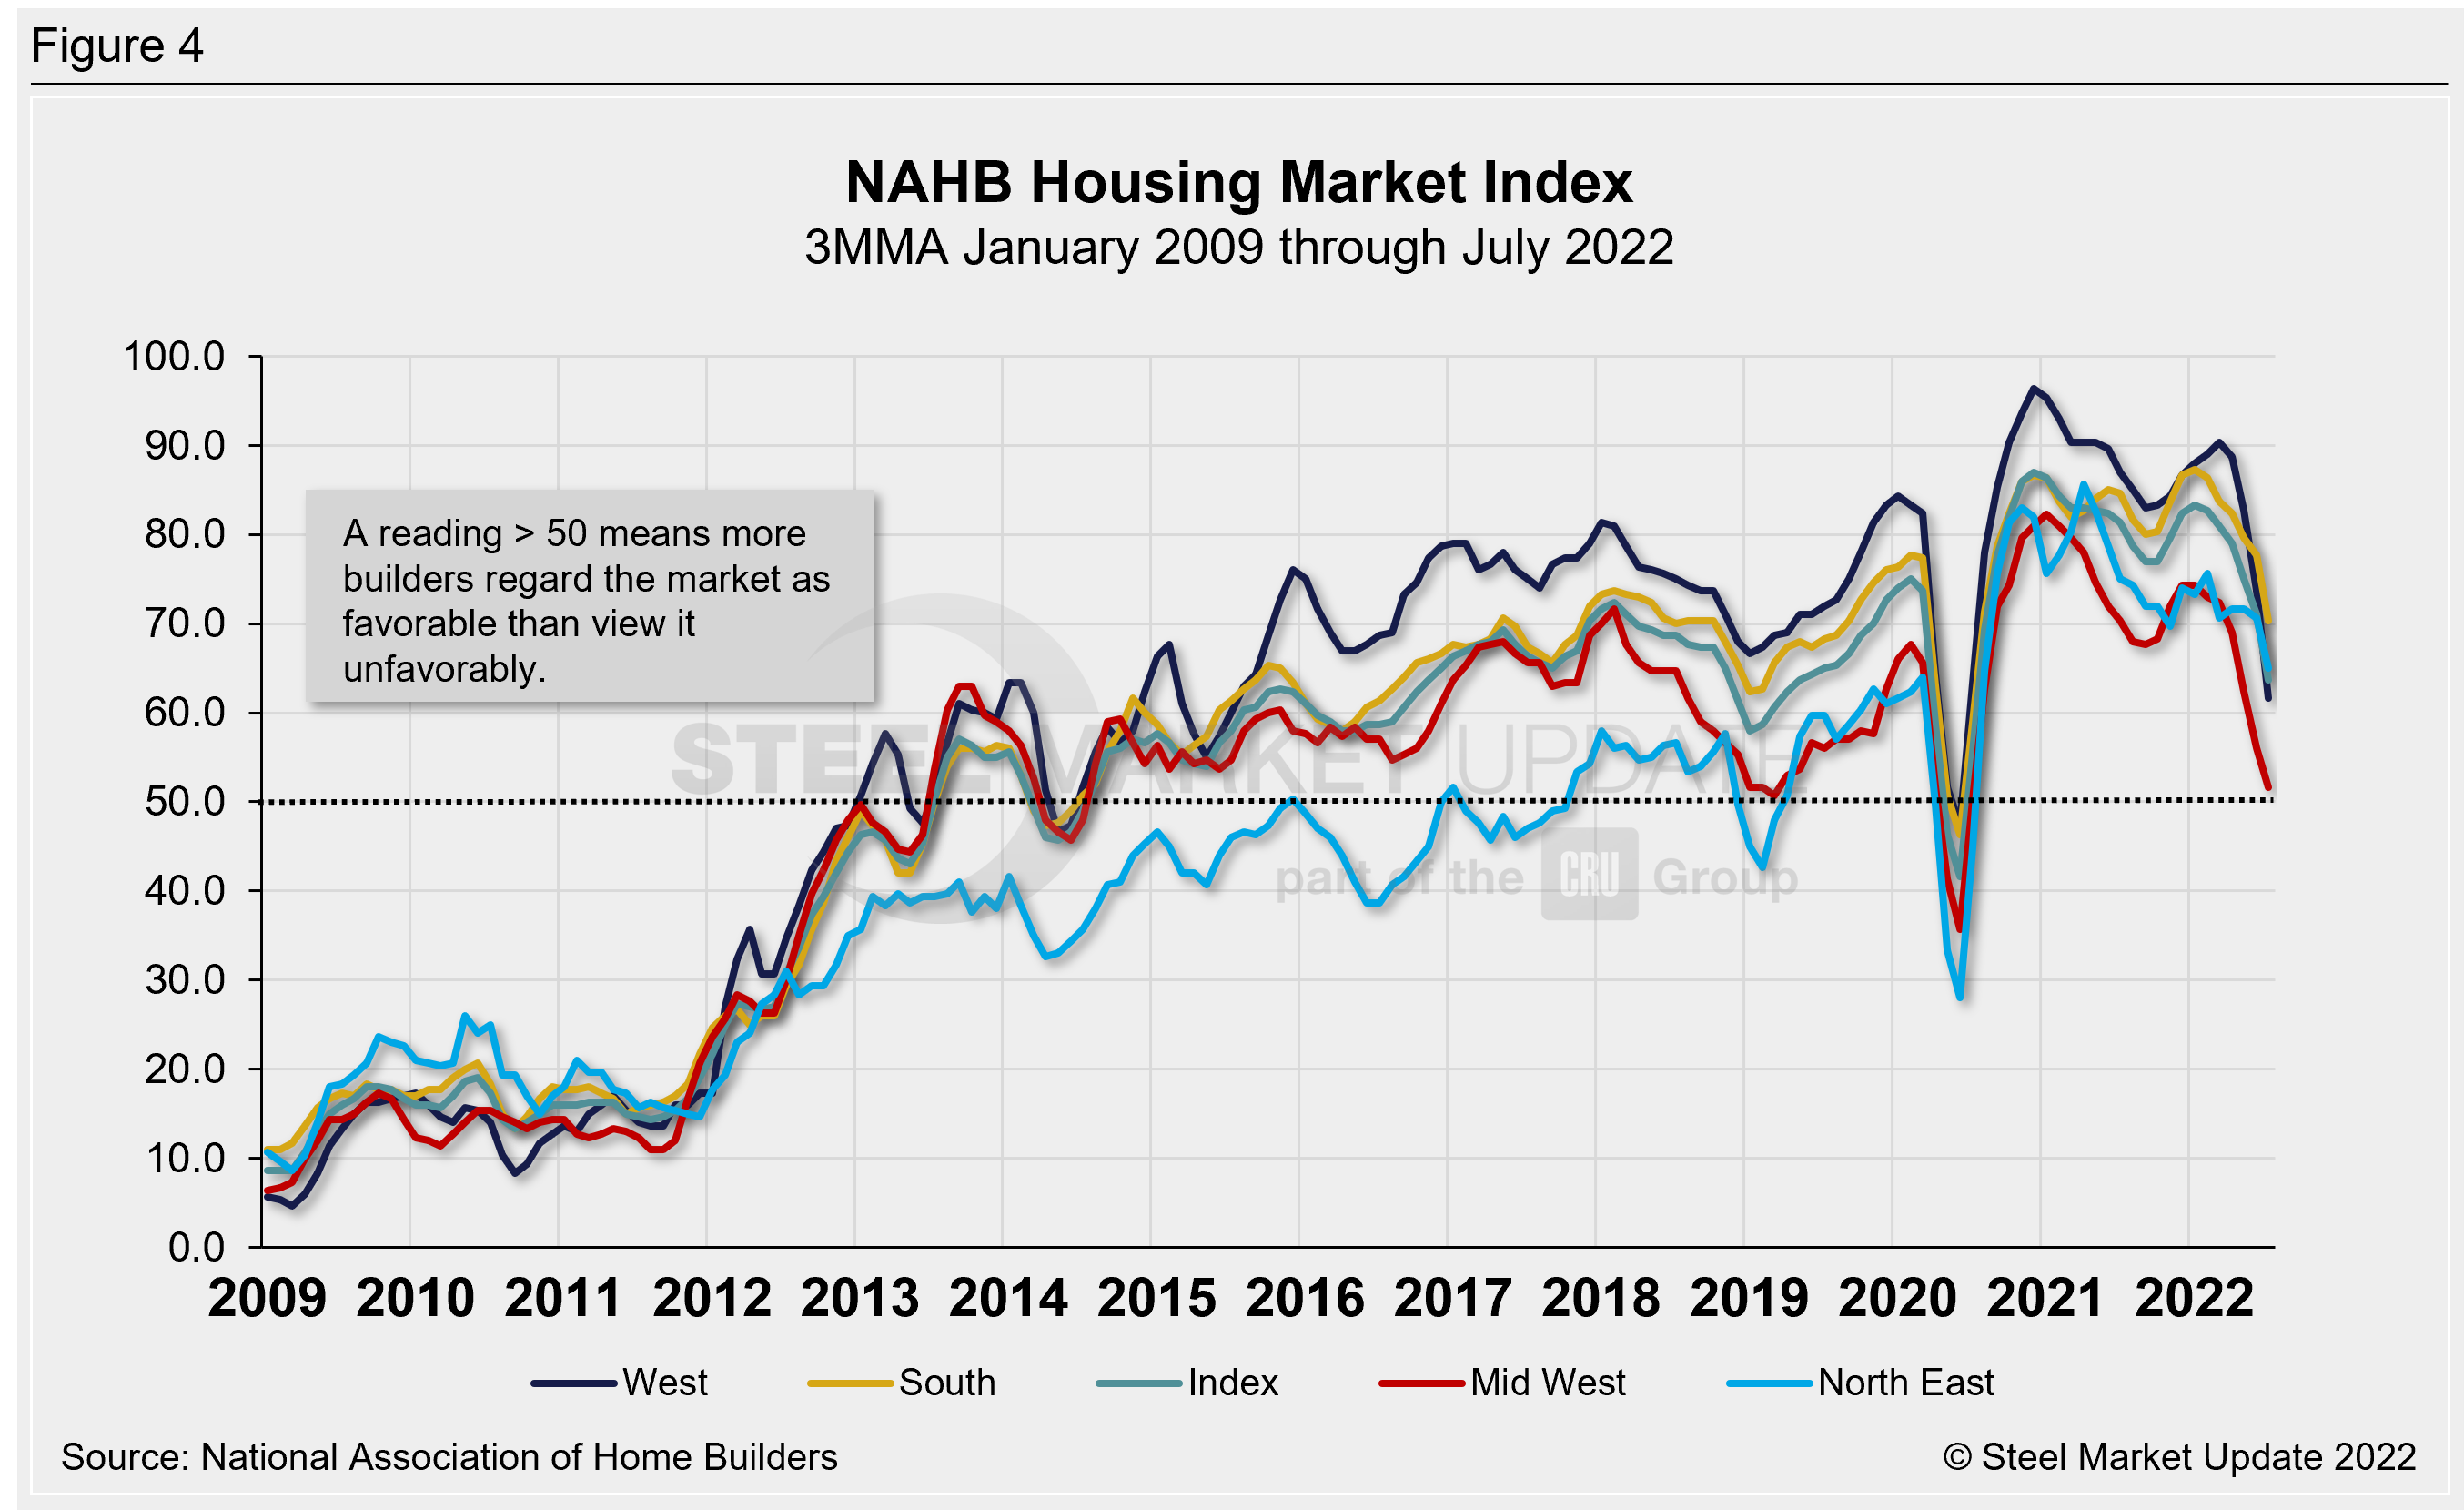
The National Association of Homebuilders (NAHB) said that prices for construction materials have increased by more than 20% in the past year, during a period of intense demand and insufficient supply. That dynamic led to building material production bottlenecks, coupled with rising inflation, which are driving construction costs higher and further delaying projects. NAHB’s Optimism Index registered 67 in May, down from 69 in May, slipping for the sixth straight month. Advance reports indicate that the index fell further in July with a reading of 55—the second largest drop on record. (Figure 4).
State and Local Construction
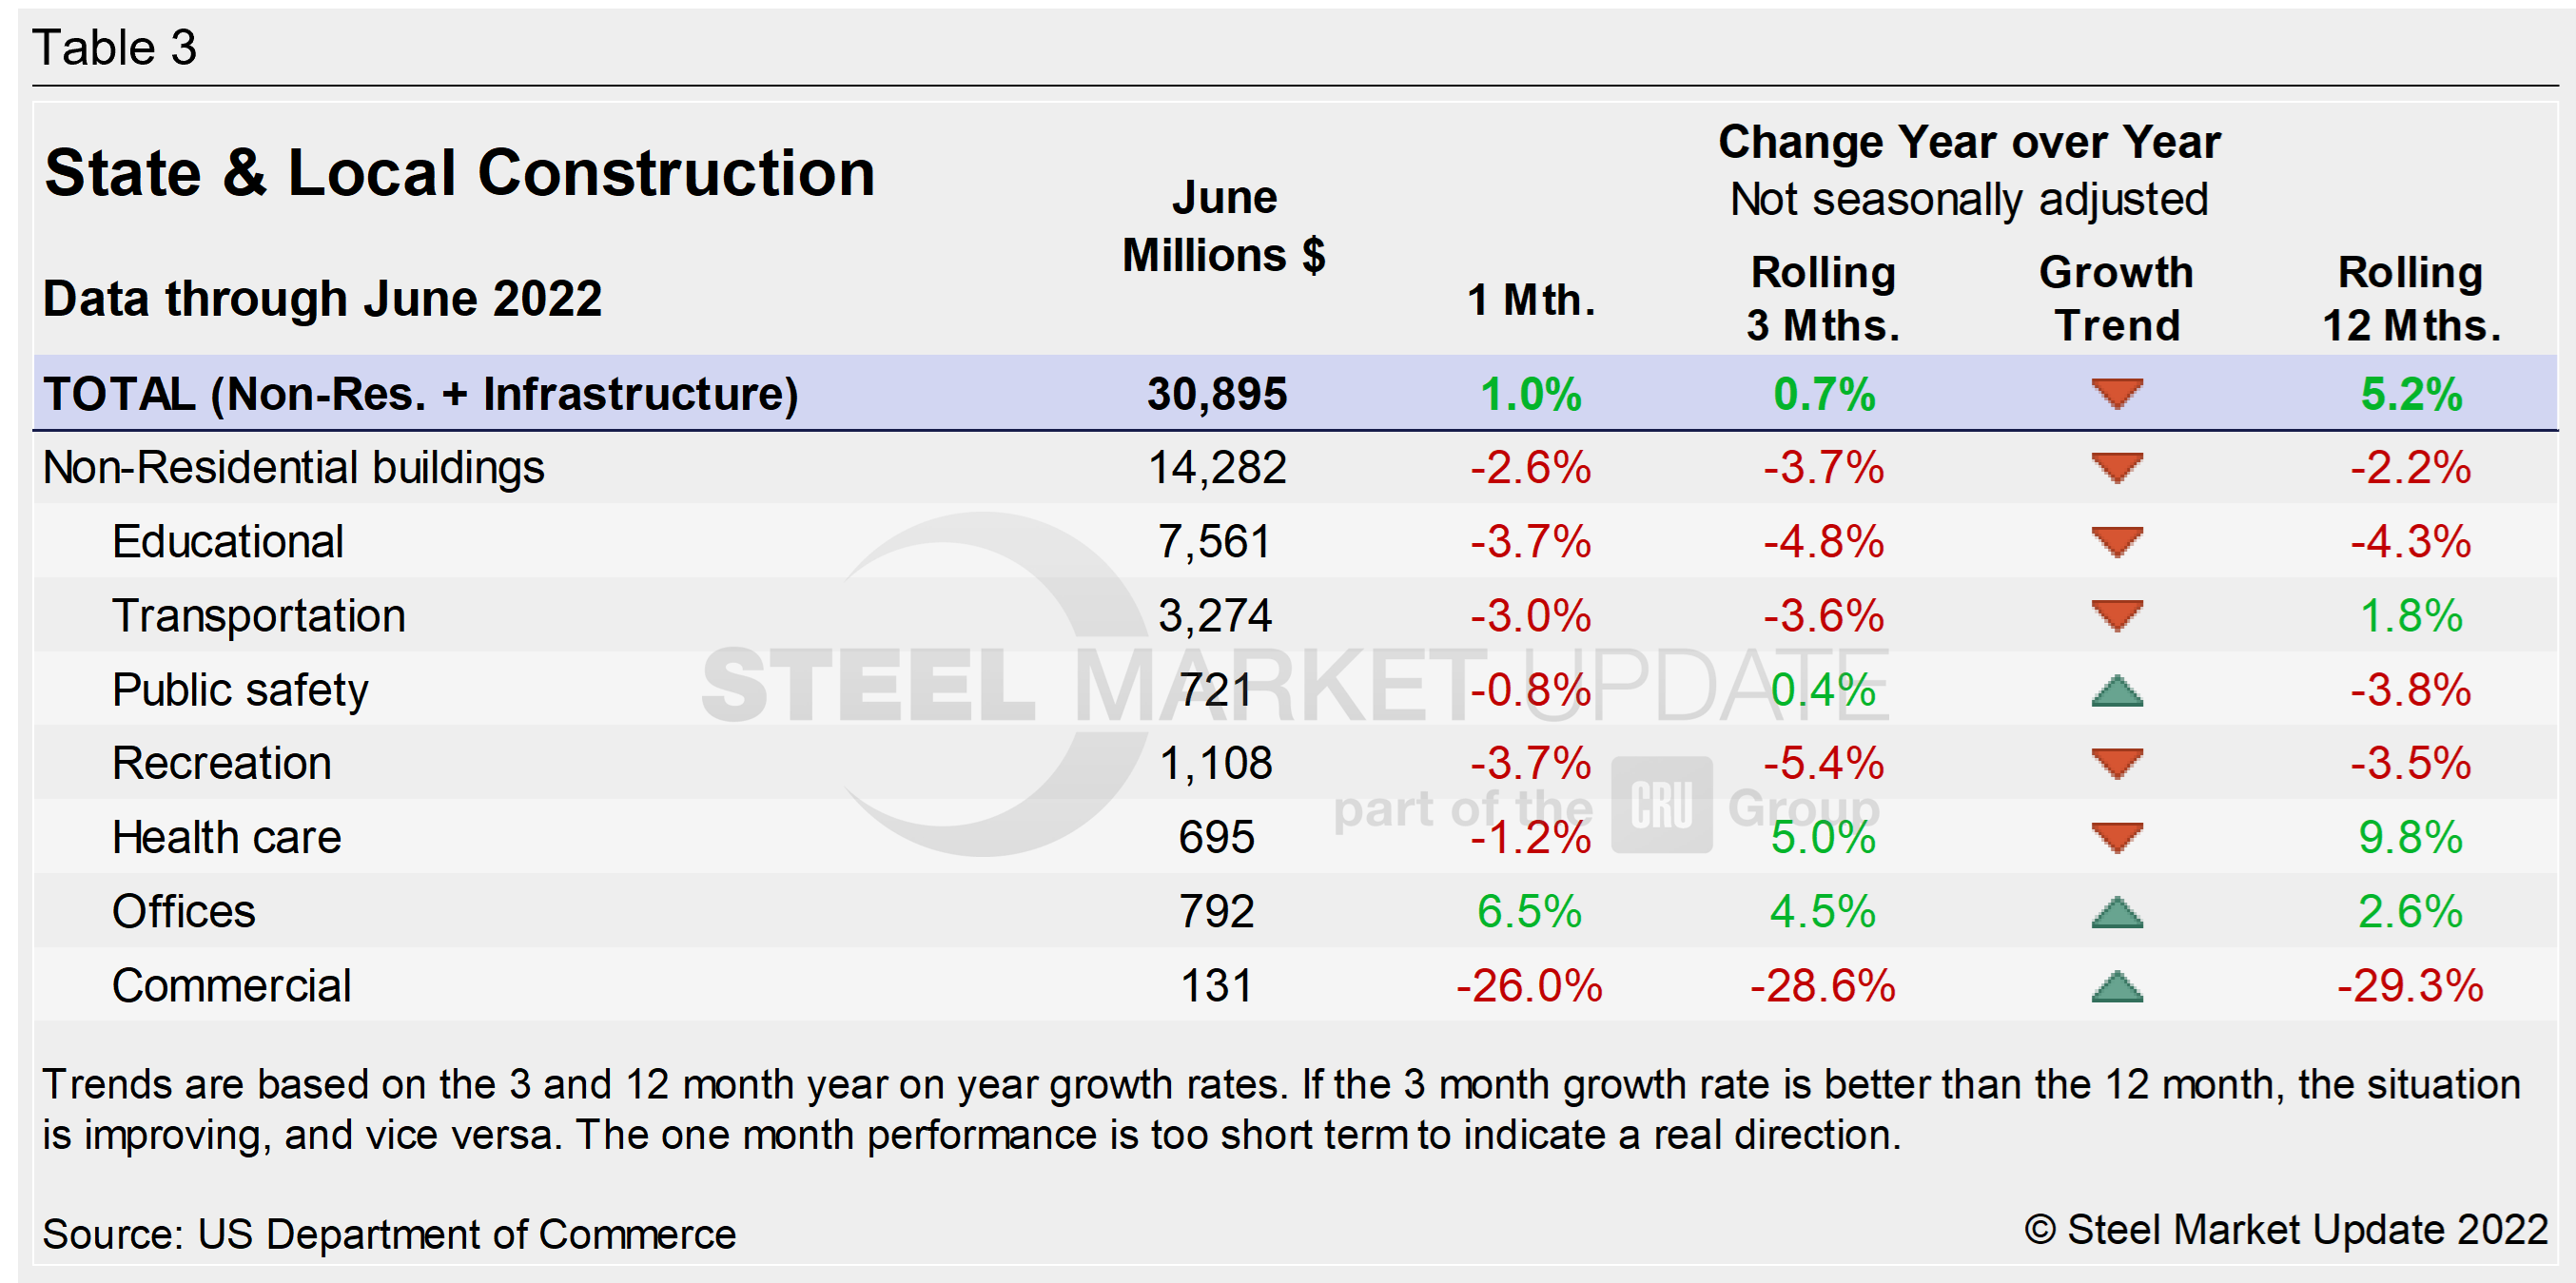
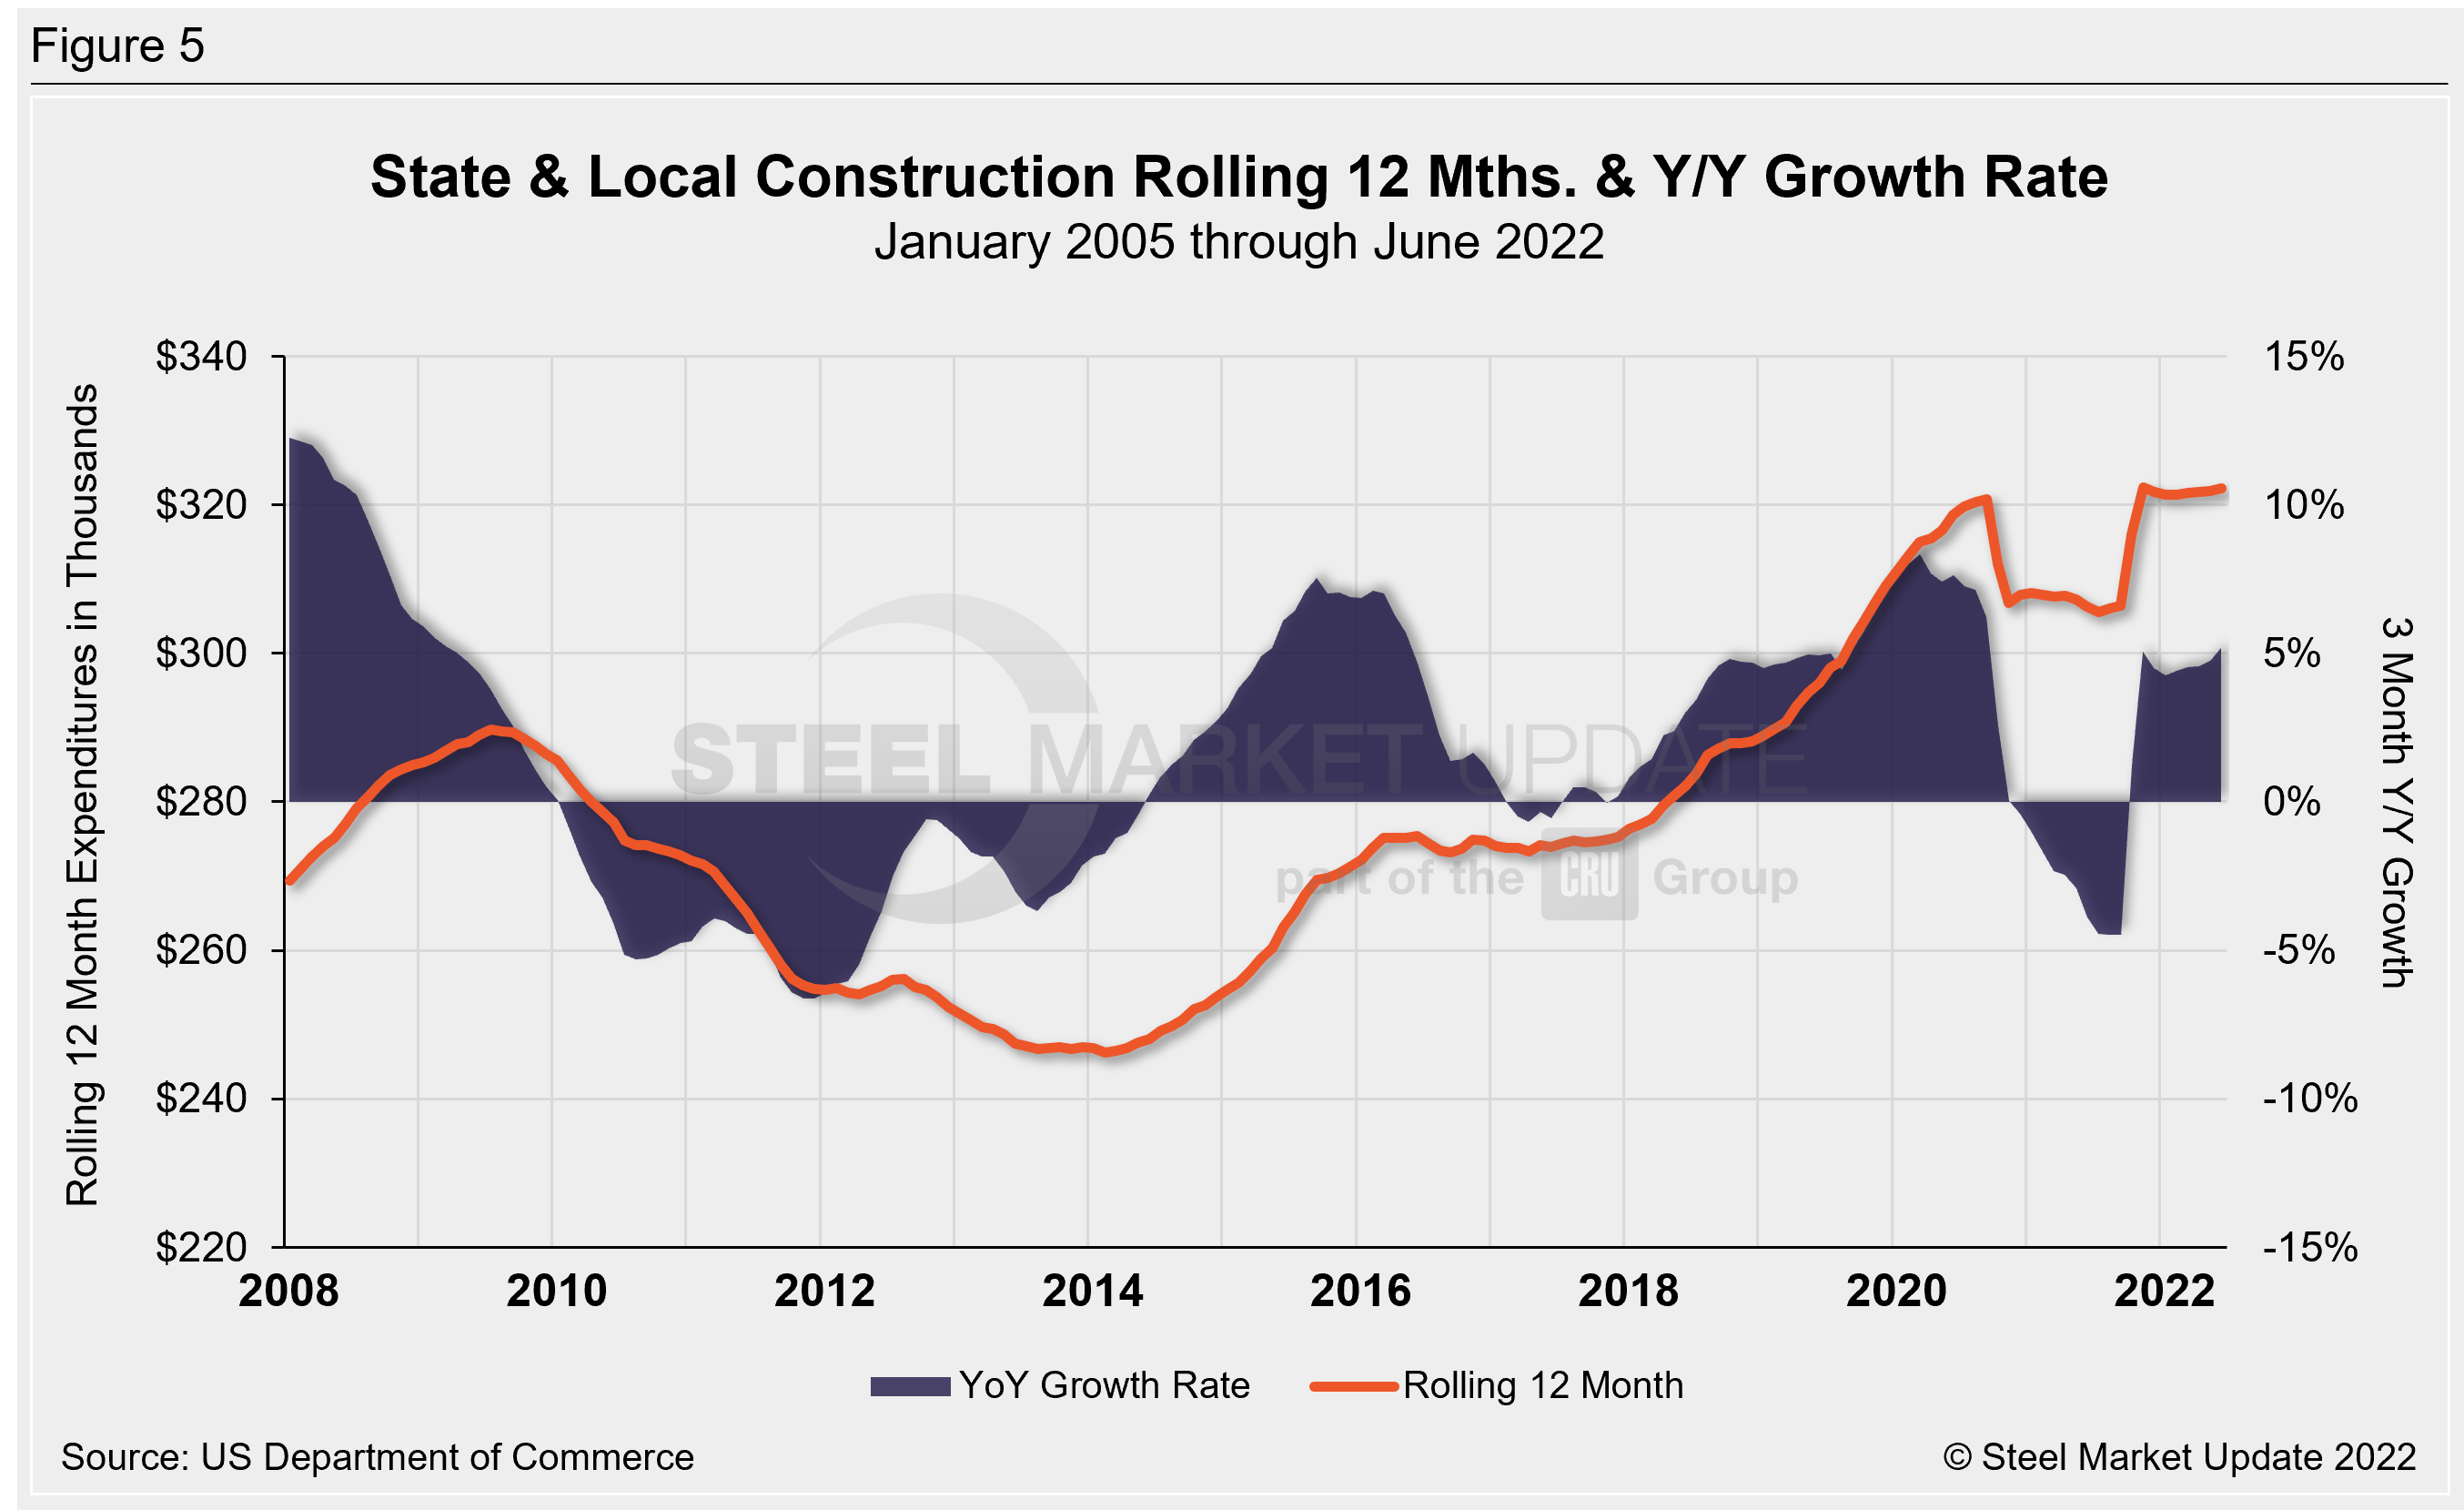
Publicly funded construction spending in June was $345.9 billion, at a seasonally adjusted rate, falling for the fifth straight month. June’s outlays dropped 0.5% after falling 0.7% in May. Investment in state and local government construction projects slipped 0.6%, while federal government spending increased 1.2% (see Table 3 and Figure 5 below).
Educational construction was at a seasonally adjusted annual rate of $77.5 billion, 0.7% below the revised May estimate of $78.1 billion. Highway construction was at a seasonally adjusted annual rate of $97.4 billion, 2.7% below the revised May estimate of $100.1 billion.
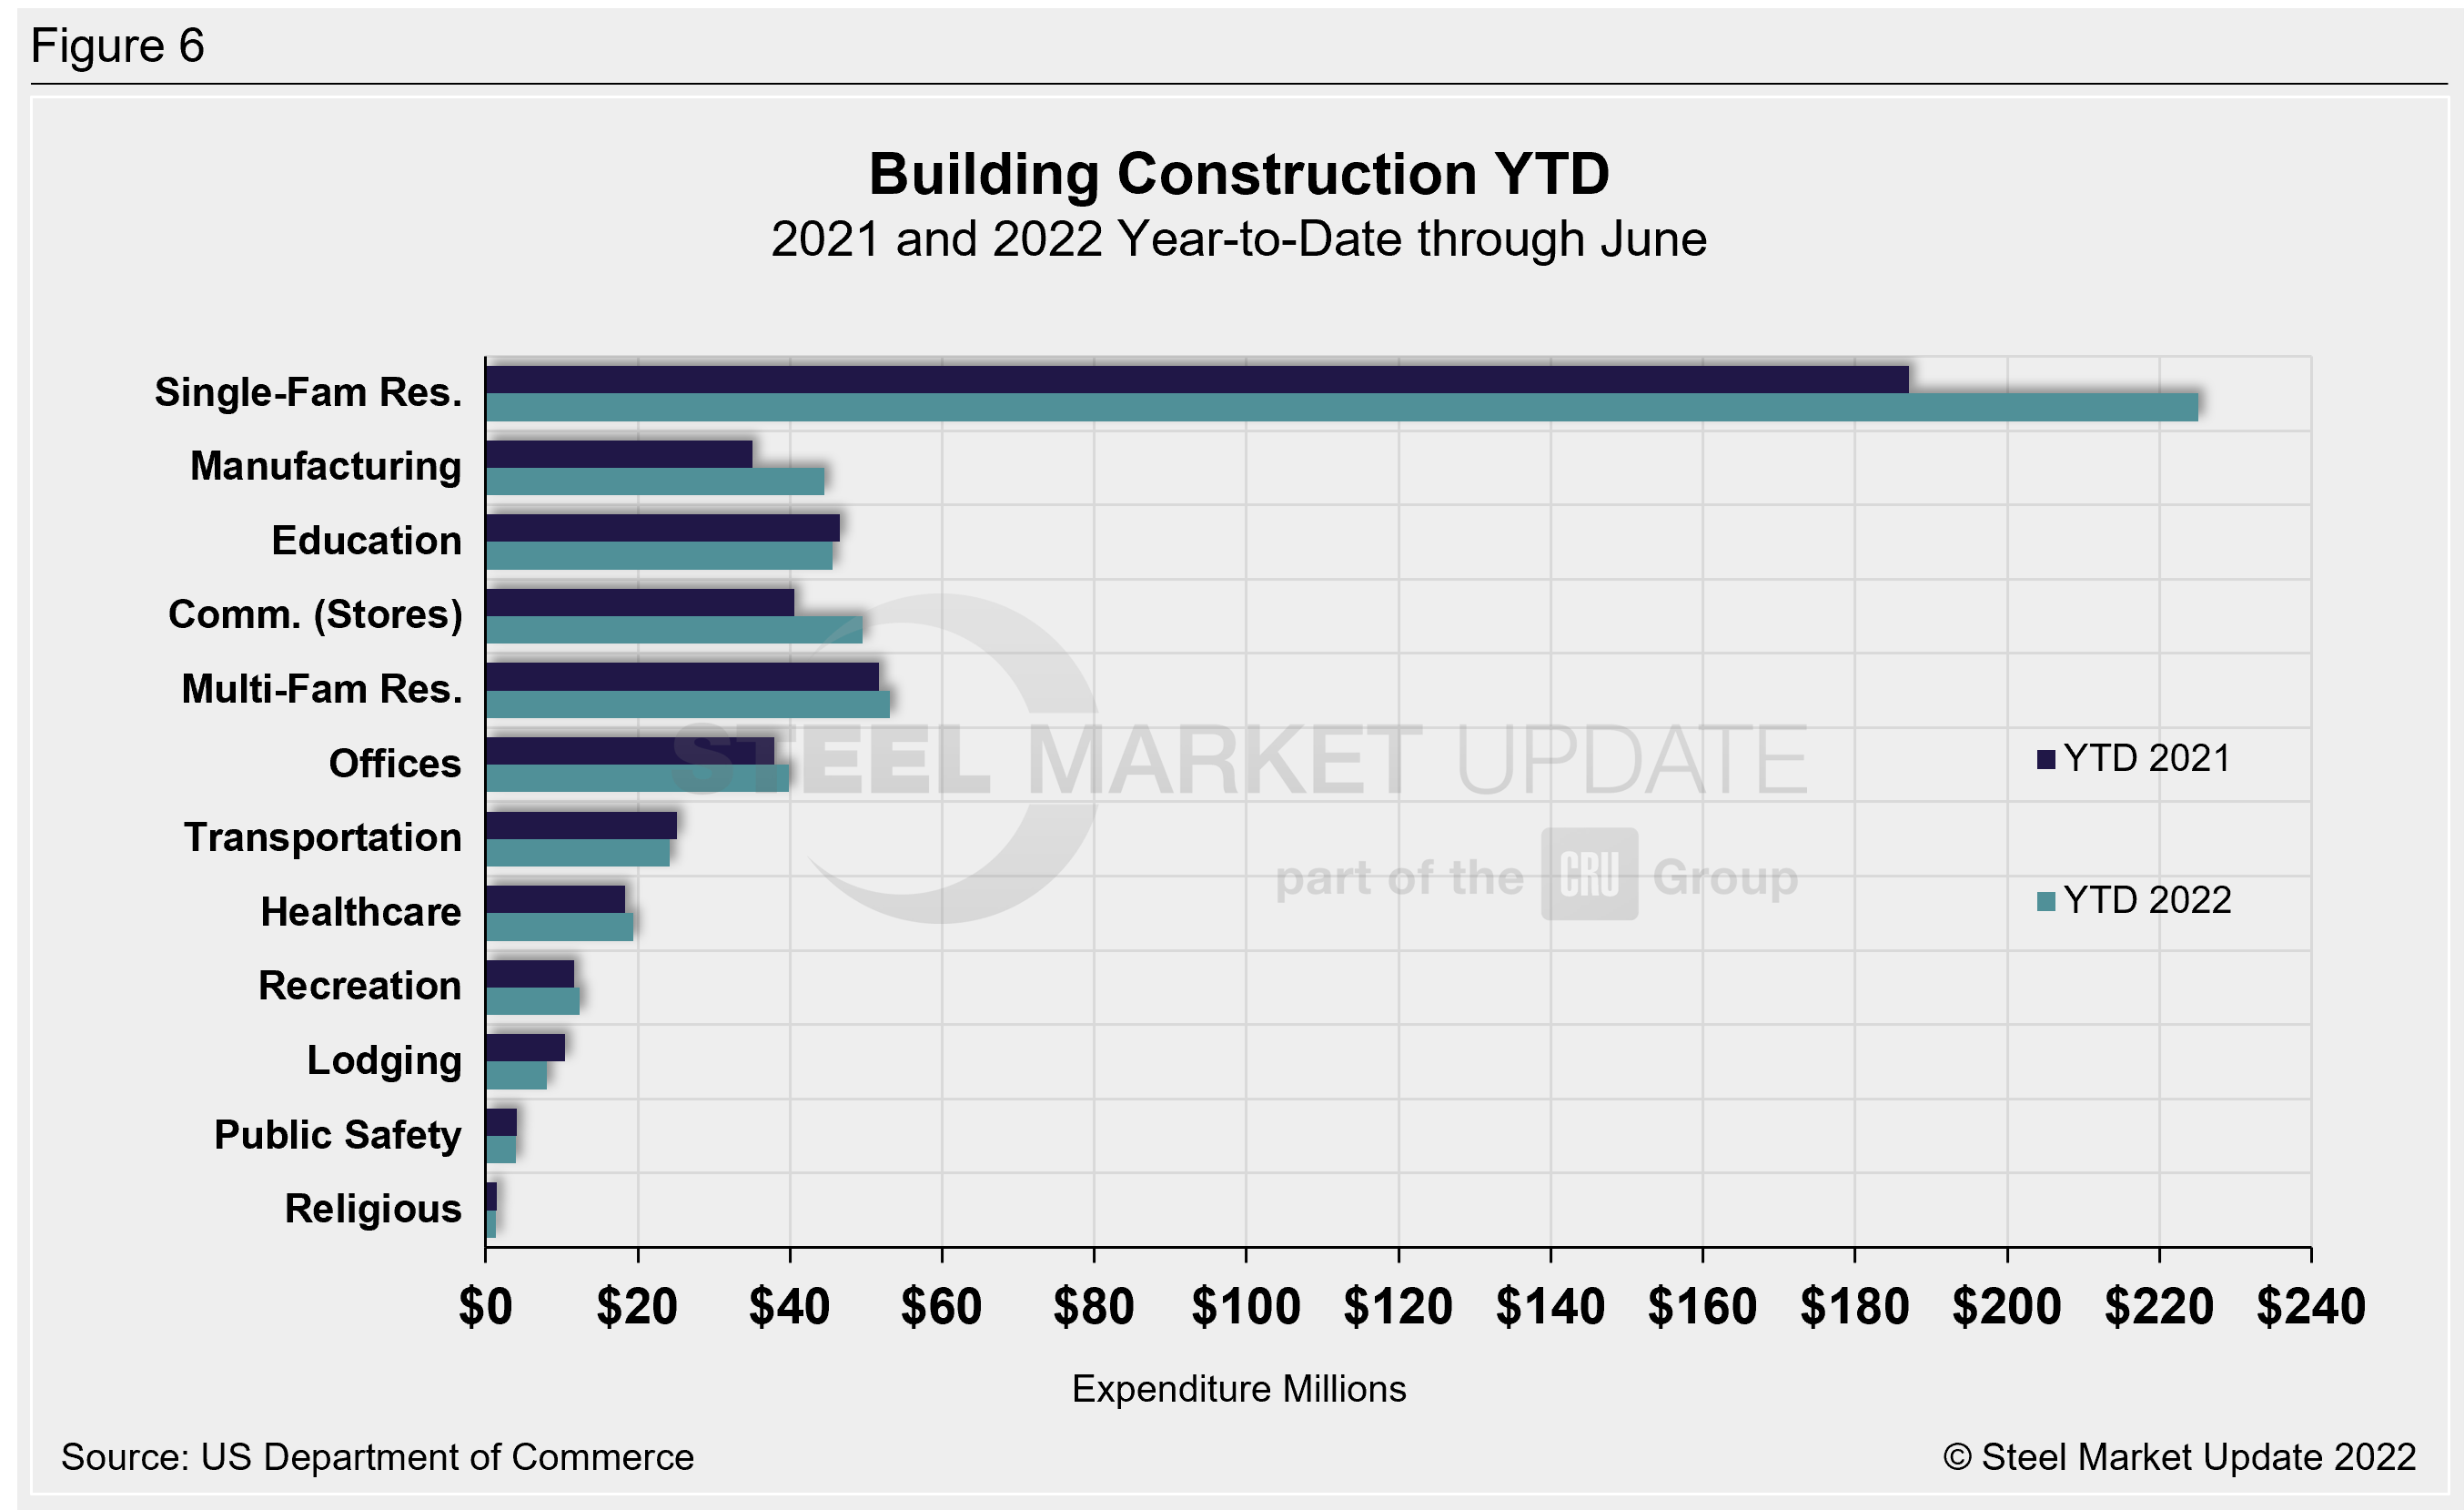
Year-to-date expenditures for construction of the various building sectors for 2021 and 2022 are compared in Figure 6. Single-family residential construction was dominant in 2021, with expenditures totaling $409.9 billion.
The trend has continued into 2022: single-family residential totaled $225.1 billion through June, 20.3% above $187.1 billion a year ago. Manufacturing (+27%) saw the strongest subsector growth versus last year followed by commercial (+21.9%). Multifamily residential grew by 2.6% and totaled $53.1 billion when compared to the same year-ago period. Lodging is behind by double digits at -22.7% YoY, followed by religious and transportation, down by 10% and 4.2% respectively.
Explanation: Each month, the Commerce Department issues its Construction Put in Place (CPIP) data, usually on the first working day covering activity one month and one day earlier. There are three major categories based on funding source: private, state and local, and federal. Within these three groups are about 120 subcategories of construction projects. SMU analyzes the expenditures from the three funding categories to provide a concise summary of the steel-consuming sectors.
By David Schollaert, David@SteelMarketUpdate.com


