

Market Data

August 9, 2022
US Jobs Creation Beats Expectations in July
Written by David Schollaert
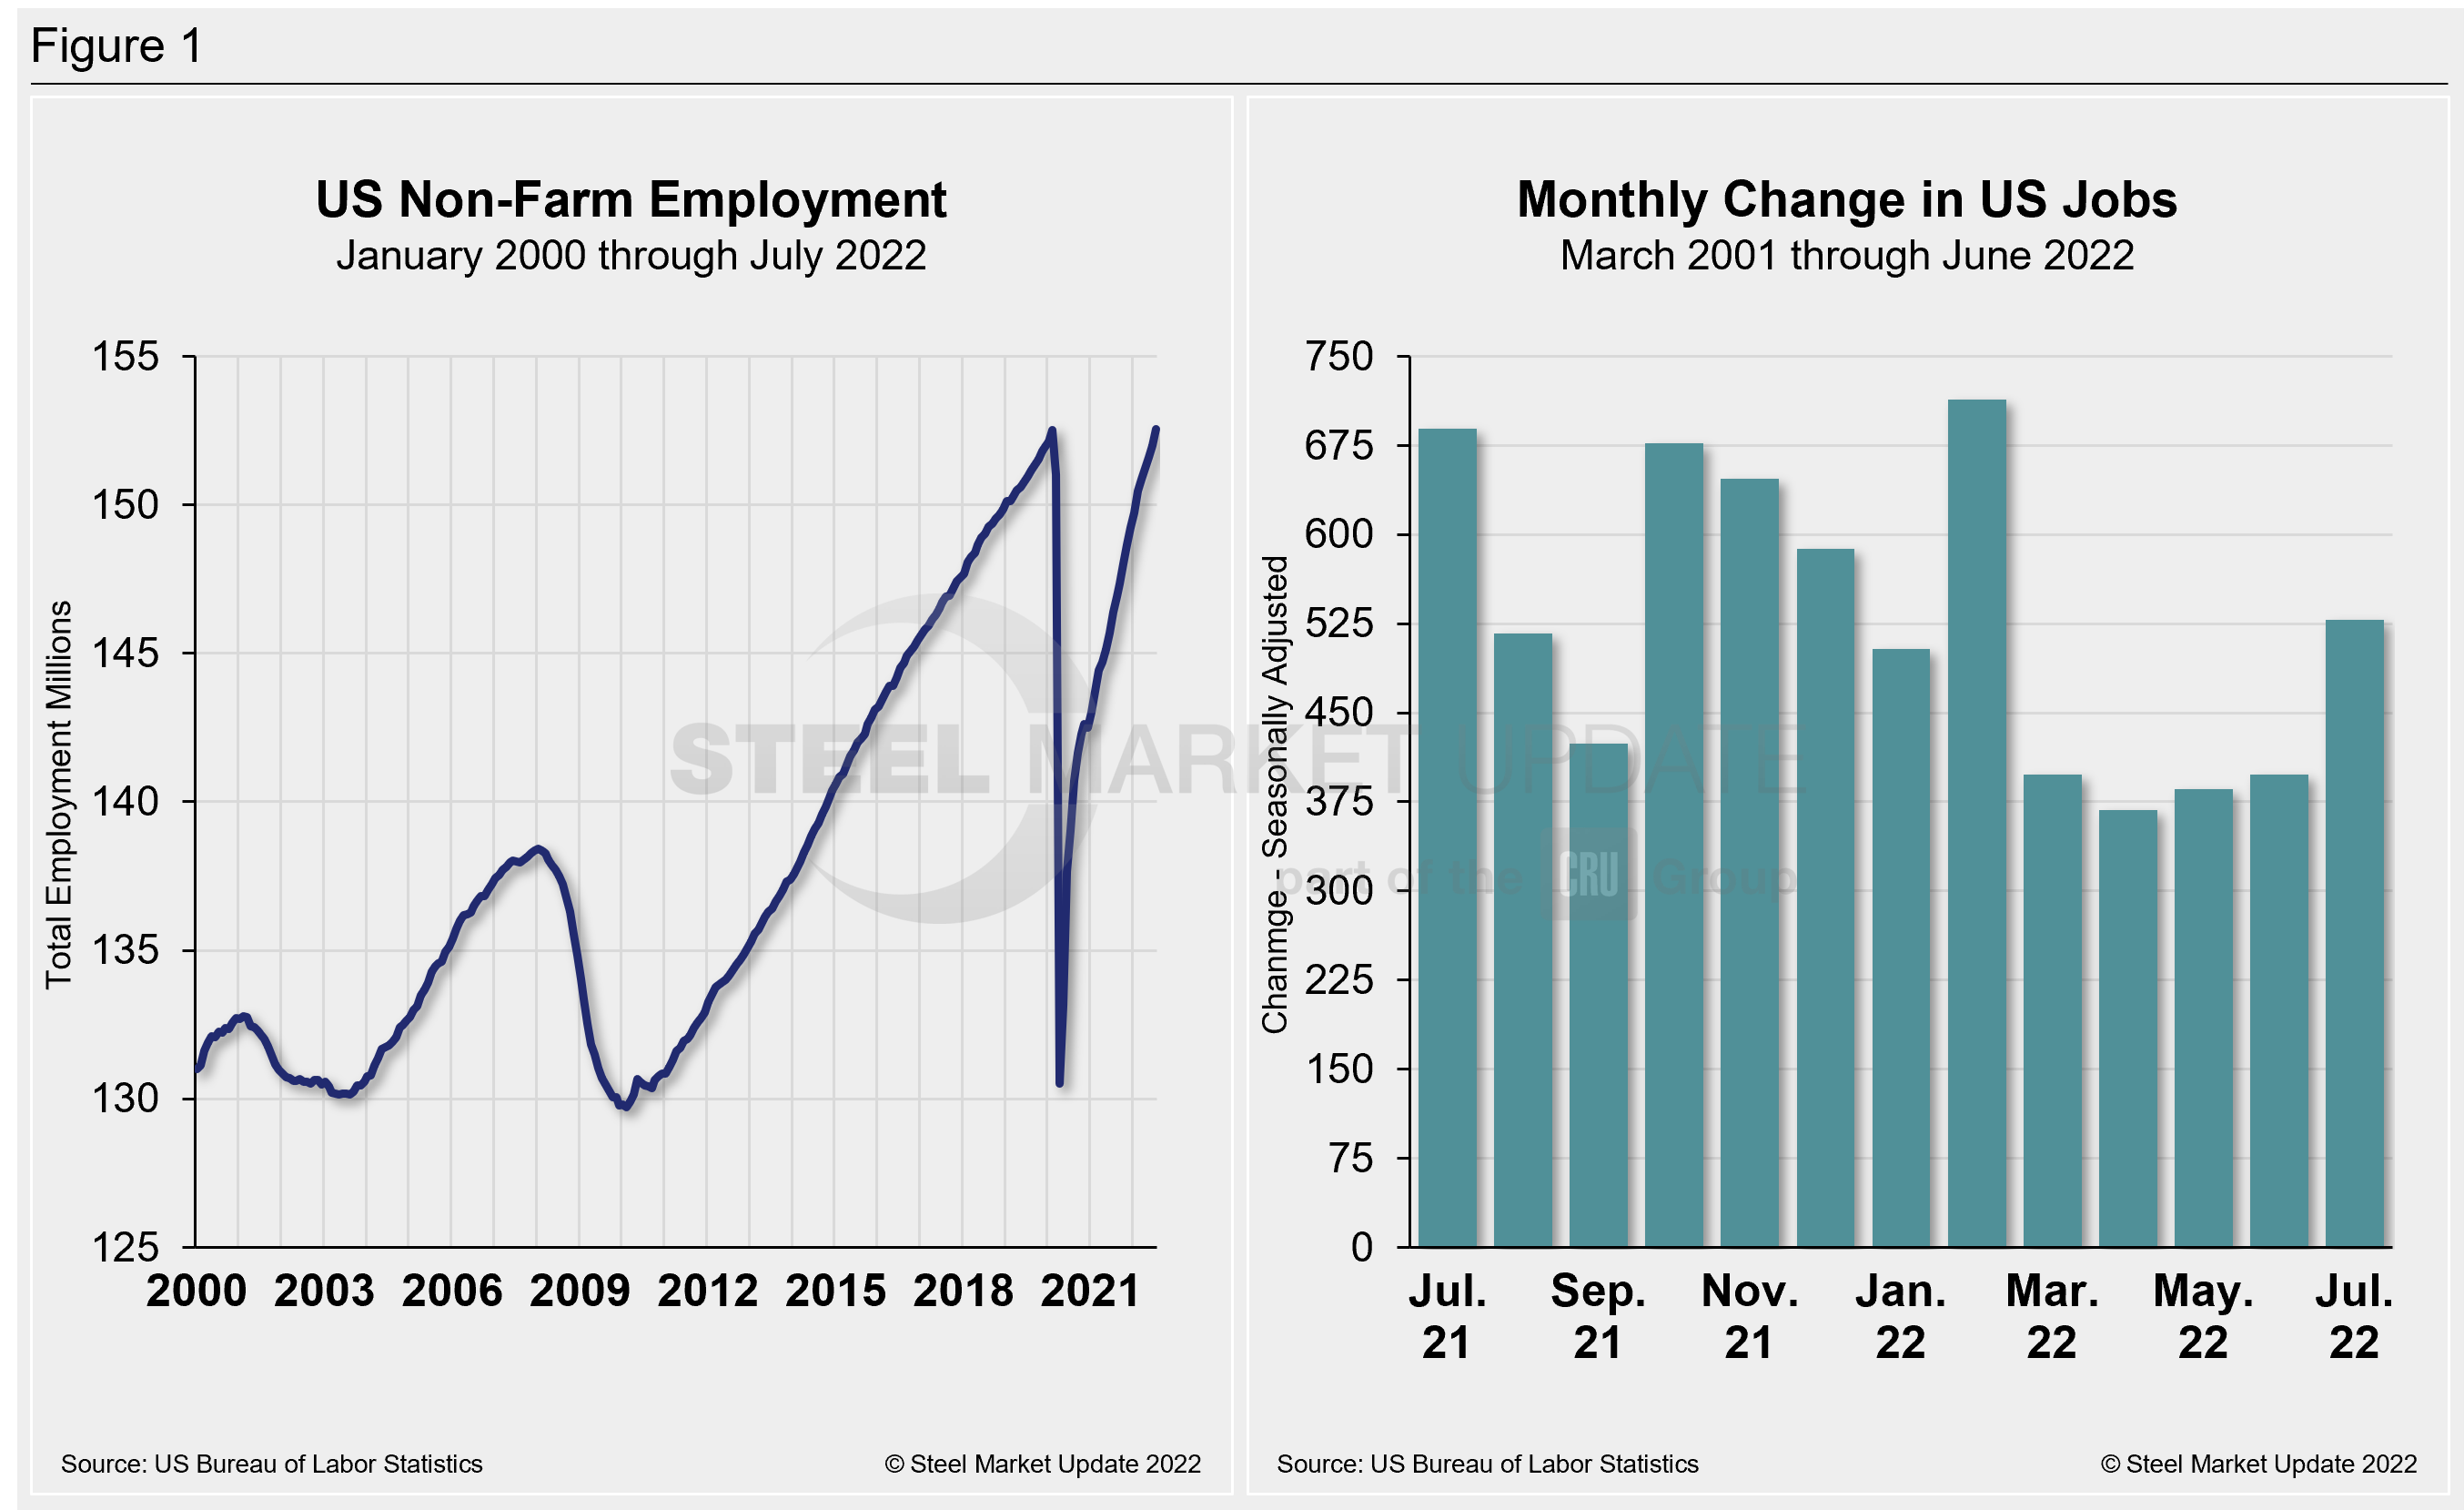
The US economy added 528,000 new jobs in July despite downbeat expectations, nearly doubling earlier estimates, according to data from the US Department of Labor.
Hiring last month was far better than expected, defying multiple other signs that the economic recovery is losing steam. The unemployment rate declined to 3.5%, now back to its pre-pandemic level and tied for the lowest level since 1969.
Job gains in July were widespread. Leisure and hospitality led the way with 96,000 added to payrolls. The industry is still 1.2 million workers shy of its pre-pandemic level, though.
Professional and business services was next with 89,000 new jobs. Health care added 70,000 and government payrolls grew by 57,000. Goods-producing industries also posted solid gains, with construction up 32,000 and manufacturing adding 30,000. Retail jobs increased by 22,000.
July’s gains were the best since February and well ahead of the 388,000 average jobs rise over the past four months. Total nonfarm payroll employment has increased by 22 million since the historic collapse in April 2020 when most of the US economy shuttered to deal with the Covid-19 pandemic.
Results were even more impressive given previous months’ totals which were revised slightly. May was raised by 2,000 to 386,000 and June was up 26,000 to 398,000.
Wages in July continued to rise. Average hourly earnings jumped 0.5% for the month and 5.2% from a year ago, also ahead of estimates. The labor force participation rate declined by 0.1 percentage point to 62.1%, its lowest level of the year, holding below the pre-pandemic level of 63.4%.
Side-by-side in Figure 1 below is a snapshot of the pace of hiring since April 2021 and the total number of non-farm workers employed in the US since 2000.
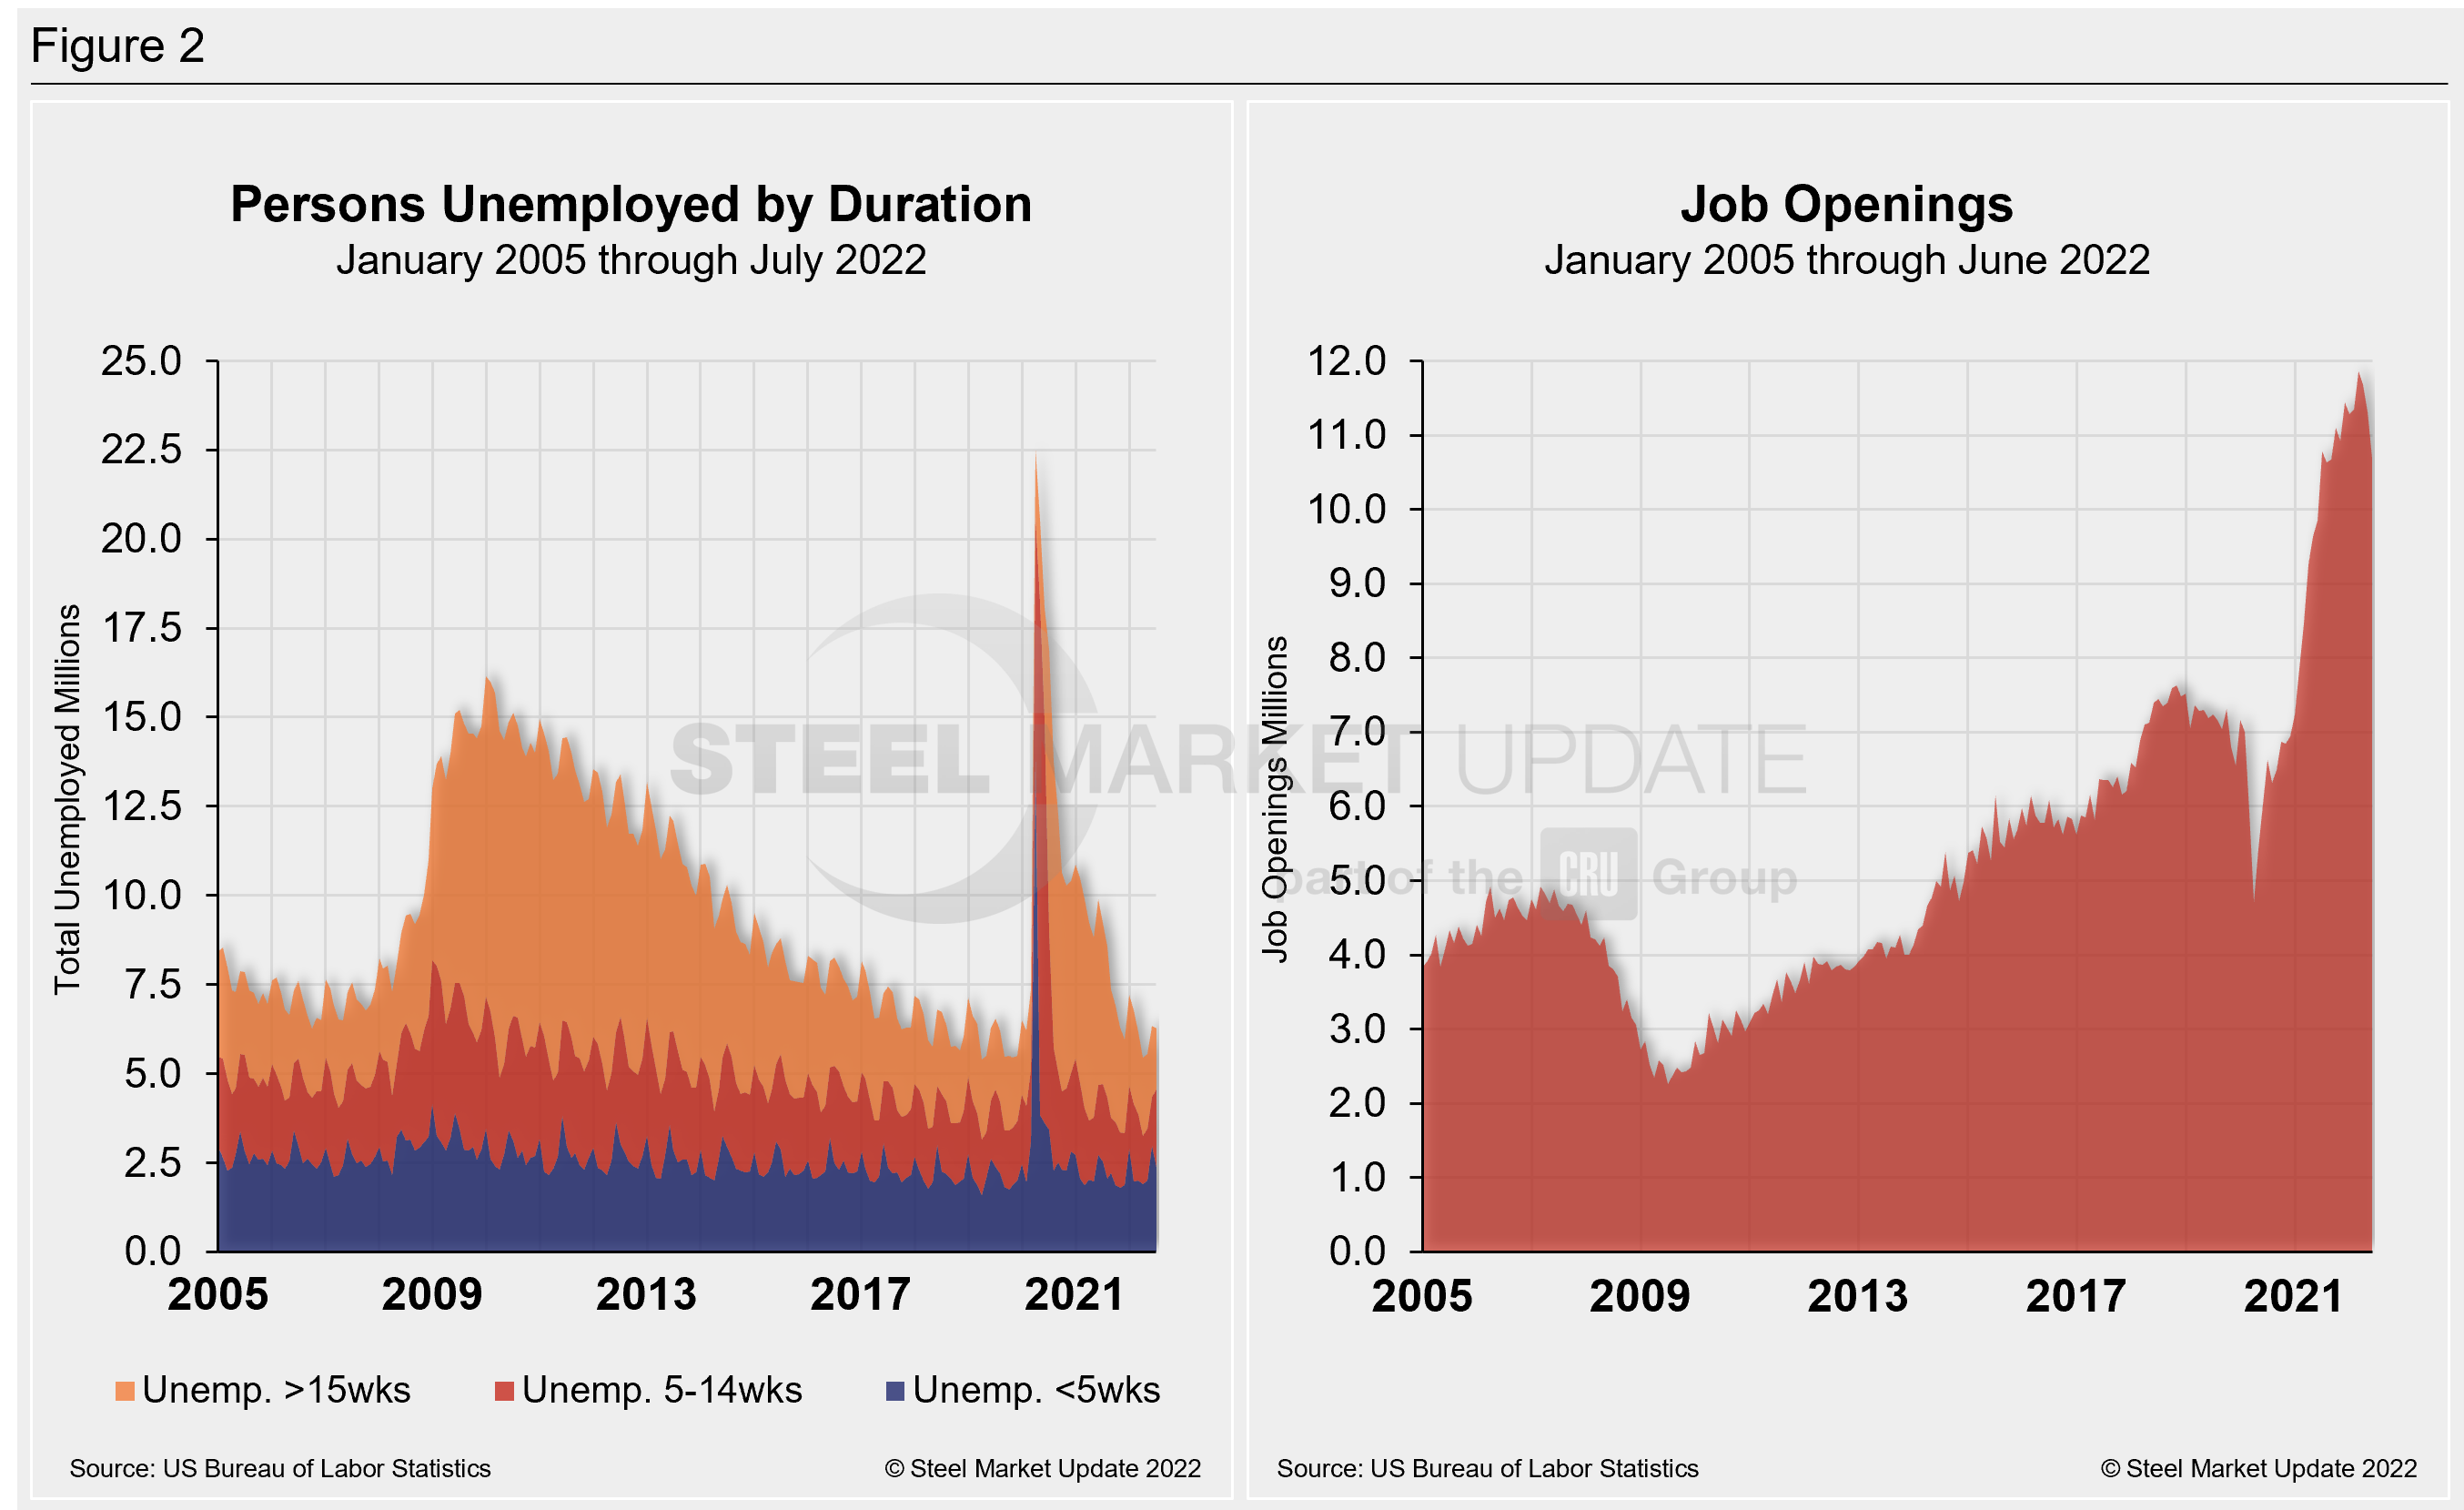
The number of long-term unemployed (out of work for at least 27 consecutive weeks) decreased by 269,000 in July to 1.1 million. That figure accounted for 18.9% of the total unemployed in the month. Of note, this measure has returned to its February 2020 level.
The historic picture for the duration of unemployment since January 2005 is broken down into <5 weeks, 5 to 14 weeks, and >15 weeks in Figure 2. The total number of unemployed was 6.255 million at the end of July, a decrease of 79,000 compared to June. The decline put the result just 37,000 above the pre-pandemic unemployment total in February 2020.
July’s results show that roughly 16.2 million more people now have jobs compared to the 22.5 million thrown out of work during the worst of the pandemic in April 2020. As of Aug. 8, 27.2% had been unemployed for more than 15 weeks, 34.8% for 5 to 14 weeks, and 37.9% for less than five weeks.
As part of July’s employment report, the Labor Department released its monthly report on job openings, layoffs, and quitting through the last day of June. Also known as the “JOLTS” report, the data indicates how much demand there is for workers in the US economy and the extent to which employers are still struggling with labor shortages nearly two years removed from the worst of the pandemic.
June’s job openings have declined consecutively from March’s record number. The report suggests that workers remain in high demand and are still quitting more often. There were about 10.7 million job openings in June, 605,000 fewer job openings than in May, and 1.2 million fewer than the record of 11.9 million set in March.
The charts below (Figure 2) detail the total persons unemployed by duration from 2005 through May 2022 and the total job openings over the same period.
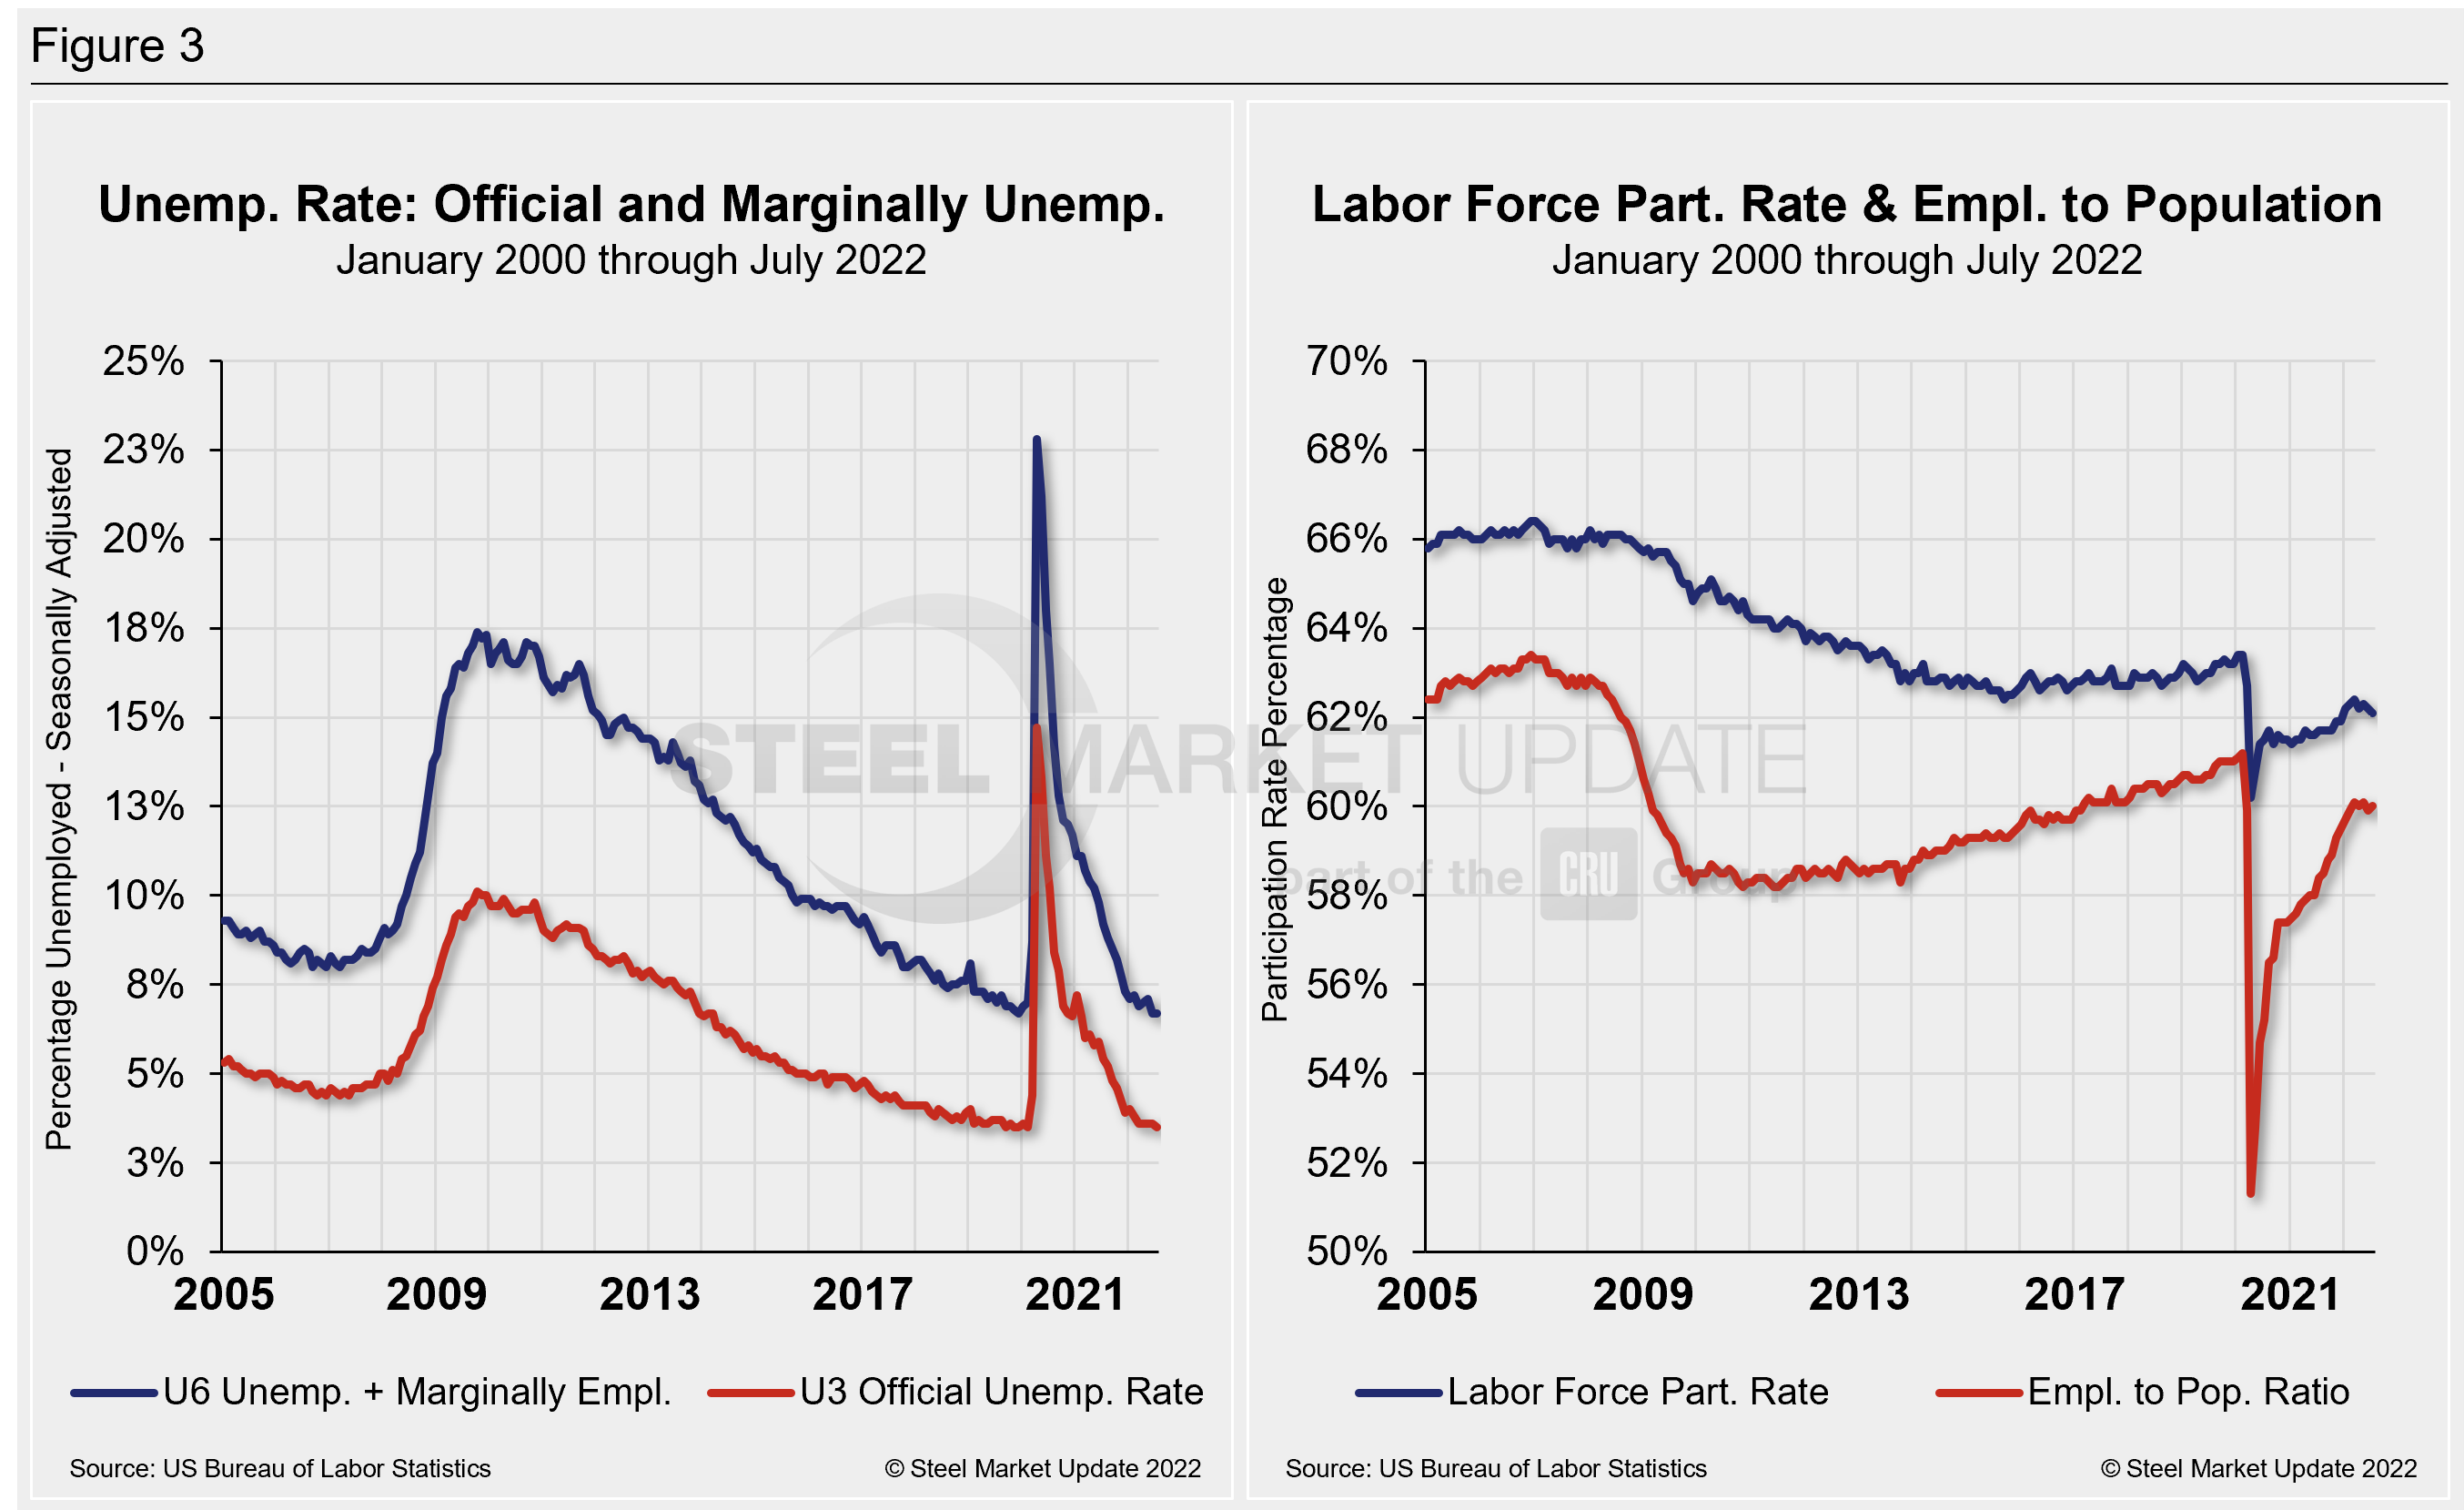
The official unemployment rate, U3, reported in the Bureau of Labor Statistics Household survey (see explanation below), increased from 3.5% in February 2020 to 14.7% in April 2020. A steady decrease followed until this past March, where it remained unchanged at 3.6% for four months. July’s measure of 3.5% is now back it to pre-pandemic form and its best reading in more than two decades.
A more encompassing view of unemployment (U6) that includes those holding part-time jobs for economic reasons as well as discouraged workers not looking for jobs was unchanged at 6.7%, after falling the month prior.
Another gauge, and a more definitive view, are the number employed as a percentage of the population. Last month, the employment-to-population ratio was 60.0%, a marginal increase from 59.9% in June.
Figure 3 details side-by-side parallels of the unemployment rate (both the U3 and U6 rates) since 2005 as well as the labor force participation rate and employment to population ratio over the same period.
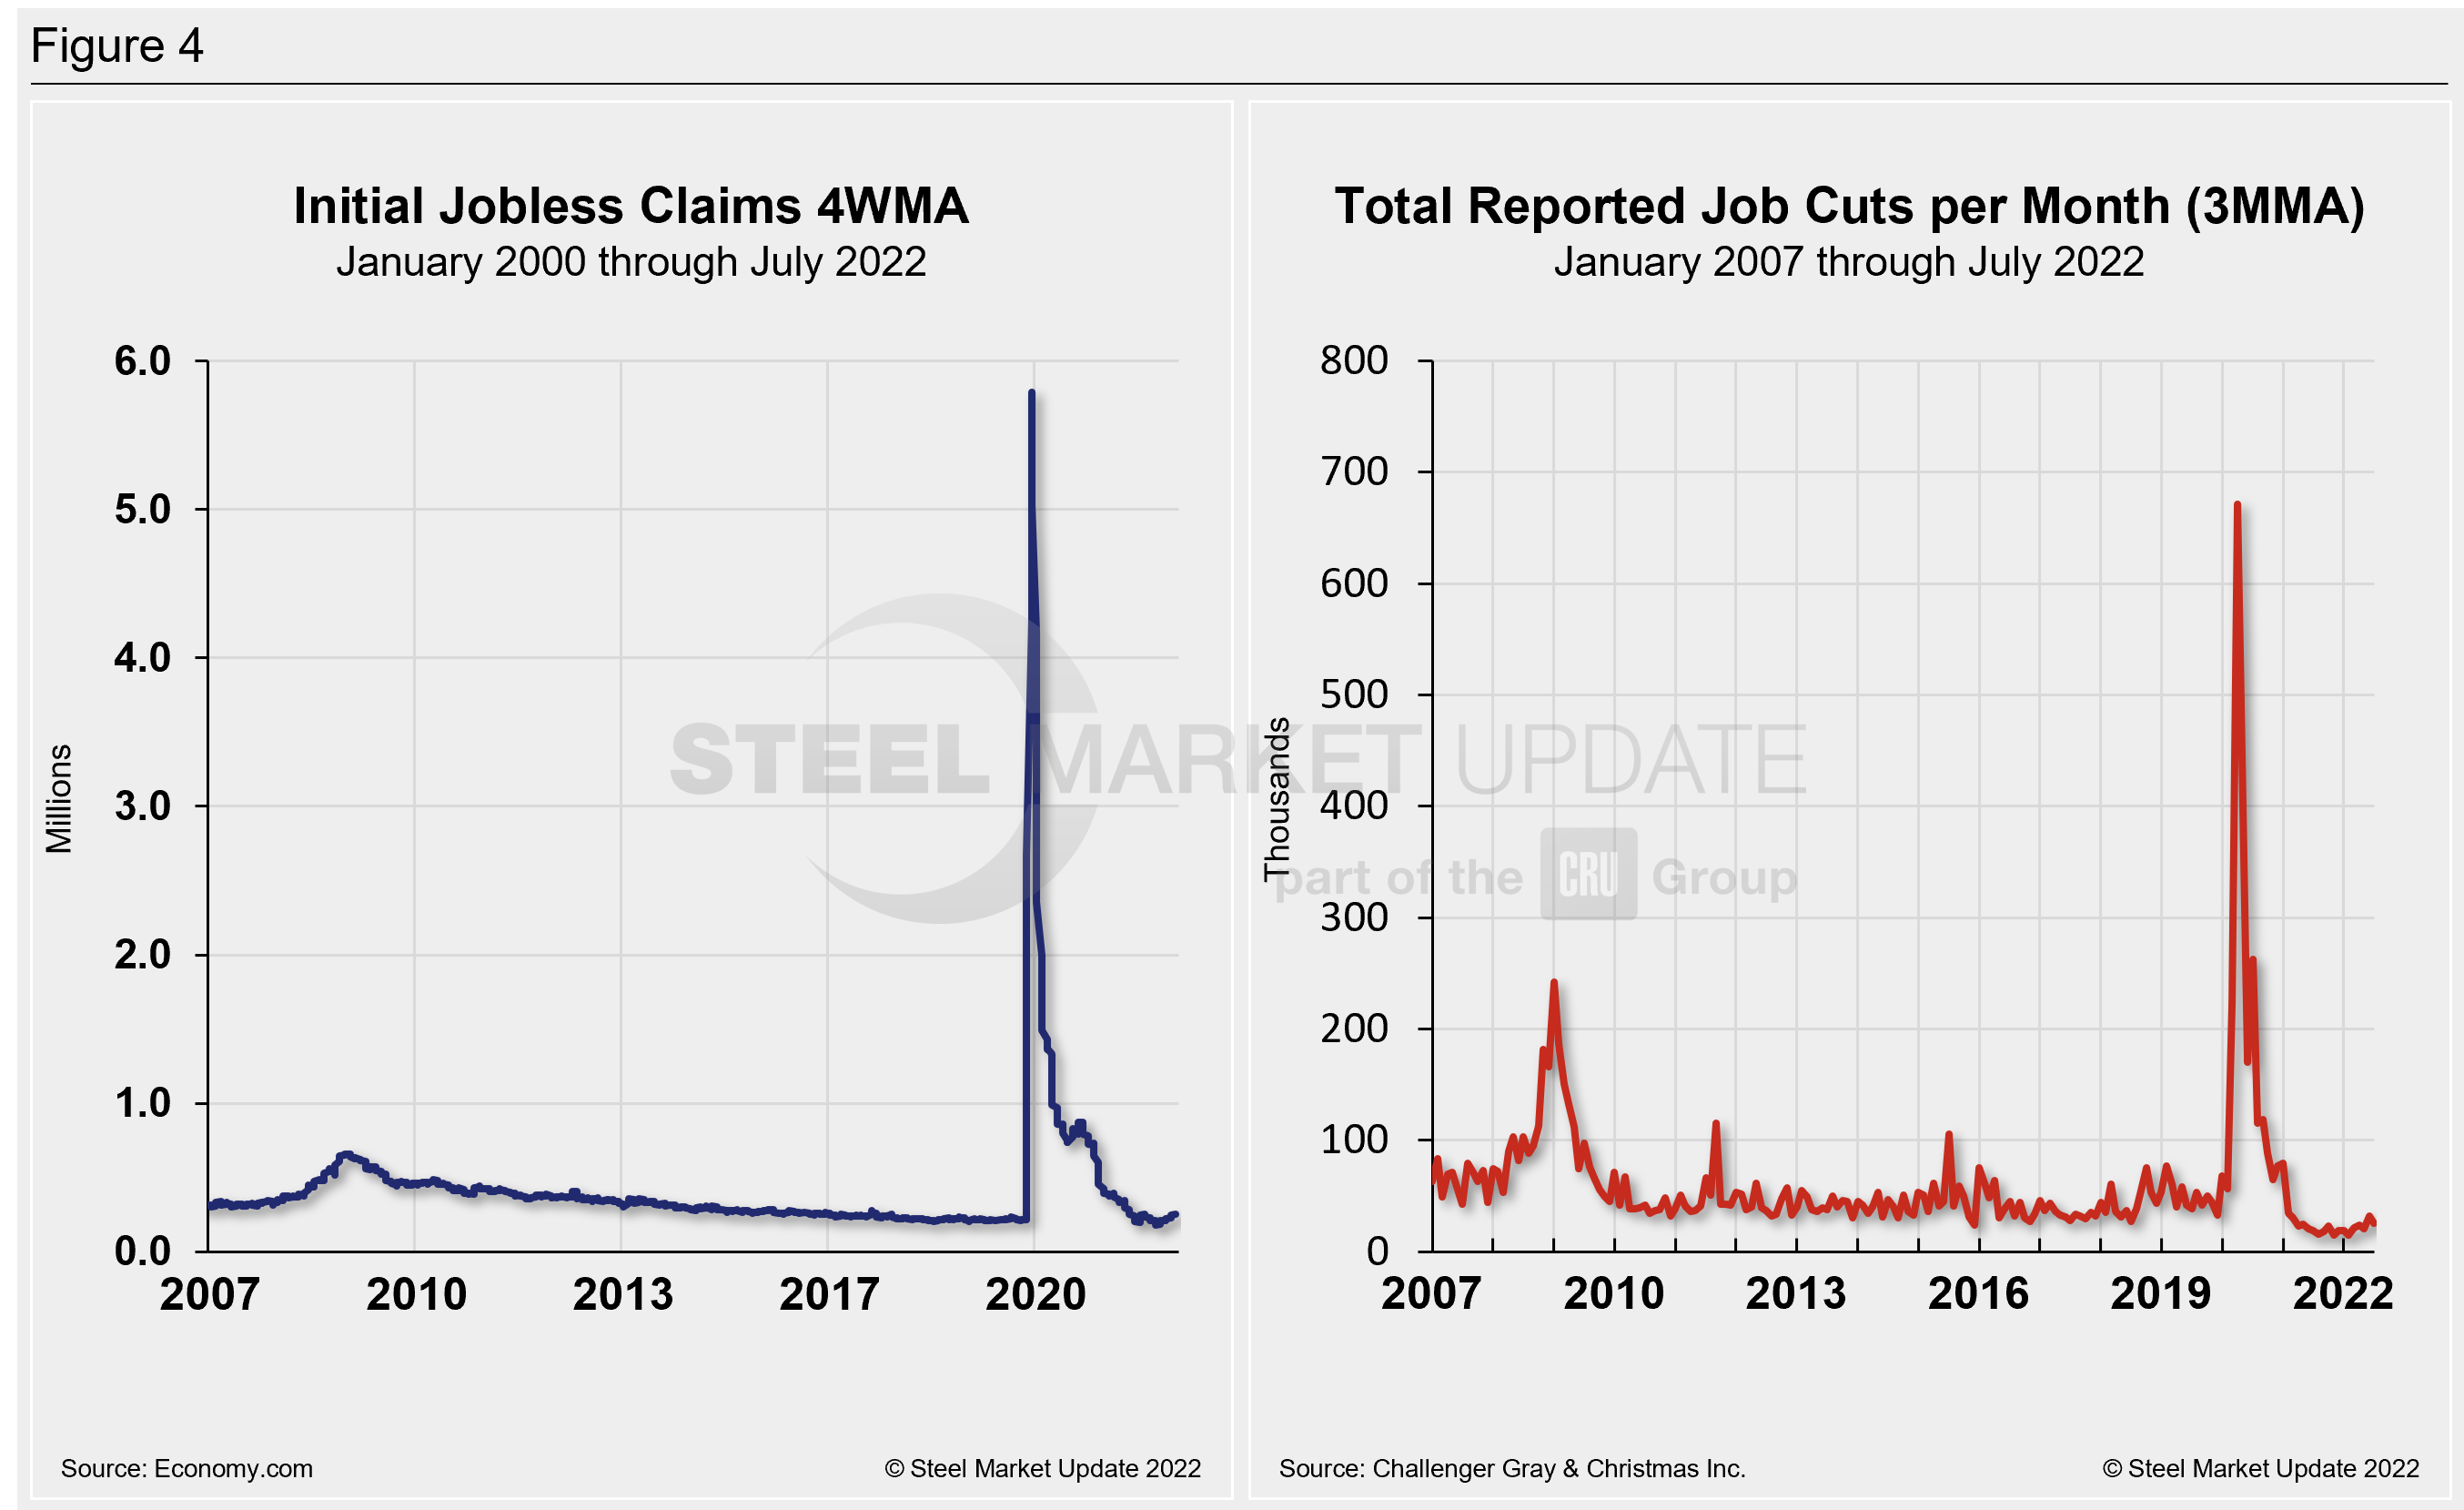
Initial claims for unemployment insurance, which are reported weekly by the Department of Labor, rose by 4,000 to 260,000 in the week ended July 30, and up 31,000 news claims since our last report a month ago. The increase pushed the total above the 250,000 threshold, showing some stress on the labor market. And if they move much higher it will raise a red flag, the Department of Labor said.
“Continuing claims were up 48,000 in the week ended July 23 to 1.416 million. The insured unemployment rate remained at 1% in the week ended July 23. The new data on initial and continuing claims don’t have any implications for the July employment report, as the data are outside the payroll reference period, which is the week that includes the 12th,” Economy.com reported.
Human resources consulting firm Challenger, Gray and Christmas Inc. produces a monthly employment update for the US. It reported that job cuts in July totaled 25,810 a decrease of 20.6% from 32,517 announced the prior month. July’s total is 36.3% higher than the same year-ago period when 18,942 cuts were announced.
July marks the second-highest monthly total all year. It is the third time this year that cuts were higher in 2022 than in the corresponding month a year earlier, the report said.
Year-to-date, employers announced 159,021 cuts, down 31.3% from the 231,603 cuts announced through the same period in 2021. It is the lowest January to July total since Challenger began tracking job cuts in 1993.
It wasn’t all good news though. The automotive sector leads all industries this year with 25,088 through the first half of the year. July alone saw 9,510 cuts from the sector. The tech sector had the second-highest number of cuts last month with 3,558 for a total of 9,338 this year. Financial firms announced the third-most cuts in July, cutting 2,165 payrolls, for a total of 12,965 for the year.
Job cut levels are currently nowhere near where they were in the 2001 and 2008 recessions, though they may be ticking up. If we’re in a recession, the labor market has yet to feel it, the report said.
Figure 4 shows the four-week moving average of new claims since January 2005, seasonally adjusted. It also shows the total reported job cuts per month, according to Challenger, on a three-month moving average.
Explanation: On the first Friday of each month, the Bureau of Labor Statistics releases the employment data for the previous month. Data is available at www.bls.gov. The BLS reports on the results of two surveys. The Establishment survey reports the actual number employed by industry. The Household survey reports on the unemployment rate, participation rate, earnings, average workweek, the breakout into full-time and part-time workers and lots more details describing the age breakdown of the unemployed, reasons for and duration of unemployment.
By David Schollaert, David@SteelMarketUpdate.com


