

Market Data

August 25, 2022
ABI’s Pace of Growth Slows Further in July
Written by David Schollaert
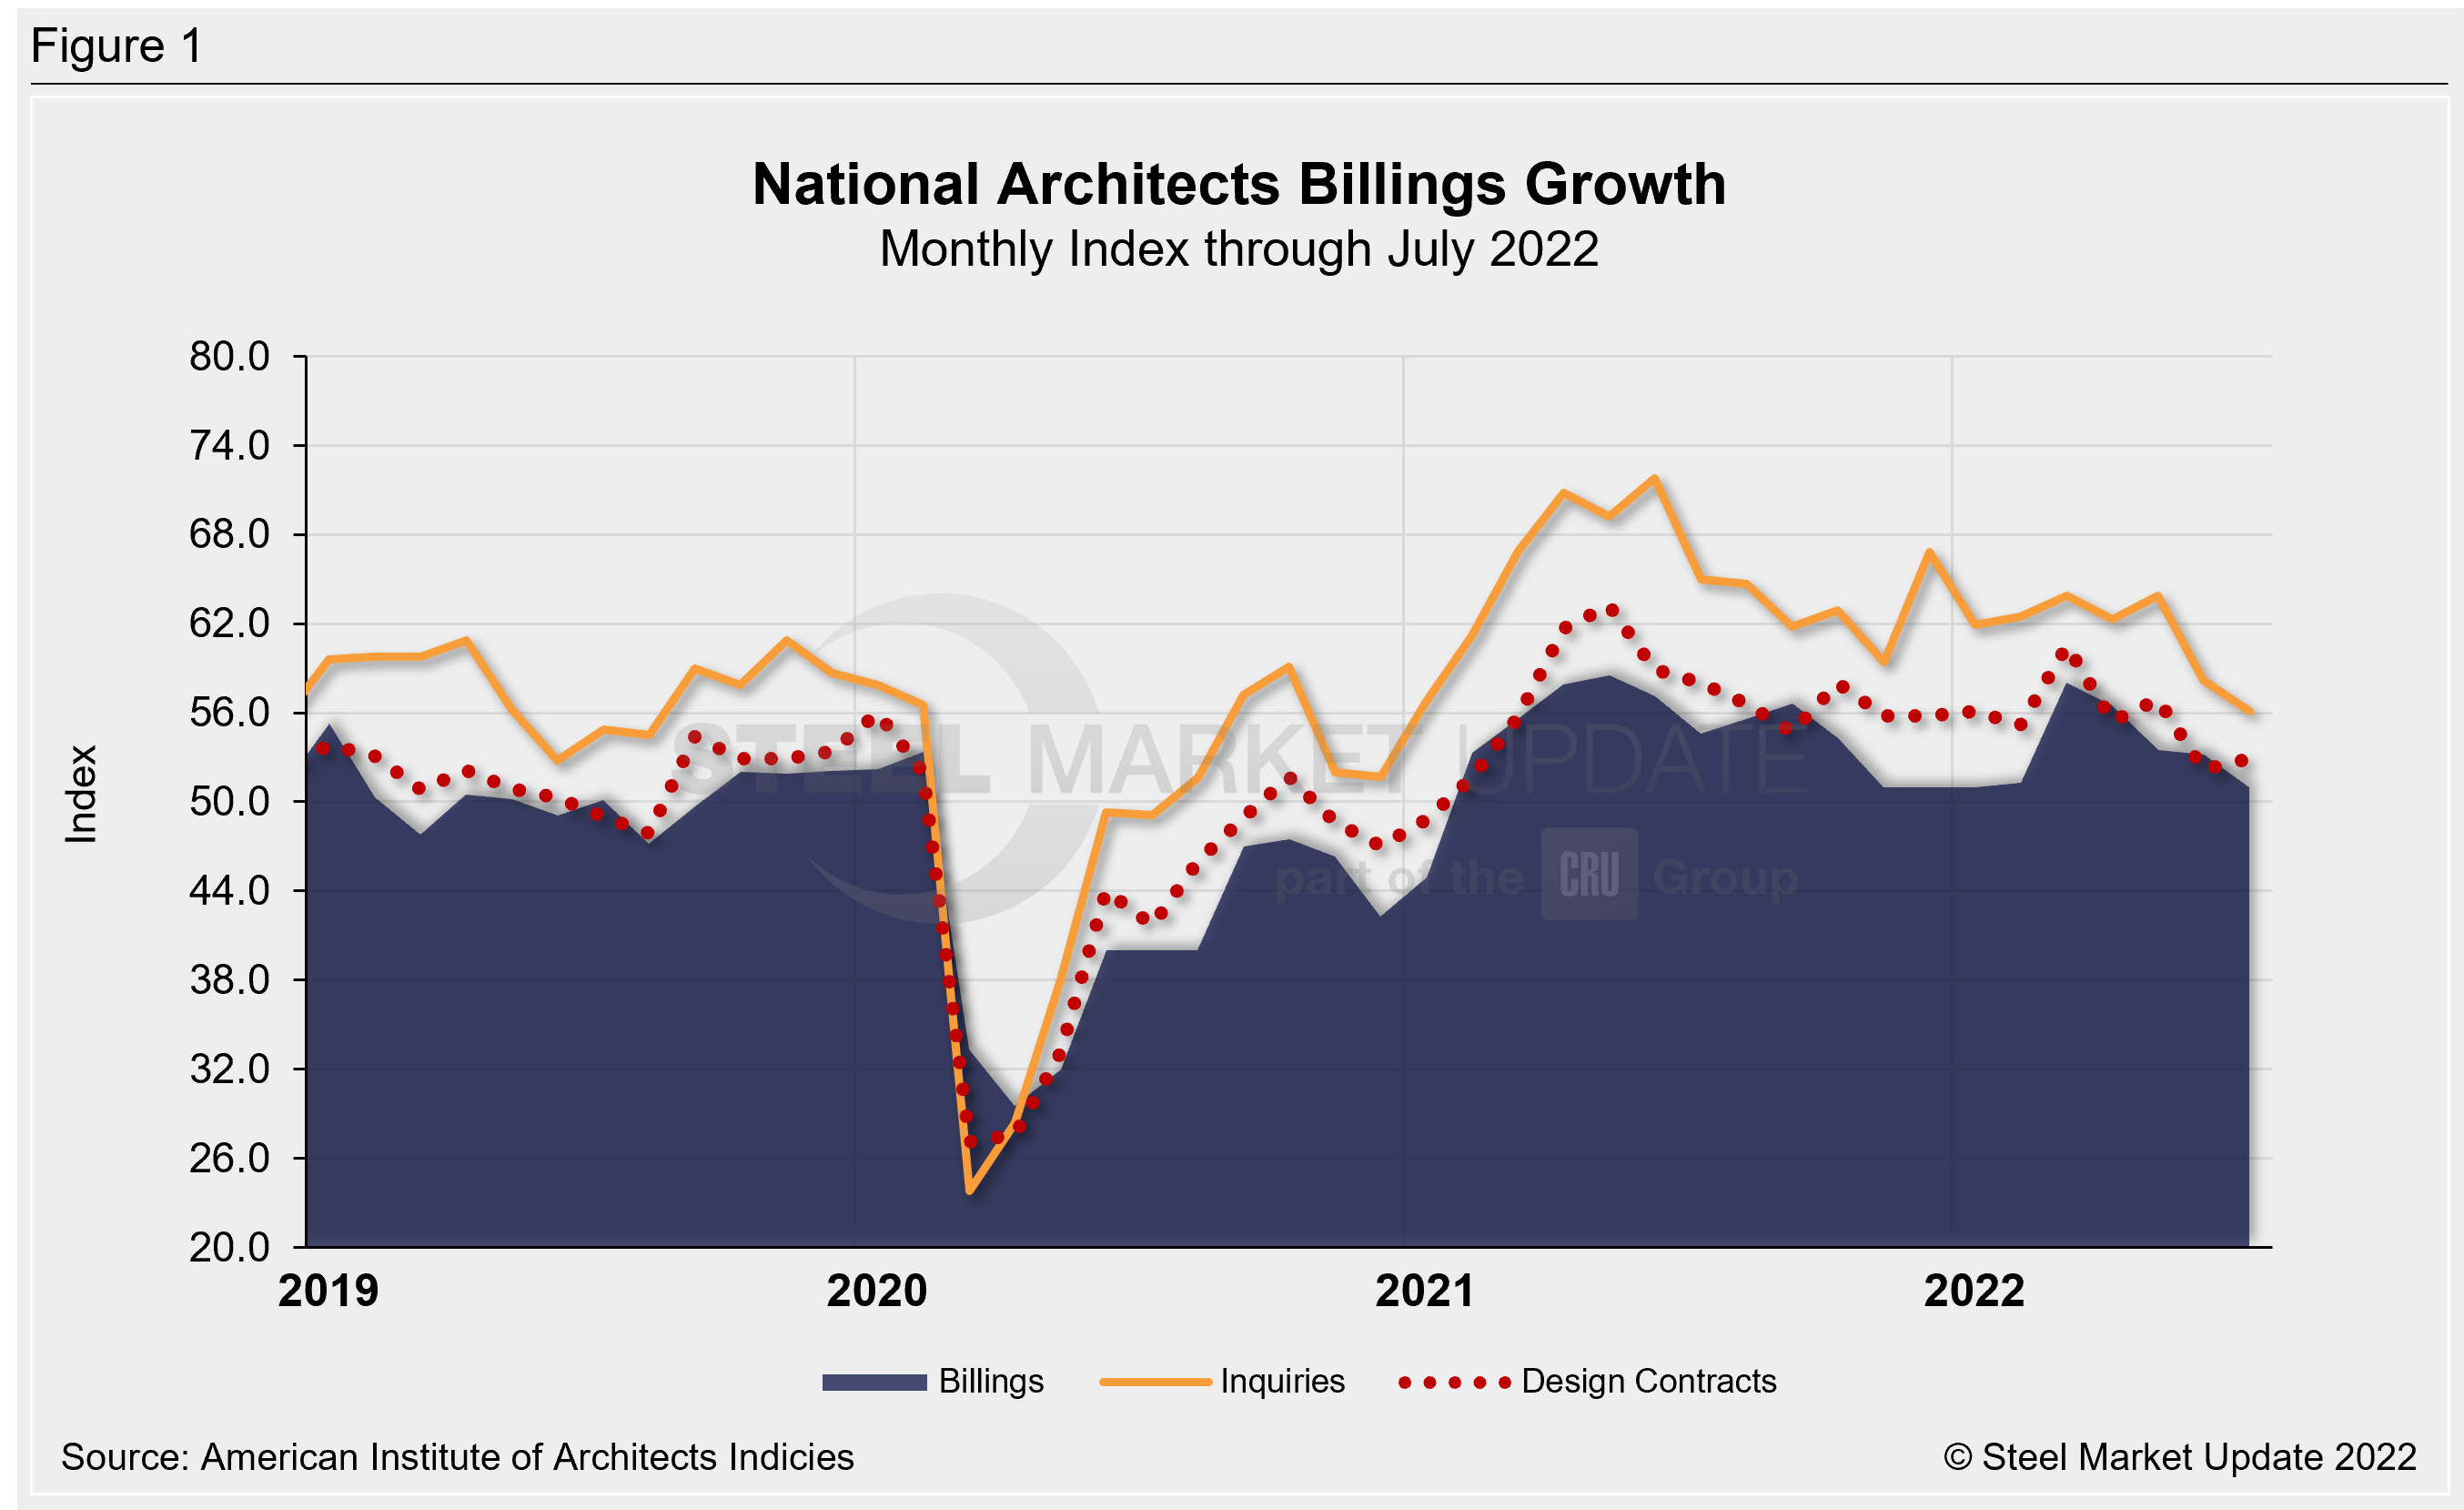
Demand for design services from architecture firms in the US continued to grow in July, though the pace of growth continued to decline. The July AIA Architecture Billings Index (ABI) score was down again month-on-month (MoM) but still marked the 18th consecutive month of growth following the pandemic-induced downturn in 2020.
The July ABI registered 51, down from June’s score of 53.2, according to the latest report from the American Institute of Architects (AIA). Last month’s score is the lowest since January.
The last four ABIs have reported slower growth following a post-pandemic increase which began in January 2021, and was followed up by nationwide issues such as inflation and now looming economic uncertainty.
The ABI is an advanced economic indicator for nonresidential construction activity with a lead time of 9–12 months. A score above 50 indicates an increase in activity and a score below 50 indicates a decrease.
Most architecture firms reported growing business conditions, but still-rising inflation, higher interest rates, and a continued shortage of building and construction materials mean the future view is less certain, the report said.
Indicators of future work remained firm, driven by the value of new design contracts and extended backlogs.
Both design contracts and new project inquiries moderated in June but continued to show growth. New project inquiries posted a score of 58.2, down 5.7 points from May’s score of 63.9. Design contracts came in at 52.2 points, declining 4.7 points from May’s score of 56.9. This was the slowest rate of growth for both since the recovery began in early 2021.
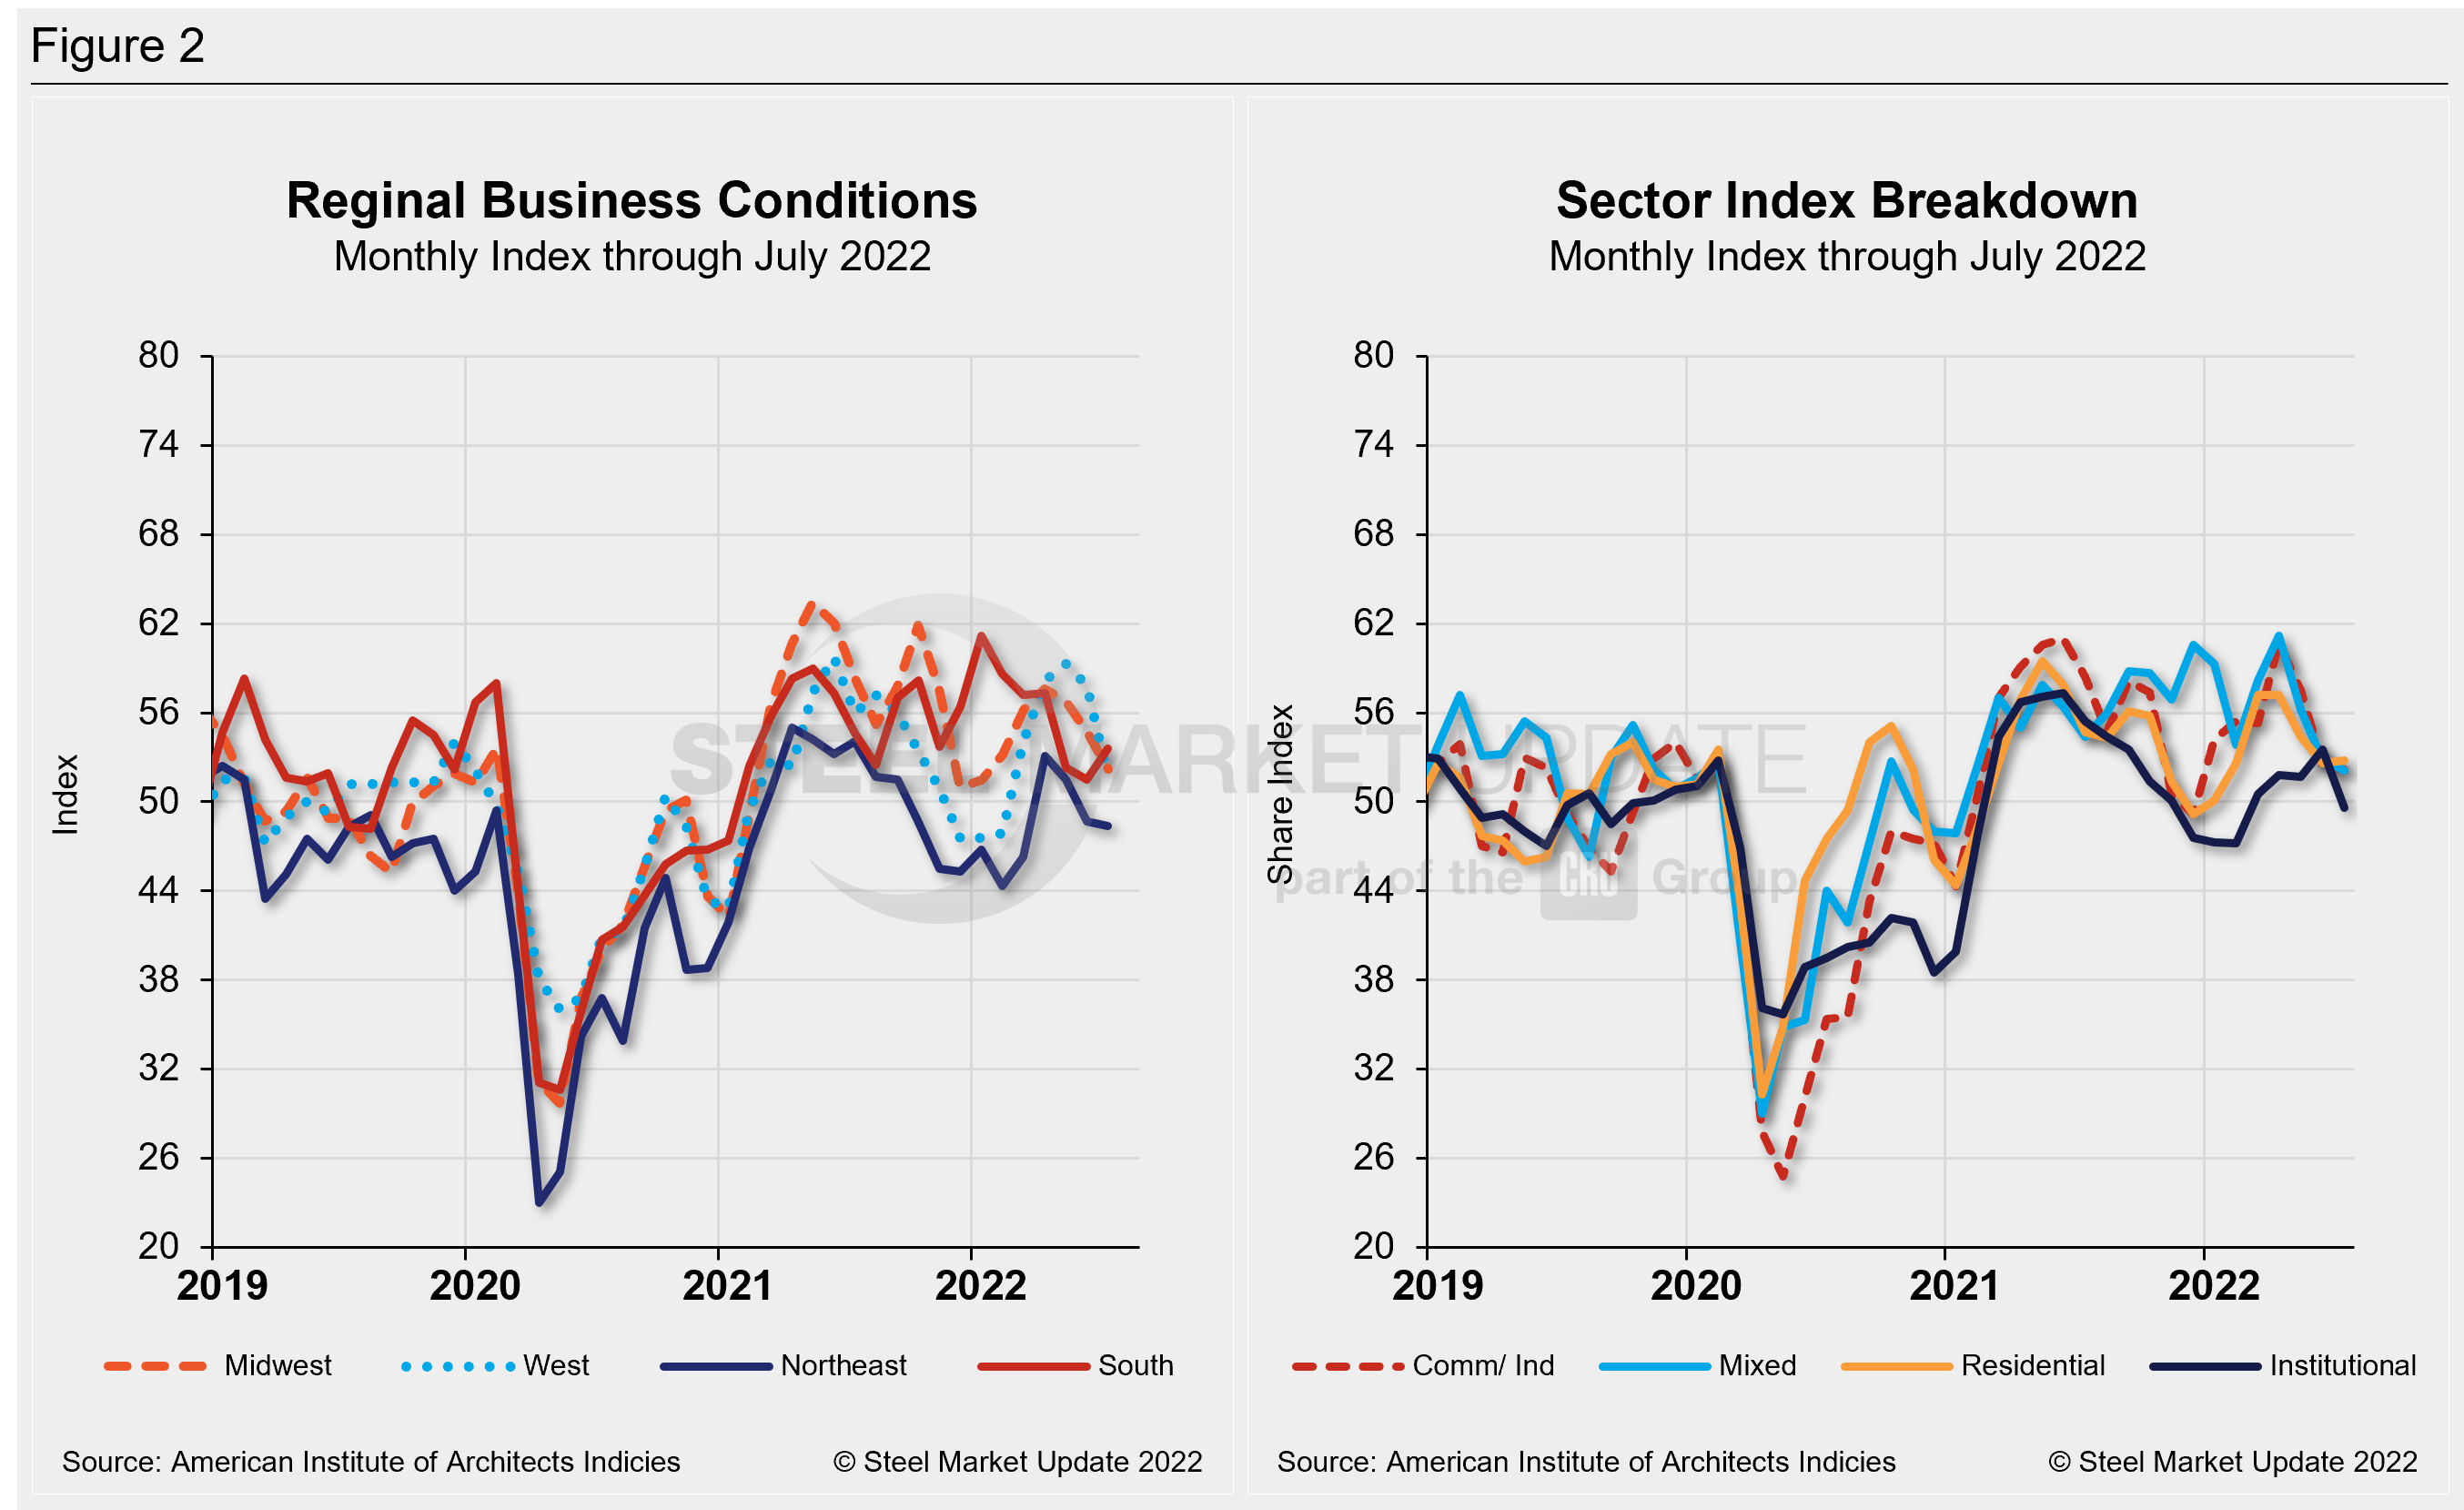
The MoM changes in scores for regional billings—which, unlike the national score, are calculated as three-month moving averages (3MMA)—moderated in June (Figure 2). Regionally, billings correspond with the “slowing trajectory” pattern reported by the national average score.
In the Northeast, the score decreased slightly, reporting in at 48.4, down 0.3 from last month. Similarly, the West and Midwest saw decreases in their growth rates; the West, most notably, was down from 57.8 in June to 51.7. The South is the sole region with an uptick in its billings score, registering 53.6 in July, up from 51.5 in June. Like the regional billings scores, sector billings scores are also calculated as 3MMA and are displayed in Figure 2.
“Despite architecture services employment recently surpassing pre-pandemic levels, the ABI score this month reflects the slowest growth since January, and marks the fourth straight month with a lower score than the previous month, indicating a slowing trajectory in billings activity,” said Kermit Baker, AIA’s chief economist. “With a variety of economic storm clouds continuing to gather, we are likely looking at a period of slower growth going forward.”
Key ABI highlights for July include:
South (53.6); Midwest (52.2); West (51.7); Northeast (48.4)
Sector index breakdown: multi-family residential (52.8); commercial/industrial (52.2); mixed practice (52.1); institutional (49.6)
Regional and sector scores are calculated as 3MMA. Below are three charts showing the history of the AIA Architecture Billings Index, Reginal Business Conditions, and Sectors.
An interactive history of the AIA Architecture Billings Index is available on our website. Please contact us at info@SteelMarketUpdate.com if you need assistance logging into or navigating the website.
By David Schollaert, David@SteelMarketUpdate.com


