

Prices
August 26, 2022
CRU Aluminum: Reframing the Demand Picture
Written by Matthew Abrams
Economic conditions are still iffy at best. Housing data continues to suffer with new home sales plunging and inventory reaching the highest it has been since 2009. The Richmond and Kansas City Fed manufacturing indexes both plunged in July as well. The Richmond Fed’s manufacturing skill availability index, which indicates the demand for skilled labor in relation to supply, has risen to 0, or neutral, which signals a switch from expansion to contraction. However, not all is negative as CPI projections have built off last month’s report and are expected to continue to fall, albeit slowly. The Philadelphia Fed manufacturing index reported a surprise jump and, despite the struggles in housing, prices have steadied after the sharp drop seen last month. Durable goods orders have also remained steady month-on-month.
![]()
This uncertainty has begun to hit aluminum shipments in the middle of the summer doldrums. Last year’s red-hot demand during the recovery period makes comparisons a tough task. Looking deeper into the data provides a less gloomy picture than what might be seen from an initial glance.
Looking at extrusions, 2021 and the first half of 2022 showed a strong rebound in demand after the Covid-19 related recession in 2020. As H2 2022 approaches, both shipments and new orders have followed the trends of the overall economy as growth slows and demand cools. Something to keep in mind is this trend has been seen throughout every previous major recession. Extrusion shipments have always followed this V-shaped recovery, with it historically taking 12–18 months to hit previous levels. As we approach the previous pre-pandemic peak, the growth rates have begun to slow and struggle to push further. With seasonality involved, this trend is hard to visualize. Below, shipments during Q1 and Q2 are isolated to accomplish this.
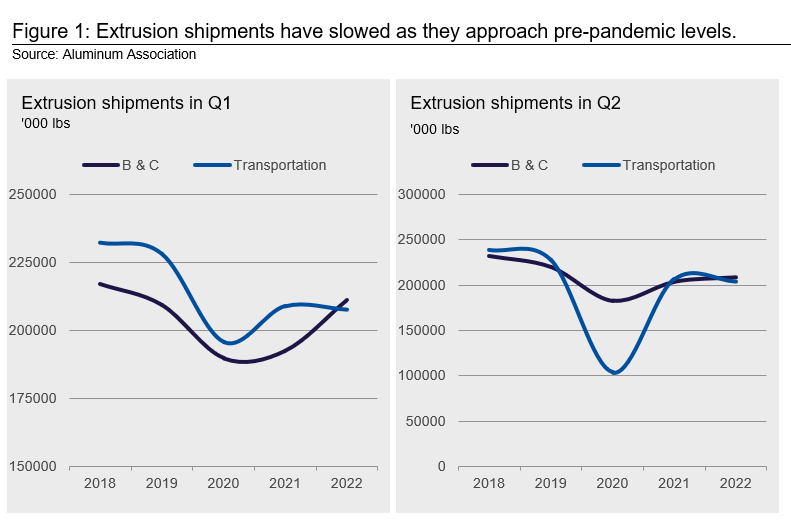
Automobile producers’ struggles with supply chain issues have been well documented throughout the year. It was previously expected that these would start to ease and production would speed back to previous levels. Things have indeed improved, however, they have still been unable to reach the production volumes seen in 2018. Semiconductor supply has remained an issue throughout the first half of the year and now with higher interest rates, fuel costs, and new car prices, demand could falter just as supply starts to catch up.
With all this negativity, a bit of perspective is necessary. While things may have slowed, there has yet to emerge huge cause for concern. Throughout the beginning of the year, lead times for extrusions were up to 40+ weeks and press utilization numbers were over 80%. These unsustainably high numbers put even greater pressure on the supply chain. Also, the price of metal through both the LME and Midwest premiums exhibited record levels of volatility over this period, making managing inventory a high stakes challenge with delivery dates so far out in advance.
Shipments peaked in Q2 2018 where year-on-year growth hit close to 20% in both B & C and transportation end uses. Current levels are just 10% removed from this peak and already in line with averages seen through earlier periods. It is safe to say the recovery from the 2020 recession is complete and growth rates have returned to “normal.” The number of presses in the US limits how high sustained growth can get which would give the illusion of a slowdown once previous limits are approached. There are 40+ new investments expected in the industry by 2024 which will push shipments higher and start to test the limits of demand.
Sheet Walks Along the Same Path
Sheet demand is also following similar trends as extrusions with transportation and construction following a sharp V-shaped recovery. The inflated growth numbers over the last few quarters will normalize. Transportation end-use demand was slowest to rebound given the heavy weighting of passenger cars, light trucks, and heavy-duty vehicles. Shipments have started to reach previous levels of demand. If looking for an economic slowdown, it would be easier to point to this data, however looking at it with this perspective clearly shows the difference between large scale recessionary slowdowns and what we are seeing this summer.
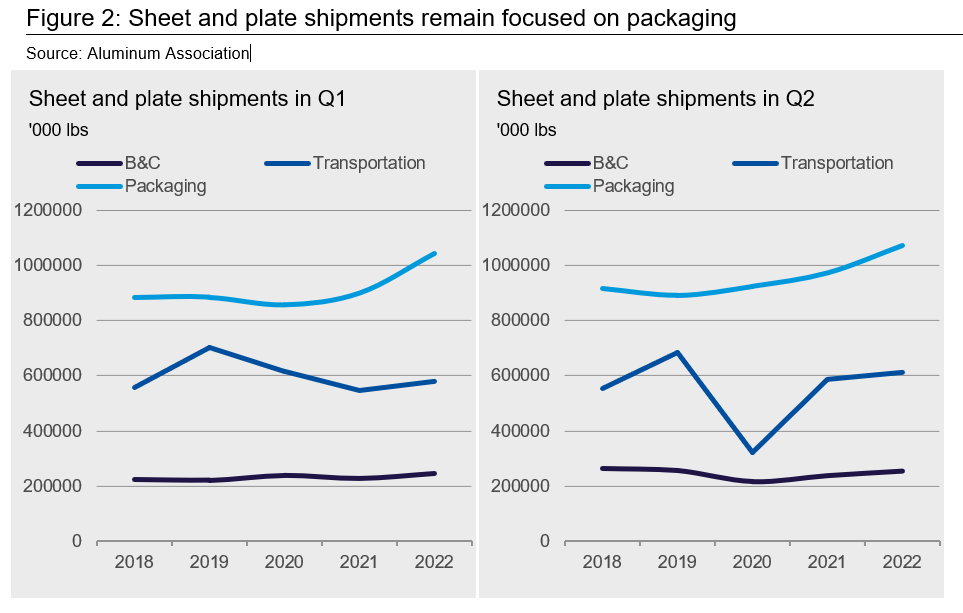
One difference between sheet and plate and extrusions is the advantage some rolling mills have to switch from automotive sheet to can sheet. Can sheet has been the one end-use segment that has boomed during the past year, whereas before the pandemic it was stagnate with growth rates of 1–2%. Can sheet demand jumped a level due to the new consumption habits of millennials, a host of new beverage offerings, and a continued strong demand for traditional CSDs and beer. Sustainability and ESG standards and a preference towards aluminum cans also aided this shift. This spike would not have been possible were it not for the upset in the automotive production supply chain and the ability of these mills to allocate more of their capacity towards cans. This can be further emphasized looking at the uncertainty seen in the international supply chain during that same period.
Demand has been at the forefront of most conversations as the juiced-up growth rates during the recovery period have started to slow. Supply has not been talked about as much but will likely start to be a limiting factor going forward. As a testament to this, unprecedented domestic investments have been announced for rollers and extruders which will start to truly test the limits of demand when they come online.
Pricing Remains Volatile
The LME aluminum three-month price has been hovering between $2,390–2,450 per metric ton throughout August and this trend has continued in the week closing Aug. 26 where it currently sits at $2,430 per metric ton. The volatility swings within this range continue, as the price continues to search for support at higher levels. With strike actions being seen in Norway and surging natural gas prices causing growing concern for more European smelter closures, the risks to the upside remain.
The Midwest premium has continued to fall again this week and is now seen below $0.26 per pound after falling over a cent again over the last two weeks. With the section 232 hearings out of the way and seemingly no action being taken until the UITC meets again in March, this further downward movement can be attributed to the steady stream of negative economic news. Freight has come off from its peaks which further denotes downward pressure on the premium, however it is believed to be currently sitting well under replacement value.
By Matthew Abrams, Research Analyst, CRU Group


