

Market Data

September 9, 2022
CRU Economics: Has Inflation Peaked?
Written by Alex Tuckett
By CRU Principal Economist Alex Tuckett, from CRU’s Global Economic Outlook
The rise in inflation has been a major headwind for the global economy. It has squeezed household incomes and led to a tightening of monetary policy across dozens of countries. Although the price environment in Europe remains red hot, there are tentative signs that inflationary pressure has peaked globally. But this is not a simple ‘good news story’. Inflation is moderating partly because demand is weakening.
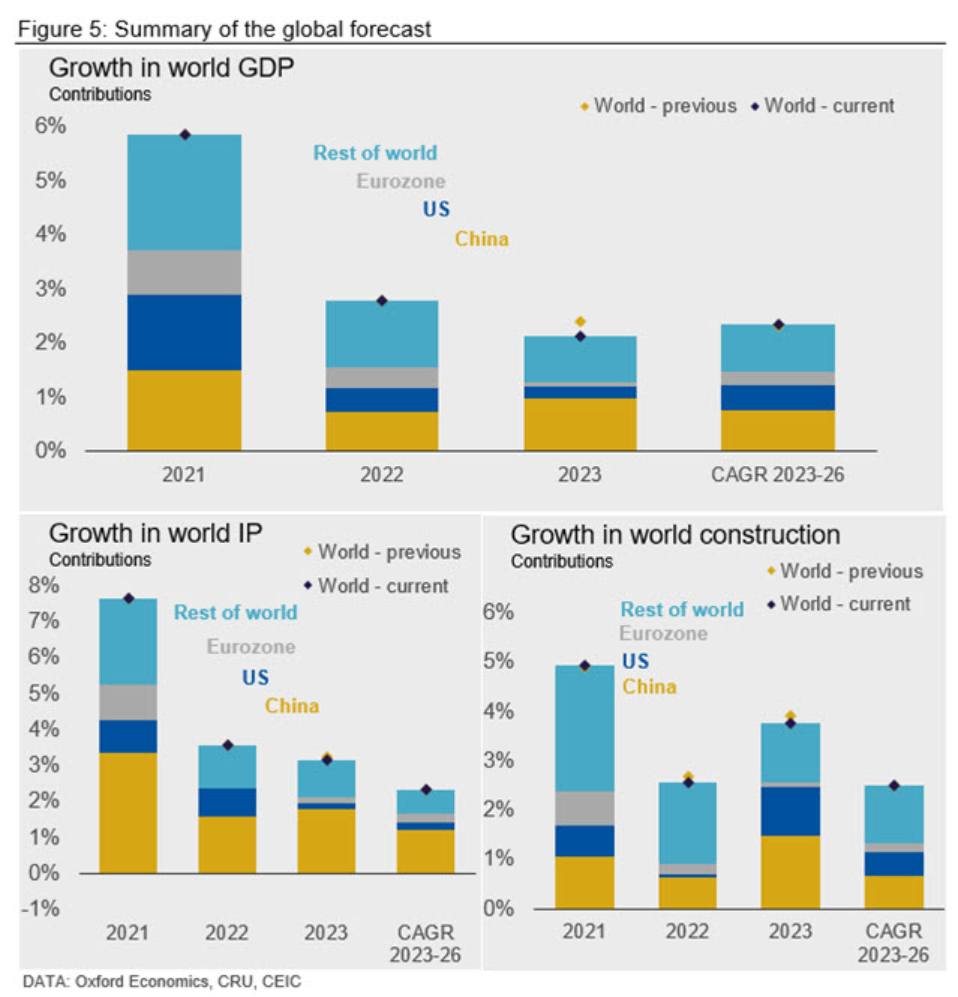
We have maintained our forecast for 2022 growth in world GDP at 2.8%, and Industrial Production at 3.6%. However, we have downgraded our forecast for GDP growth in 2023 to 2.1% (from 2.4%), and growth in industrial production to 3.2% from 3.3%.
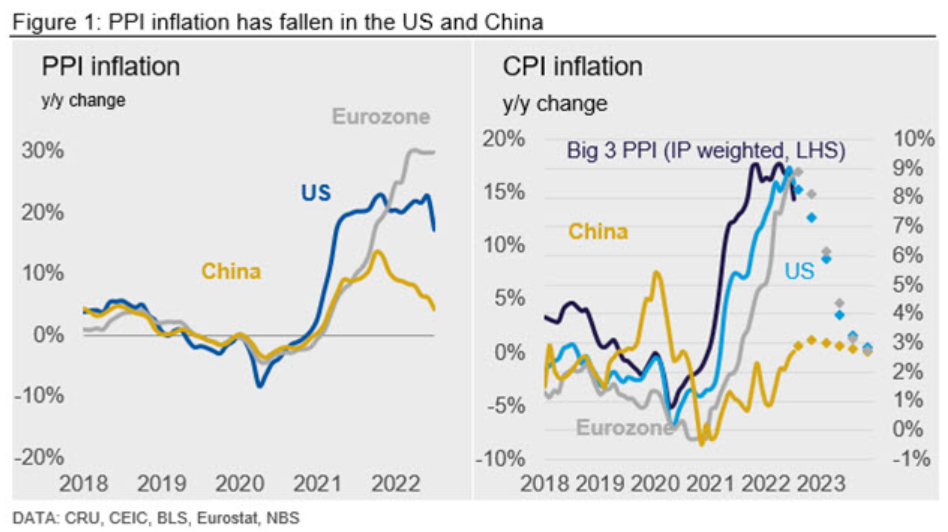
Producer price inflation (PPI) has recently fallen from its peak in the US (Figure 1), although it remains high. It has been decelerating for some time in China. The inflation scores in the US ISM manufacturing survey have also fallen sharply. Most importantly, US headline CPI finally delivered a downside surprise, falling to 8.5% in July from 9.1% in June. However, there is little sign yet of inflationary pressures easing in the Eurozone. PPI inflation has remained at staggering annual rates of almost 30%, while CPI – at 8.8% year-over-year (YoY) in July – has now overtaken the US.
It is too early to say for sure that peak inflation has passed. Further shocks could easily push it higher again; for example, a recovery in commodity prices, or supply chain disruption from low water levels in Germany or China. But the picture does at least look more balanced than a few months ago.
There are three critical factors that have contributed to inflation moderating:
Commodity prices have fallen from their peaks. Brent crude is down 20% from its high of over $120 on June 8, and a range of other commodities have also seen prices drop from their peaks, although they remain high in absolute terms.
A notable exception has been European gas prices, which have surged above the levels seen in the early days of the Ukraine war, as Russia has restricted gas flows through the Nordstream 1 pipeline to prevent Europe from building up inventory. The fall in commodity prices partly reflects fears of a slowdown or recession (see below). But it also shows that global commodity flows are changing and adapting to the sanctions on Russia. For example, India has massively increased its demand for Russian oil, freeing up supplies from the US and elsewhere to go to Europe.
There is still the possibility of further disruption to come; if the European Commission bans EU entities from shipping or insuring the shipment of Russian oil, this could lead to sharp falls in supply to world markets. But for now, the fall in energy prices has helped to take some of the heat out of US CPI at least.
There are some signs that supply chain disruption is easing, beyond the moderation in PPI inflation set out above. The Fed’s Global Supply Chain Pressure Index (GSCPI) has continued to fall (Figure 2, left-hand side). In the US, the ISM PMI survey saw declining balances for order backlogs, supplier delivery times, and prices.
In China, the delivery times sub-index of the PMI has fallen sharply after spiking during the lockdowns in April and is now below 50. The balance for order backlogs is still rising, but this is by nature a lagging indicator. Inventory levels have risen in China, Japan, and on both sides of the Atlantic (Figure 2, right-hand side), particularly downstream. However, the rise in stocks may reflect demand beginning to weaken, as well as supply chains improving. And high gas prices – as well as outright rationing – have the potential to cause havoc with European supply chains this winter.
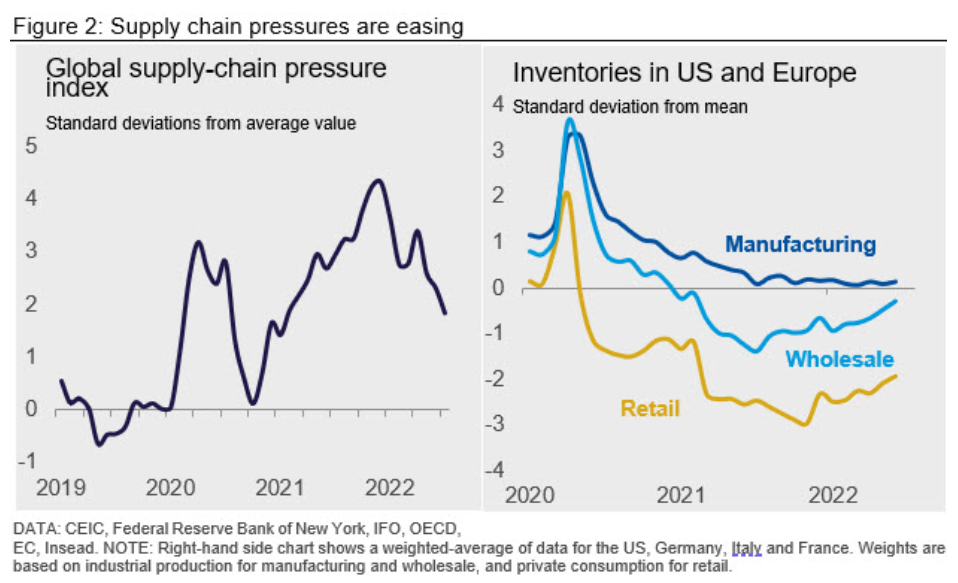
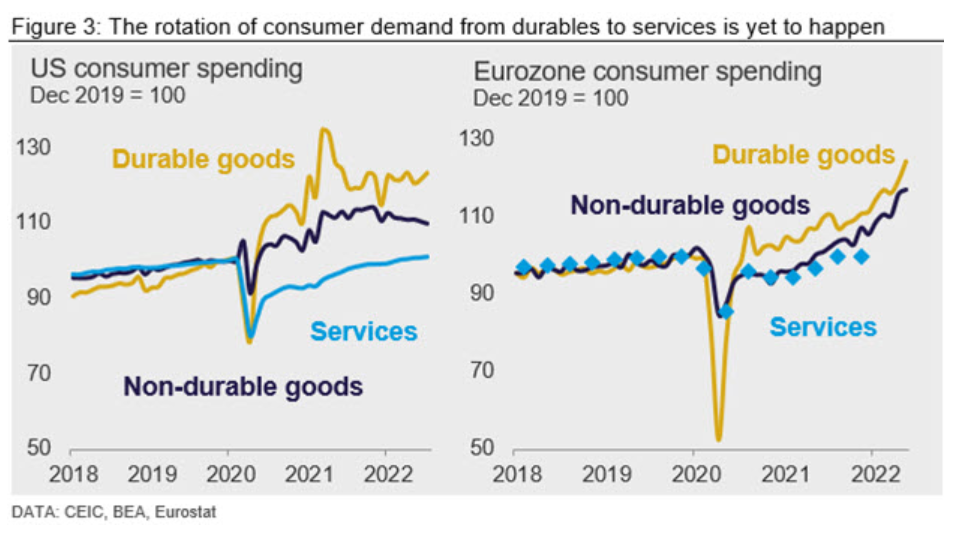
Finally, there are signs that weaker demand is coming. Consumer and business confidence indicators have dropped dramatically in both the US and Europe to levels consistent with recession. So far, the ‘hard’ data for consumer spending has yet to collapse in the same way. However, there are warning signs. The build-up in retail inventories (Figure 2, right-hand side) could partly signal consumer demand is slowing. The rotation away from durables (which are relatively energy intensive) towards services is still yet to happen in either the US or Europe (Figure 3). But spending on non-durables (which includes fuel) has weakened noticeably in the US.
The housing market is rapidly slowing under the weight of higher mortgage rates. Consumer spending in China has recovered somewhat from the lockdowns but remains anemic. Both the reality and fear of demand destruction have clearly played a role in reducing energy prices, as US consumers limit their driving and manufacturers in energy-intensive sectors across Europe shut down their operations.
That has an immediate disinflationary effect. An actual recession – which we expect in both Europe in 2022 H2 – or a slowdown to below-trend growth – which we expect in the US in 2023 H1 – will create more sustained disinflationary forces. Further lockdowns in China – a high probability given the lack of a convincing exit strategy from their “Zero Covid” policy – will probably do more damage on the demand side (to consumer spending) than on the supply side, given past evidence.
There are still big upside risks to inflation. The oil market remains very tight, and the effect of sanctions is still unfolding. The energy crisis in Europe will continue to push inflation up, particularly if there is outright rationing of gas to key upstream industries such as chemicals and basic metals. The labor market remains very tight on both sides of the Atlantic (Figure 4). But the experience of China – which has seen CPI inflation at much lower rates since the pandemic (Figure 1, right-hand side) – shows that even the powerful inflationary forces currently sweeping the world are not immune to sustained weakness in the labor market and consumer spending.
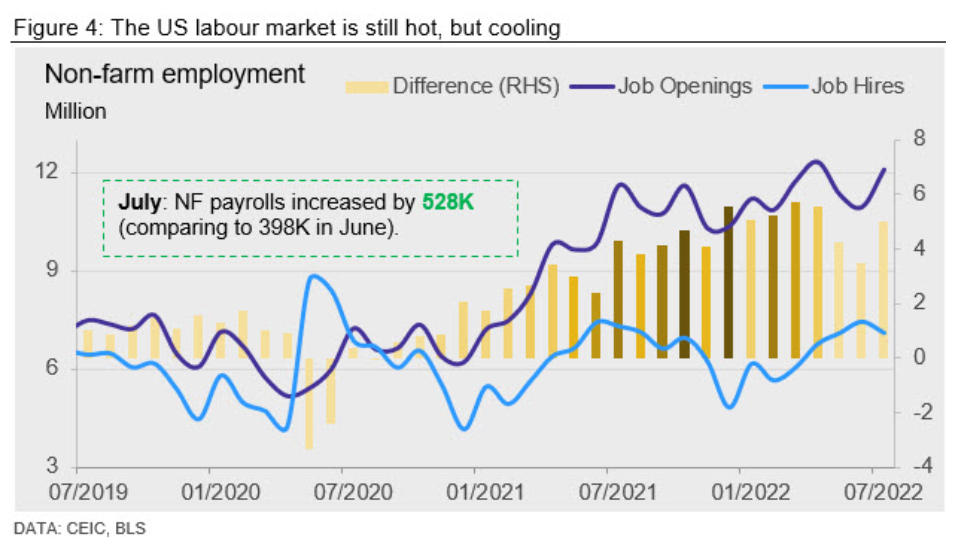
Figure 5 summarizes the key changes to our forecast.
This article was originally published on Sept. 2 by CRU, SMU’s parent company.
Request more information about this topic.
Learn more about CRU’s services at www.crugroup.com


