Market Data

September 16, 2022
Service Center Shipments and Inventories Report for August
Written by Estelle Tran
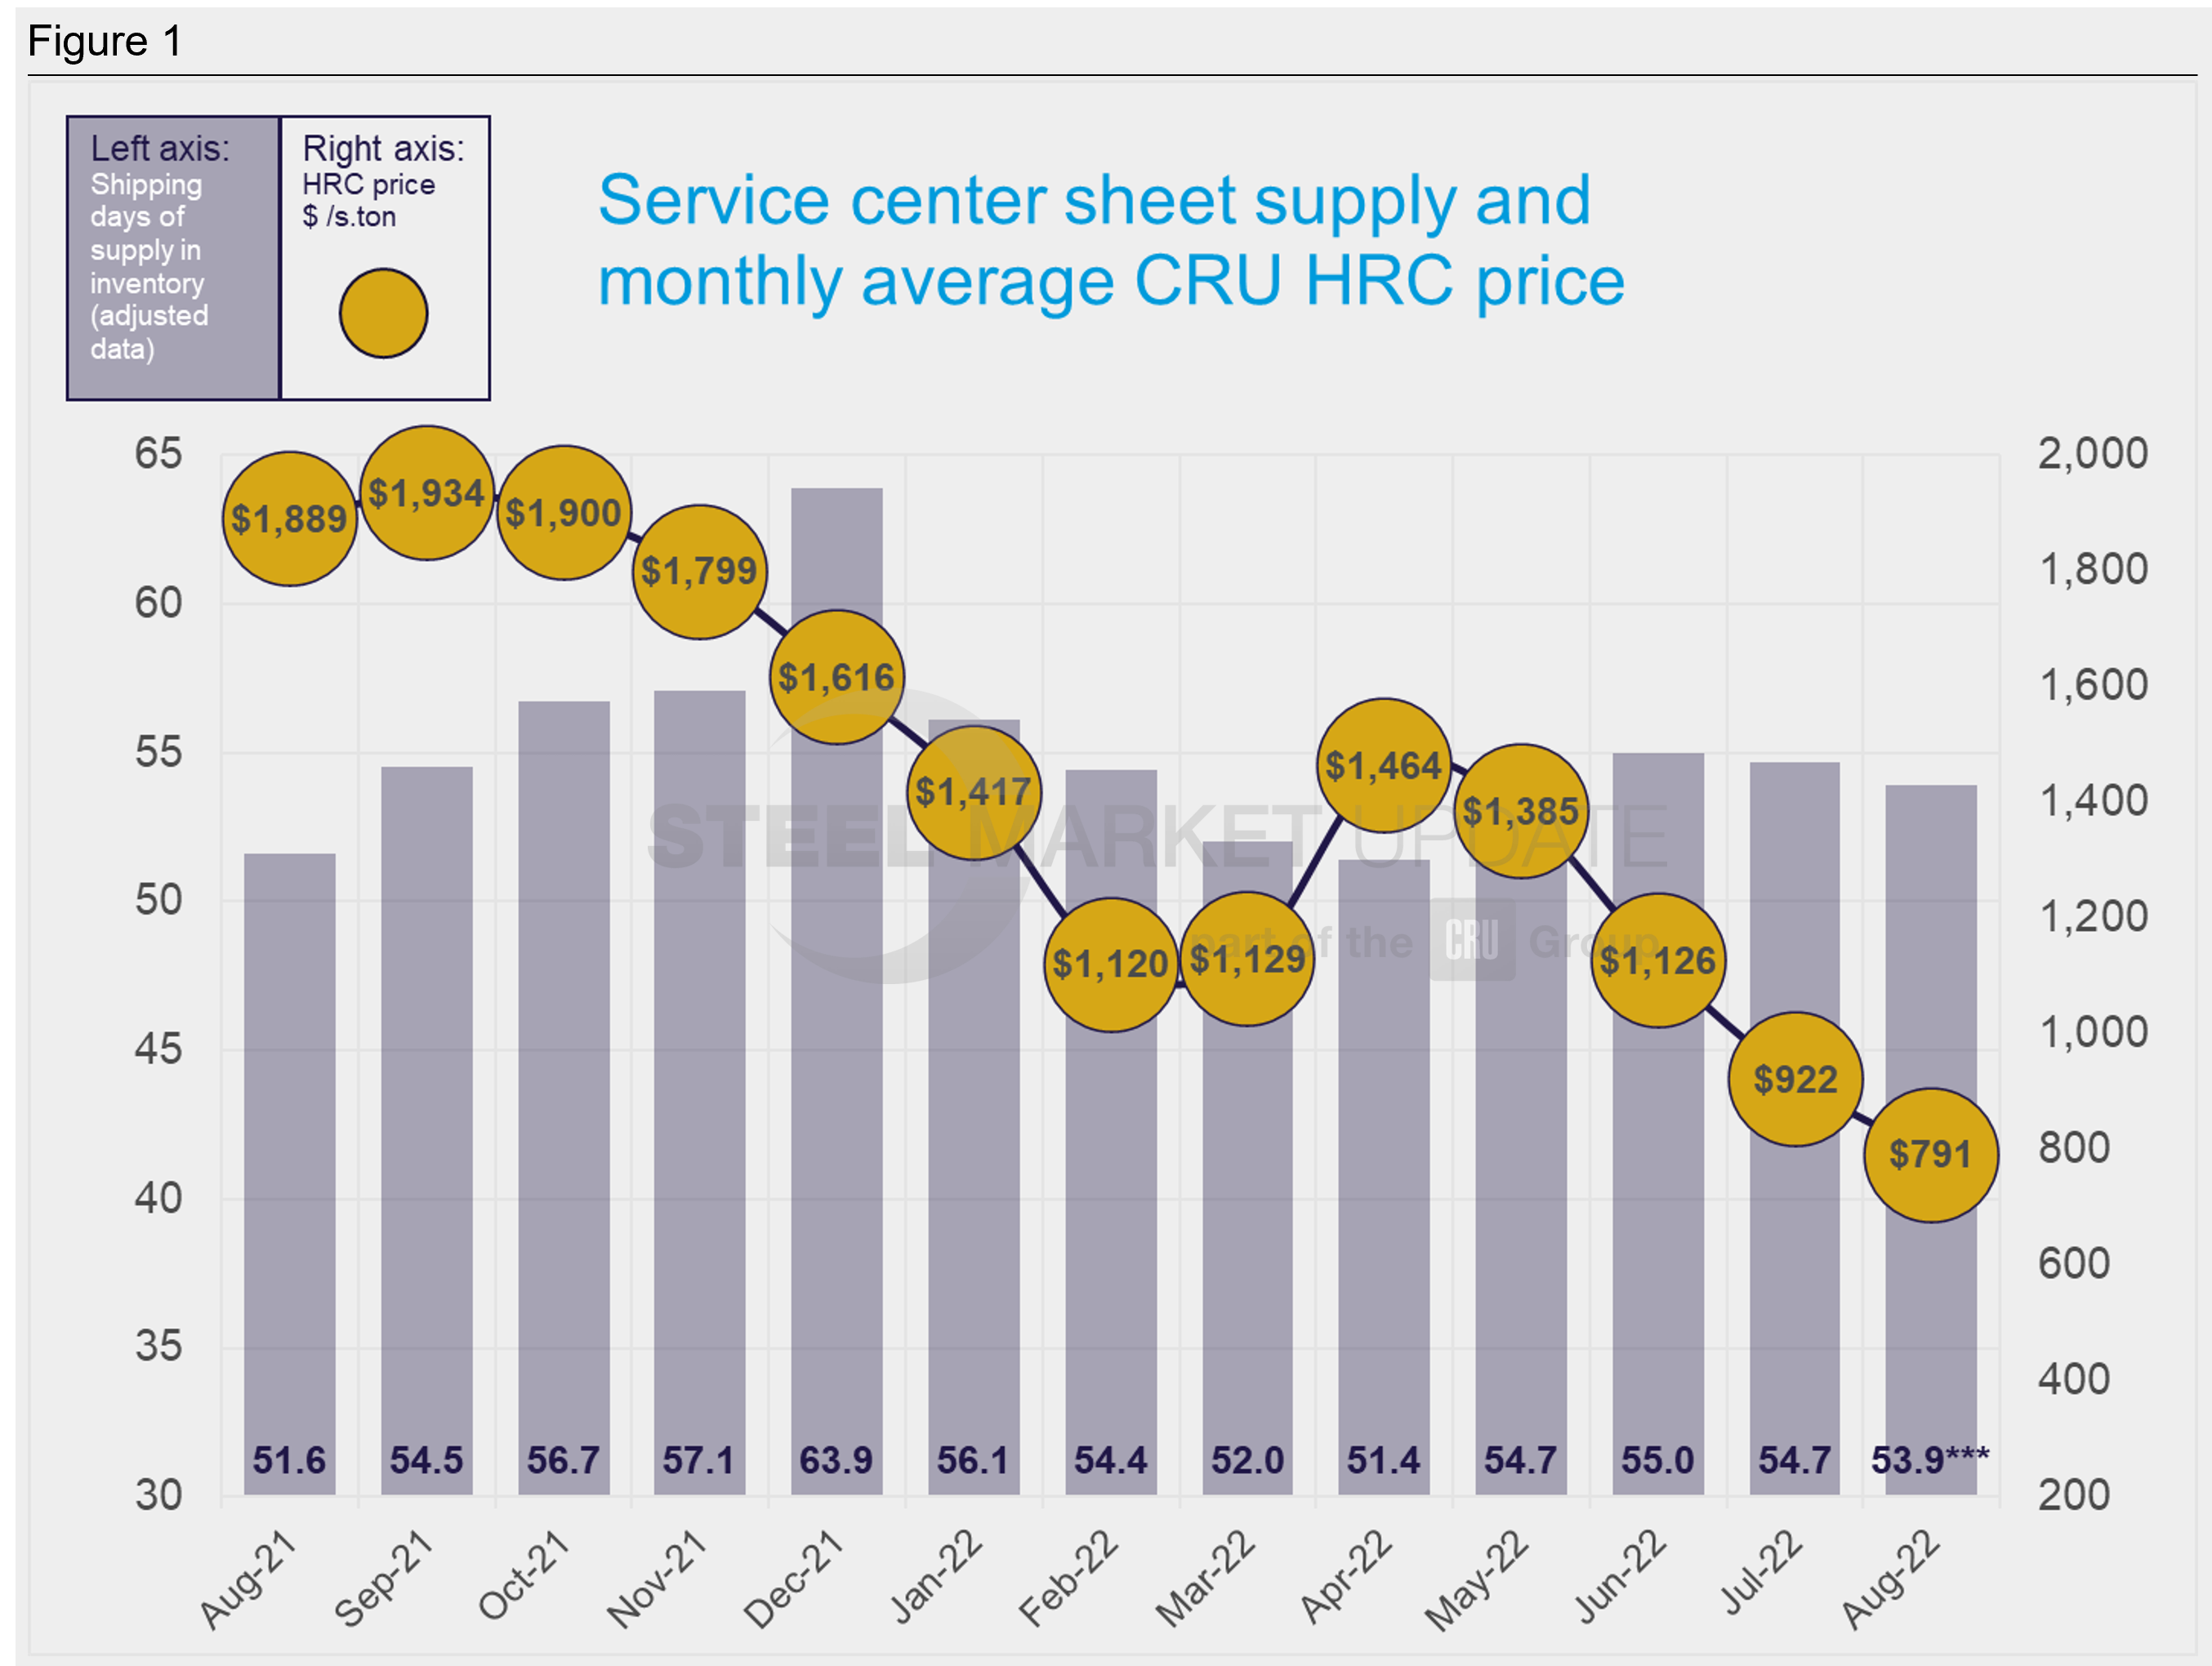
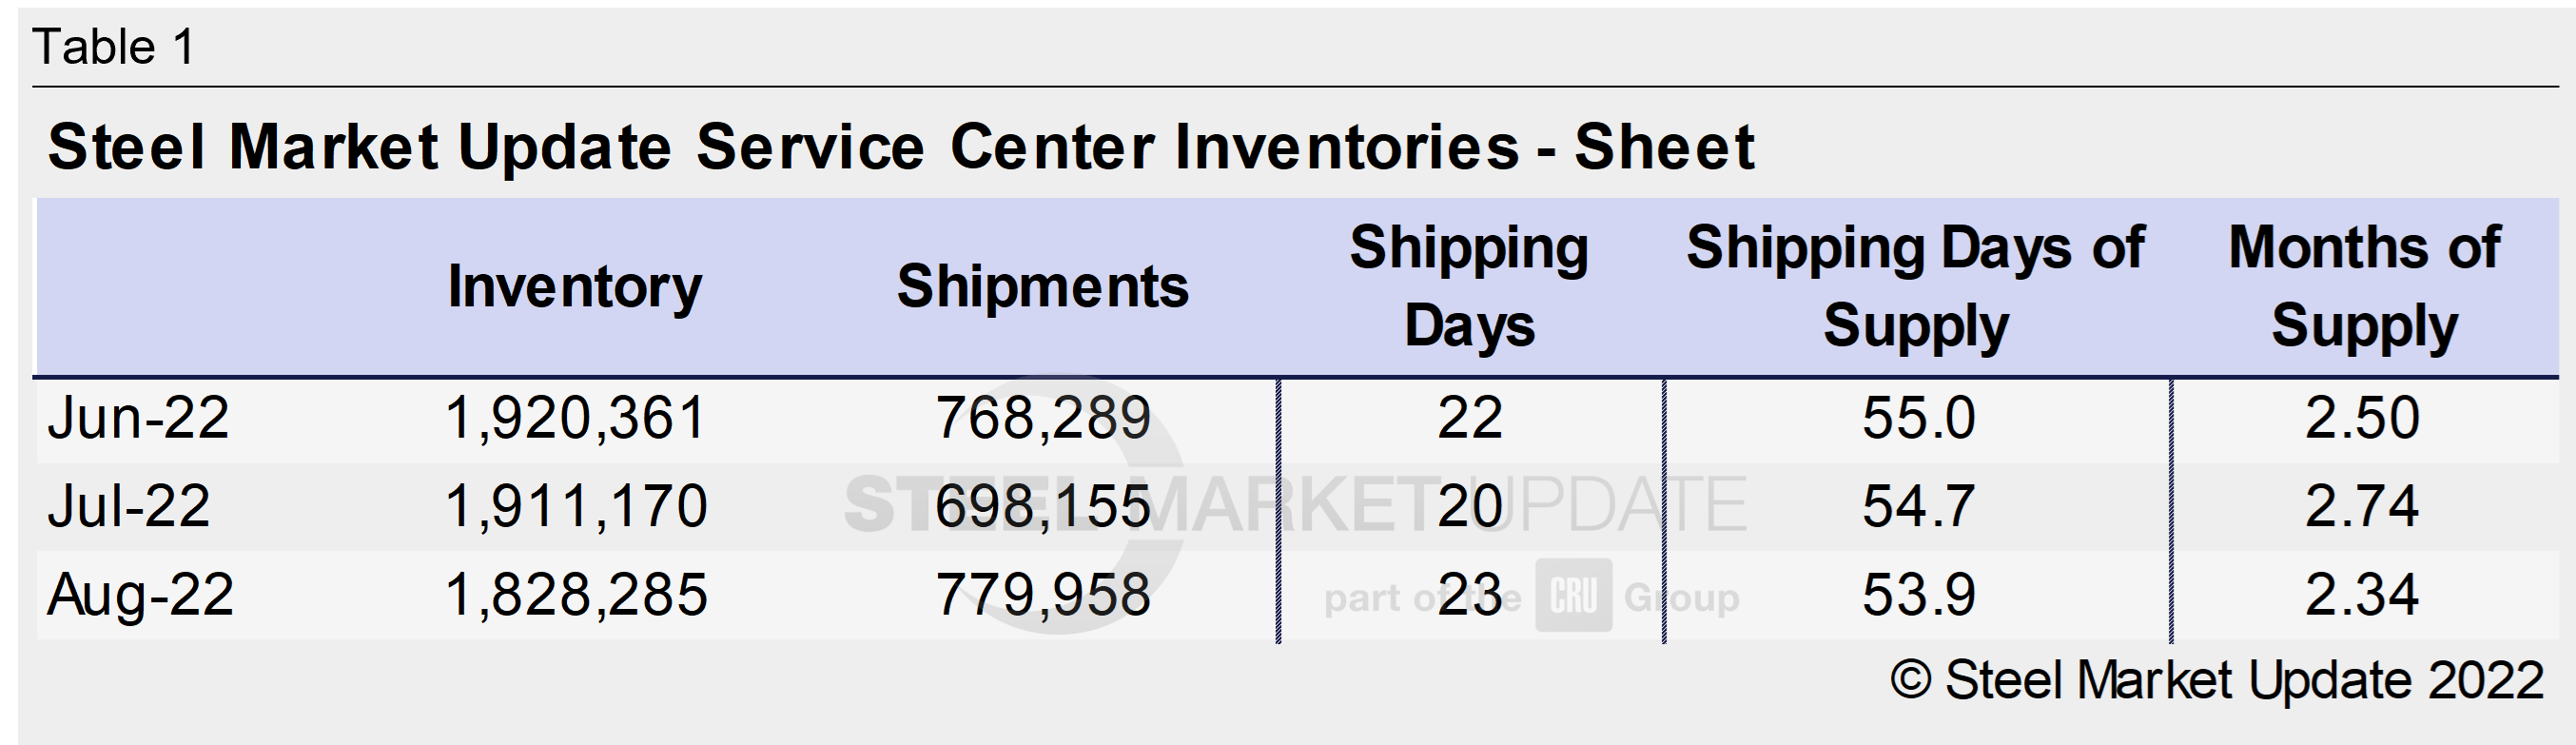
Flat Rolled = 53.9 Shipping Days of Supply
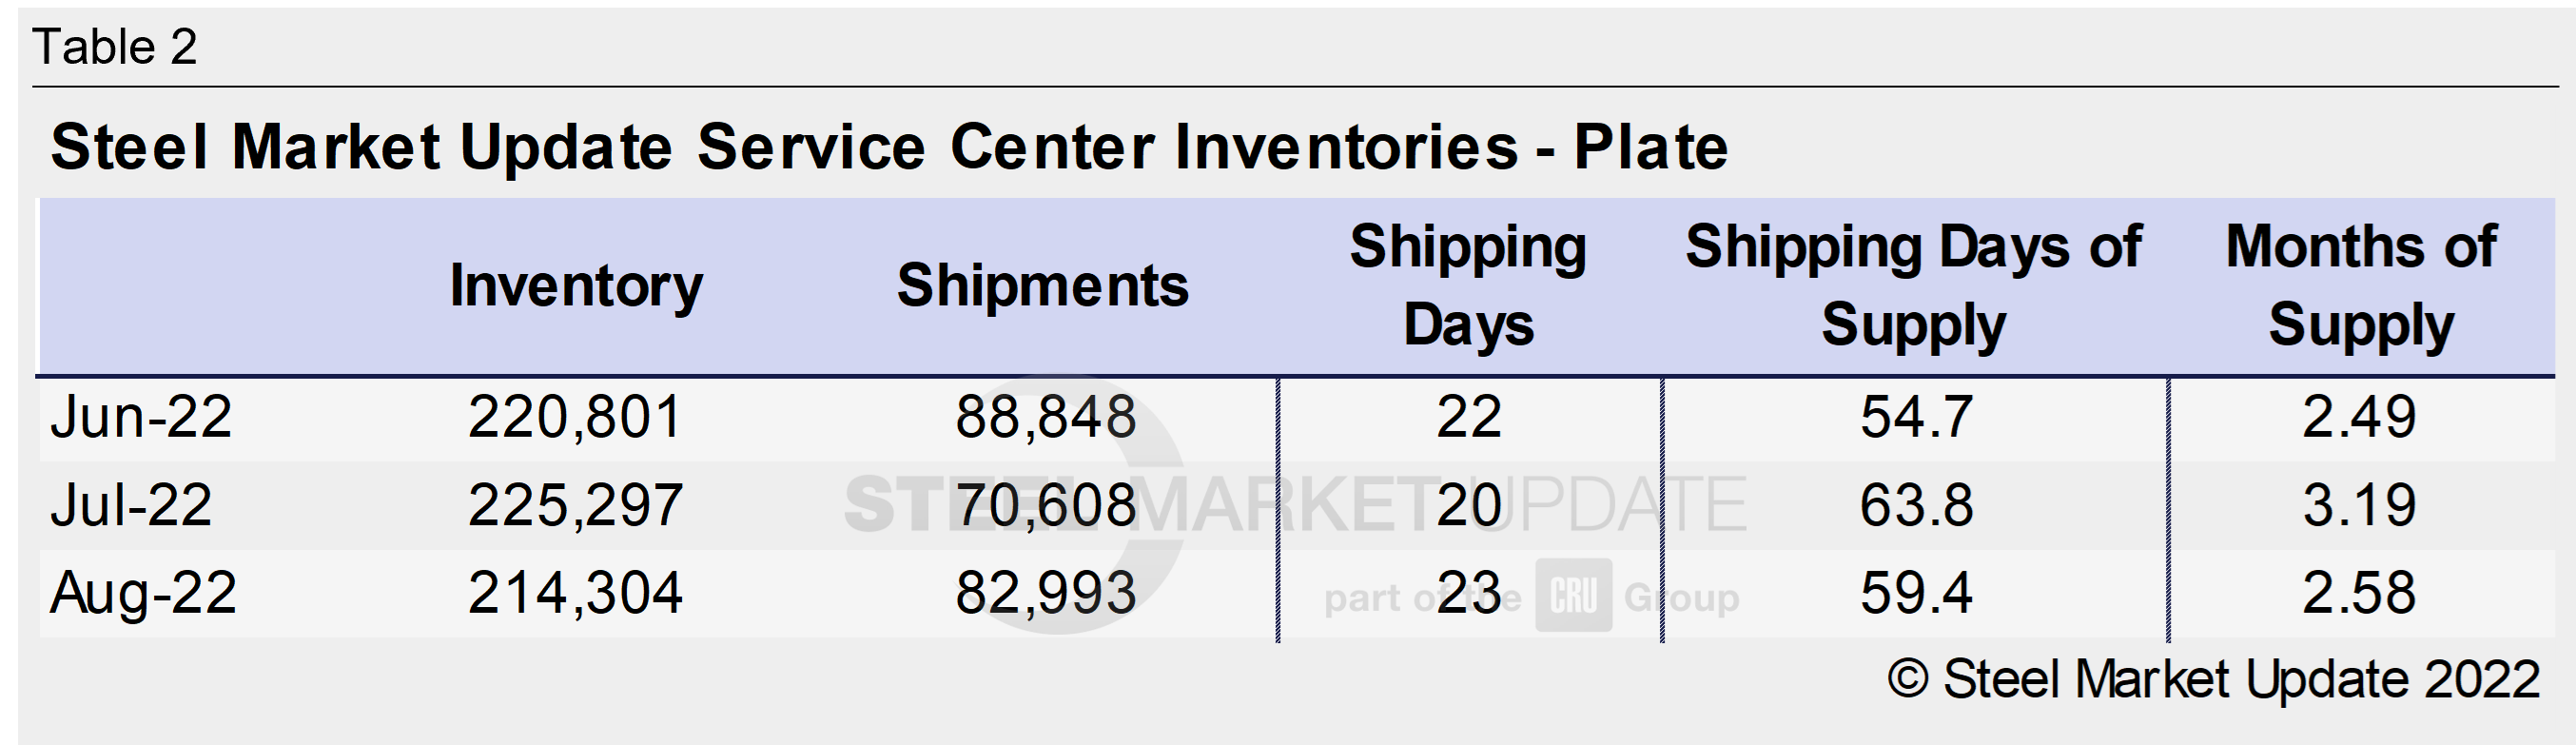
Plate = 59.4 Shipping Days of Supply
Flat Rolled
US service center flat rolled inventories edged down month on month in August, though the amount of material on order spiked, according to Steel Market Update data. At the end of August, service centers had 53.9 shipping days of supply on hand on an adjusted basis. This is down slightly from 54.7 shipping days of supply in July. There is some distortion in the months of supply data because August had 23 shipping days, compared to 20 in July. At the end of August, service centers had 2.34 months of supply, down from 2.74 months in July.
With the increase in shipping days, there should be an increase in shipments. Demand was slow in August because of typical seasonal factors, manufacturers revising down demand forecasts, and buying hesitancy as prices were falling.
Prices found a floor in August, which coincided with some opportunistic purchases. The amount of inventory on order jumped in August.
In August, there was also typical seasonal restocking to account for the expected pickup in demand in the fall. Mill price increase announcements, as well as resumed buying, have stabilized pricing. Some service center contacts have said that they were concerned about not having enough material to meet customers’ needs and also bought more out of concern about supply tightness caused by mill outages.
Multiple service center contacts said that they have rightsized their inventories to account for softening demand, and inventories were around historical levels for August. With the massive amount of inventory on order though, inventories can quickly swing back into surplus.
Plate
US service center plate inventories edged back down in August after spiking in July. Early production caused plate inventories to balloon to 63.8 shipping days of supply in July, and in August, that has gone down to 59.4 shipping days of supply. Plate inventories are slightly higher than historical levels, however, with the decrease in inventory, they are in better balance with demand.
In terms of months on hand, service centers had 2.58 months of supply on hand in August, down from 3.19 days in July. The amount of material on order also fell back to a more normal level in August.
Plate mill lead times have also shortened. Market contacts are still expecting prices to soften with the ramp-up of new mill capacity this year.
By Estelle Tran, Estelle.Tran@CRUGroup.com