

Market Data

September 22, 2022
ABI: Demand for Design Services Accelerates in August
Written by David Schollaert
Demand for design services from US architecture firms continued to grow in August, with the pace of growth inching upward month-on-month.
The August AIA Architecture Billings Index (ABI) score was up for the first time in five months. The development also marked the 19th consecutive month of growth following the pandemic-induced downturn in 2020.
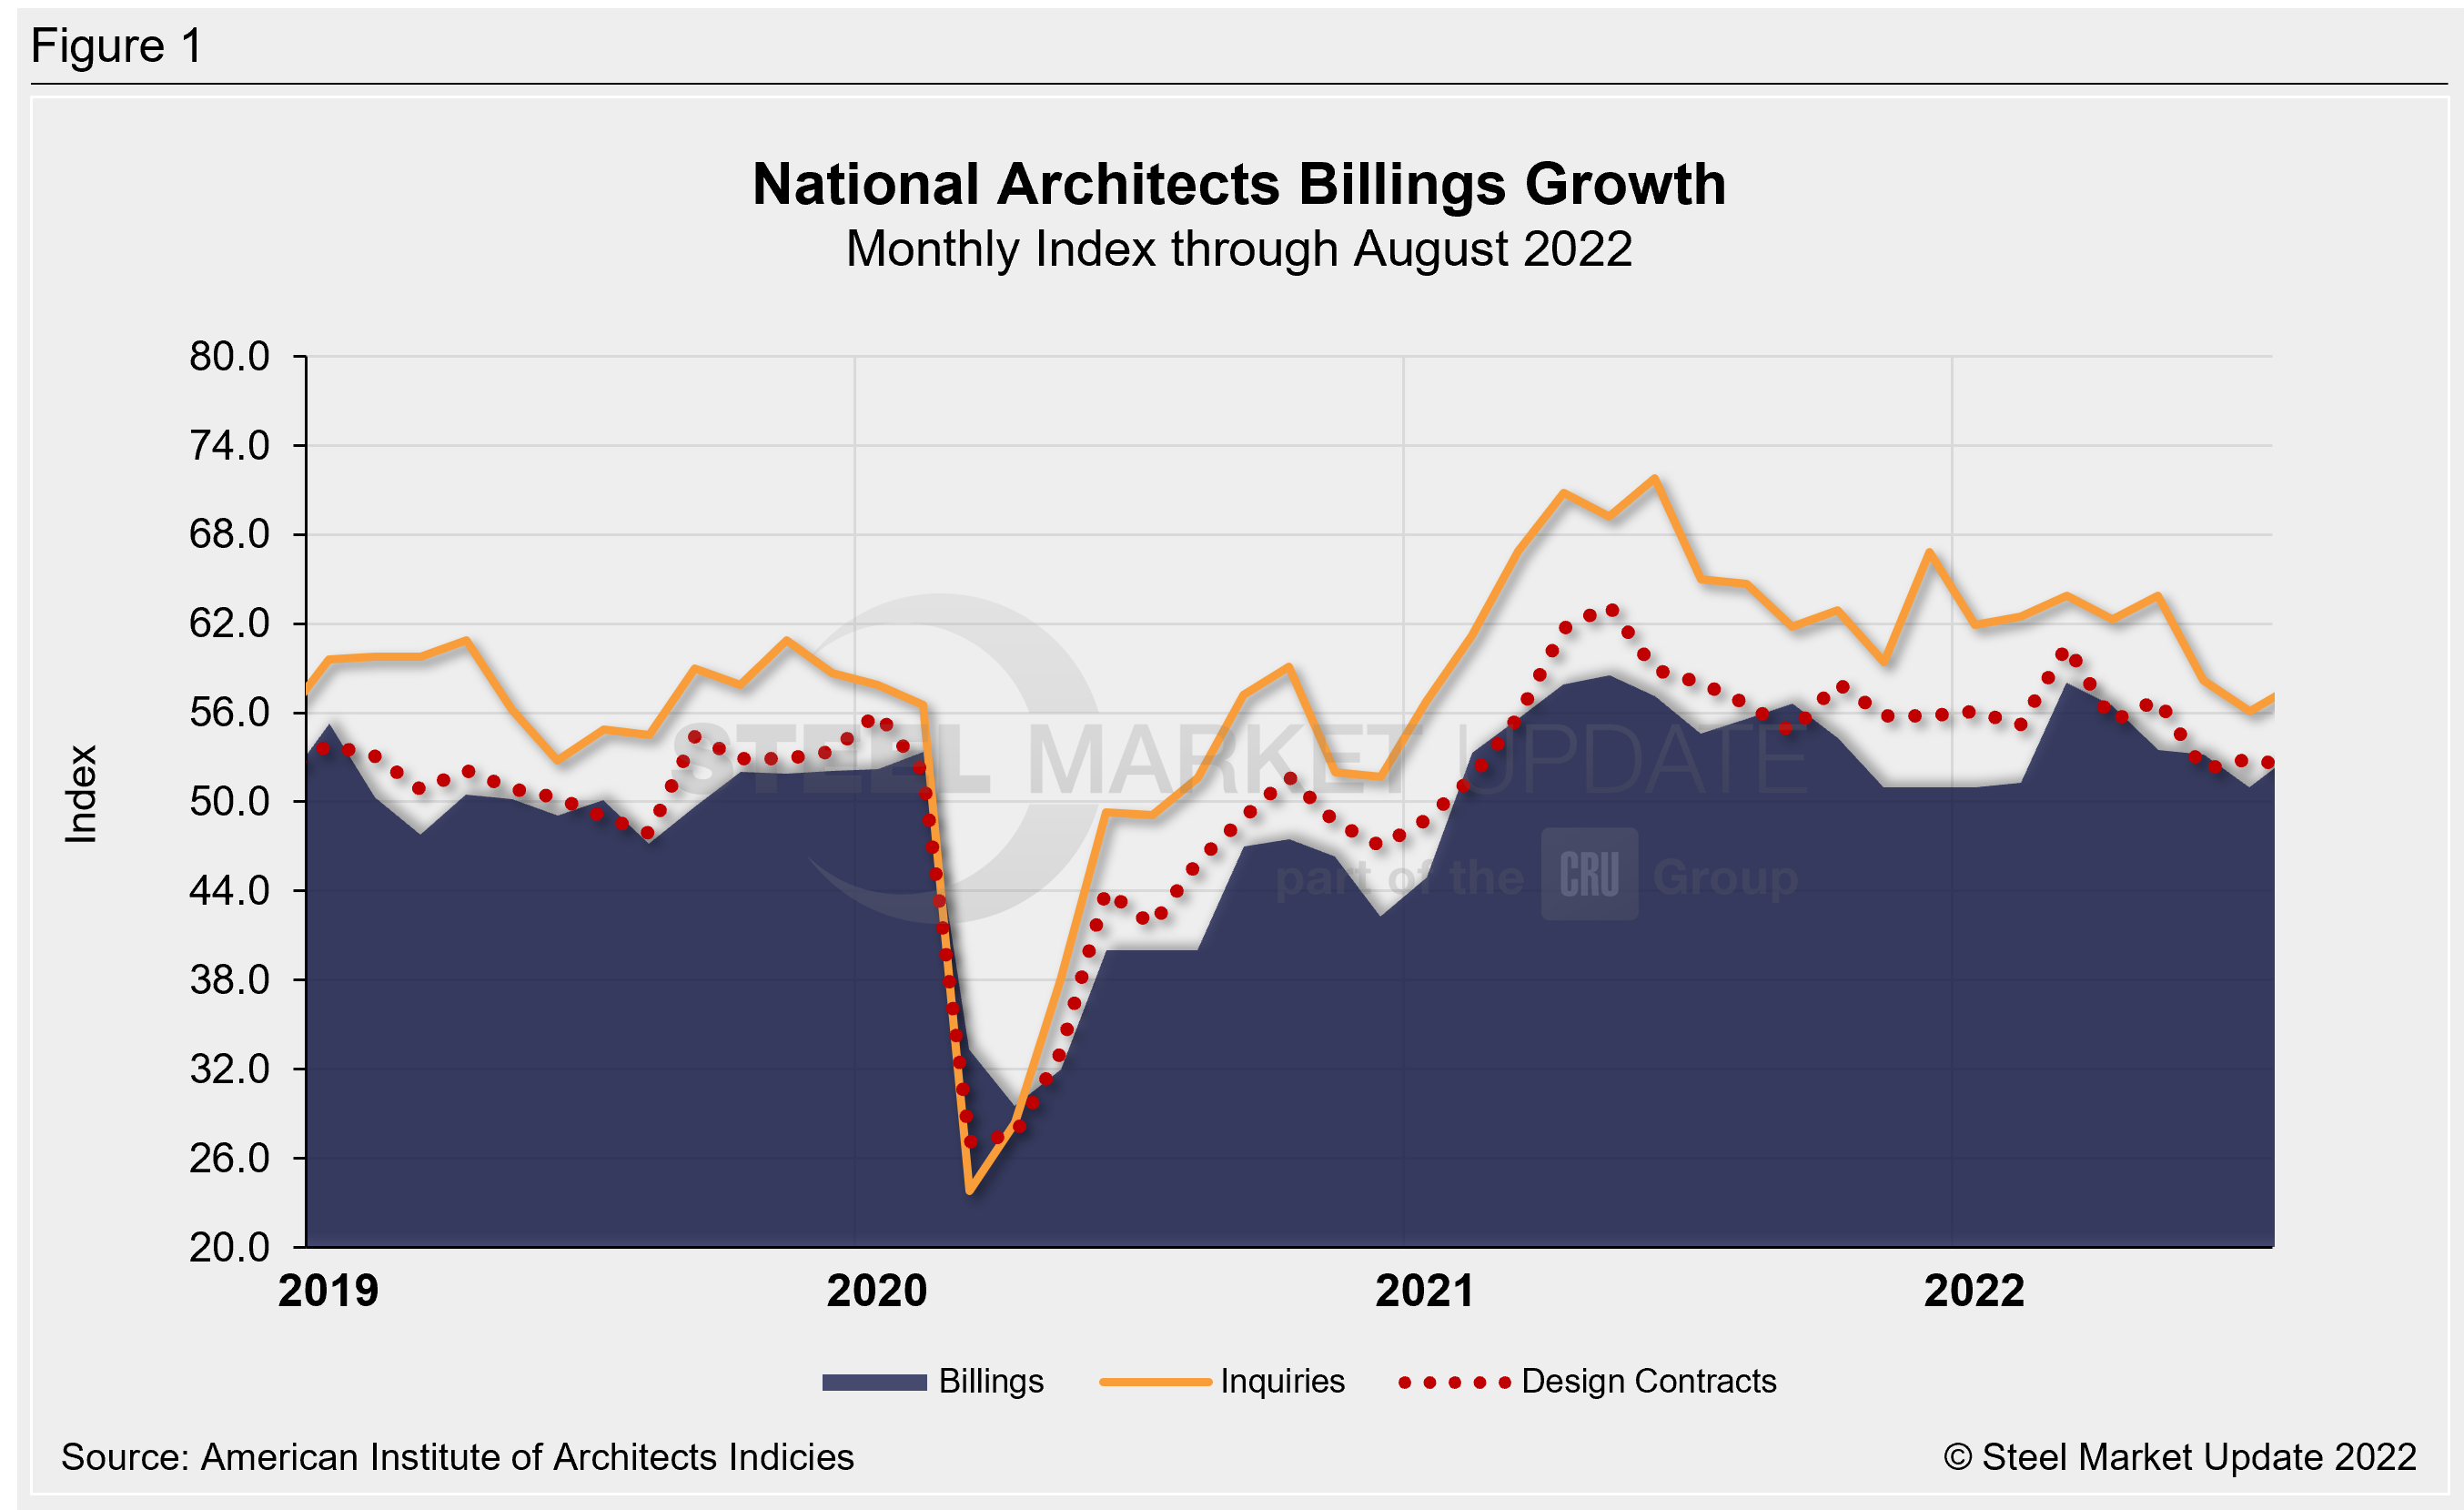
Recall that the ABI is an advanced economic indicator for nonresidential construction activity with a lead time of 9–12 months. A score above 50 indicates an increase in activity, and a score below 50 indicates a decrease.
The August ABI registered 53.3, up from July’s score of 51, according to the latest report from the American Institute of Architects (AIA). Last month’s score was an improvement after July posted the lowest score since January.
The prior four ABIs reported slower growth following a post-pandemic surge that began in January 2021. But it was followed up by nationwide issues such as inflation and economic uncertainty. That’s why the increase to 53.3 last month was a welcomed surprise.
This gain indicates that, nationally, business conditions at architecture firms have “remained generally strong,” according to the AIA.
August saw a big increase in new project inquiries compared to the previous month, 57.9 and 56.1, respectively. Design contracts dipped slightly to 52.3 from 52.9.
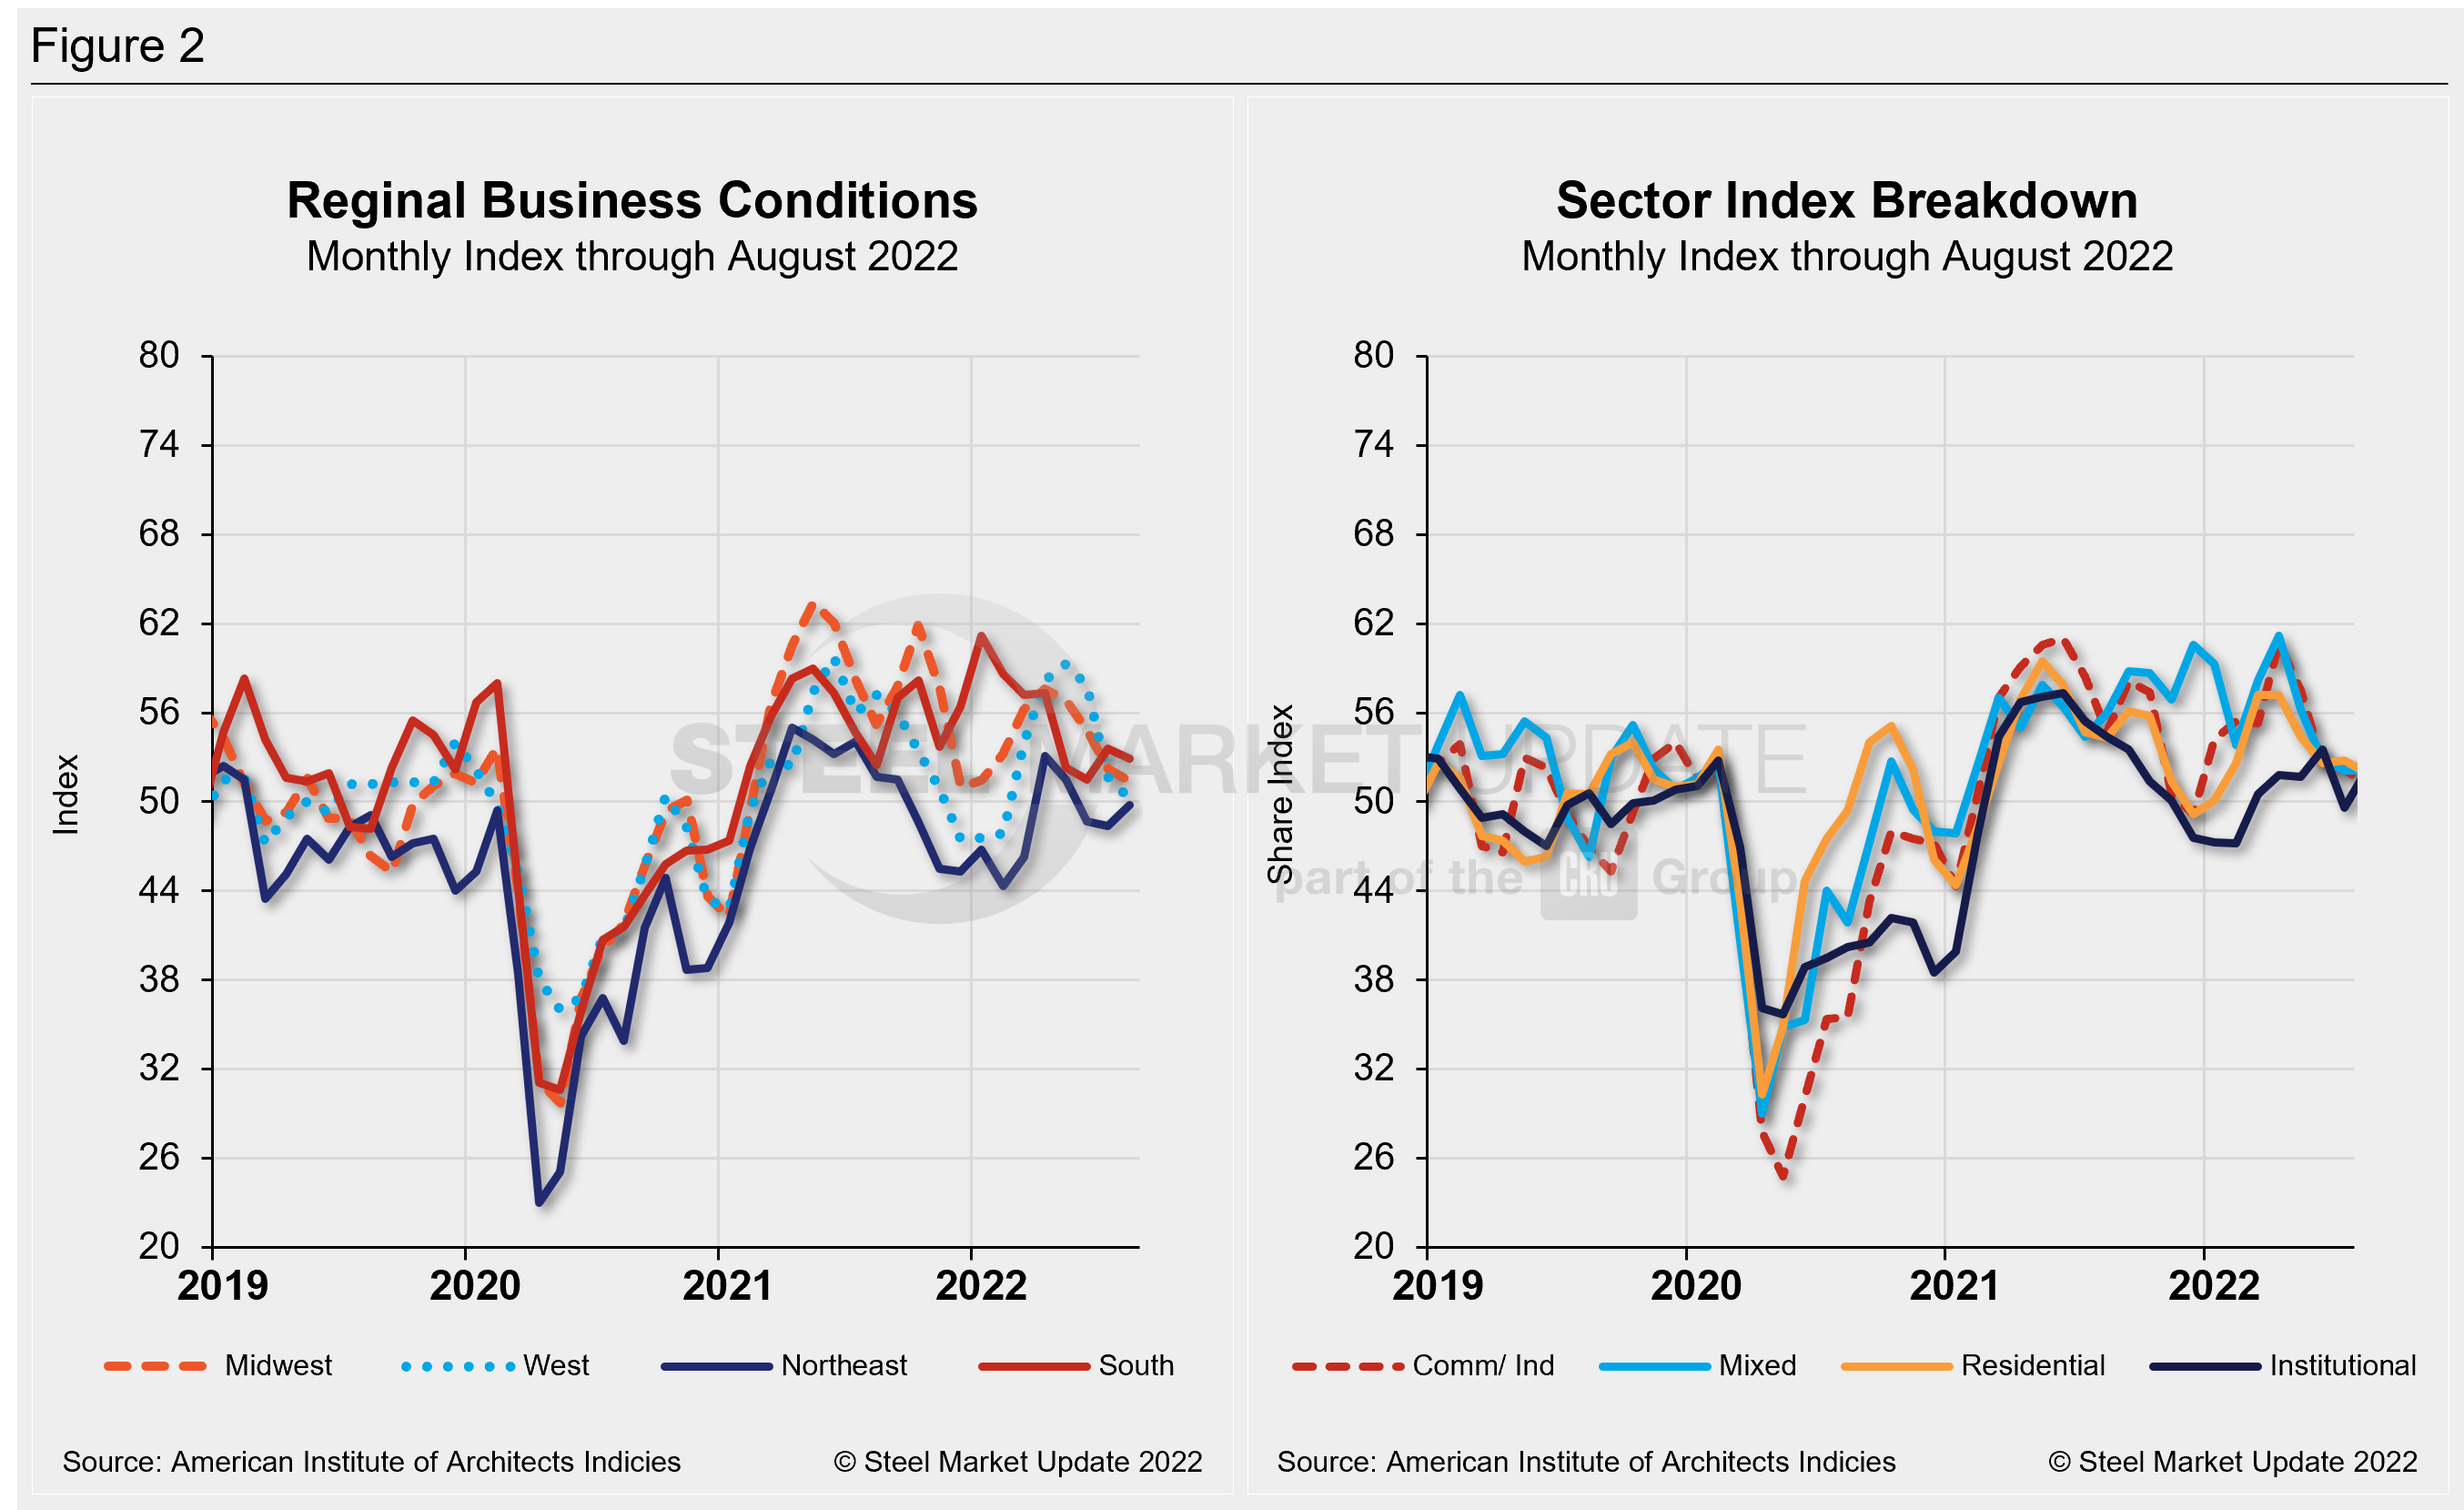
While the national average ABI score increased, business conditions in the Northeast remain “softened” with a score of 49.8, up only slightly compared to July’s 48.4. In the South, conditions “held steady” and are again—for the second consecutive month—the strongest regionally, coming in at 53.6 compared to 52.9 last month. Regional billings scores are calculated as three-month moving averages (3MMA) and are displayed in Figure 2.
As for specializations at firms, another regular metric of the ABI, all sectors, residential, commercial, and institutional reported an increase in billings, with the strongest growth in multifamily residential and institutional projects.
Most architecture firms reported growing business conditions. But inflation, higher interest rates, and a continued shortage of building and construction materials mean the future view is less certain, the report said.
“While a strengthening billings score is encouraging, the flat scoring across regions and sectors is indicative of a nationwide deceleration over the next several months,” said AIA chief economist Kermit Baker. “A variety of economic storm clouds continue to gather, but since design activity continues to increase, we can expect at least another 9–12-month runway before building construction activity is negatively affected.”
Key ABI highlights for July include:
- Regional averages: South (52.9); Midwest (51.4); West (50.2); Northeast (49.8)
- Sector index breakdown: multi-family residential (52.0); institutional (52.0); commercial/industrial (51.2); mixed practice (51.2)
Regional and sector scores are calculated as 3MMA. Below are three charts showing the history of the AIA Architecture Billings Index, Reginal Business Conditions, and Sectors.
An interactive history of the AIA Architecture Billings Index is available on our website. Please contact us at info@SteelMarketUpdate.com if you need assistance logging into or navigating the website.
By David Schollaert, David@SteelMarketUpdate.com


