

Market Data

October 10, 2022
US Jobs Creation Slips Again But Was Better Than Expected
Written by David Schollaert
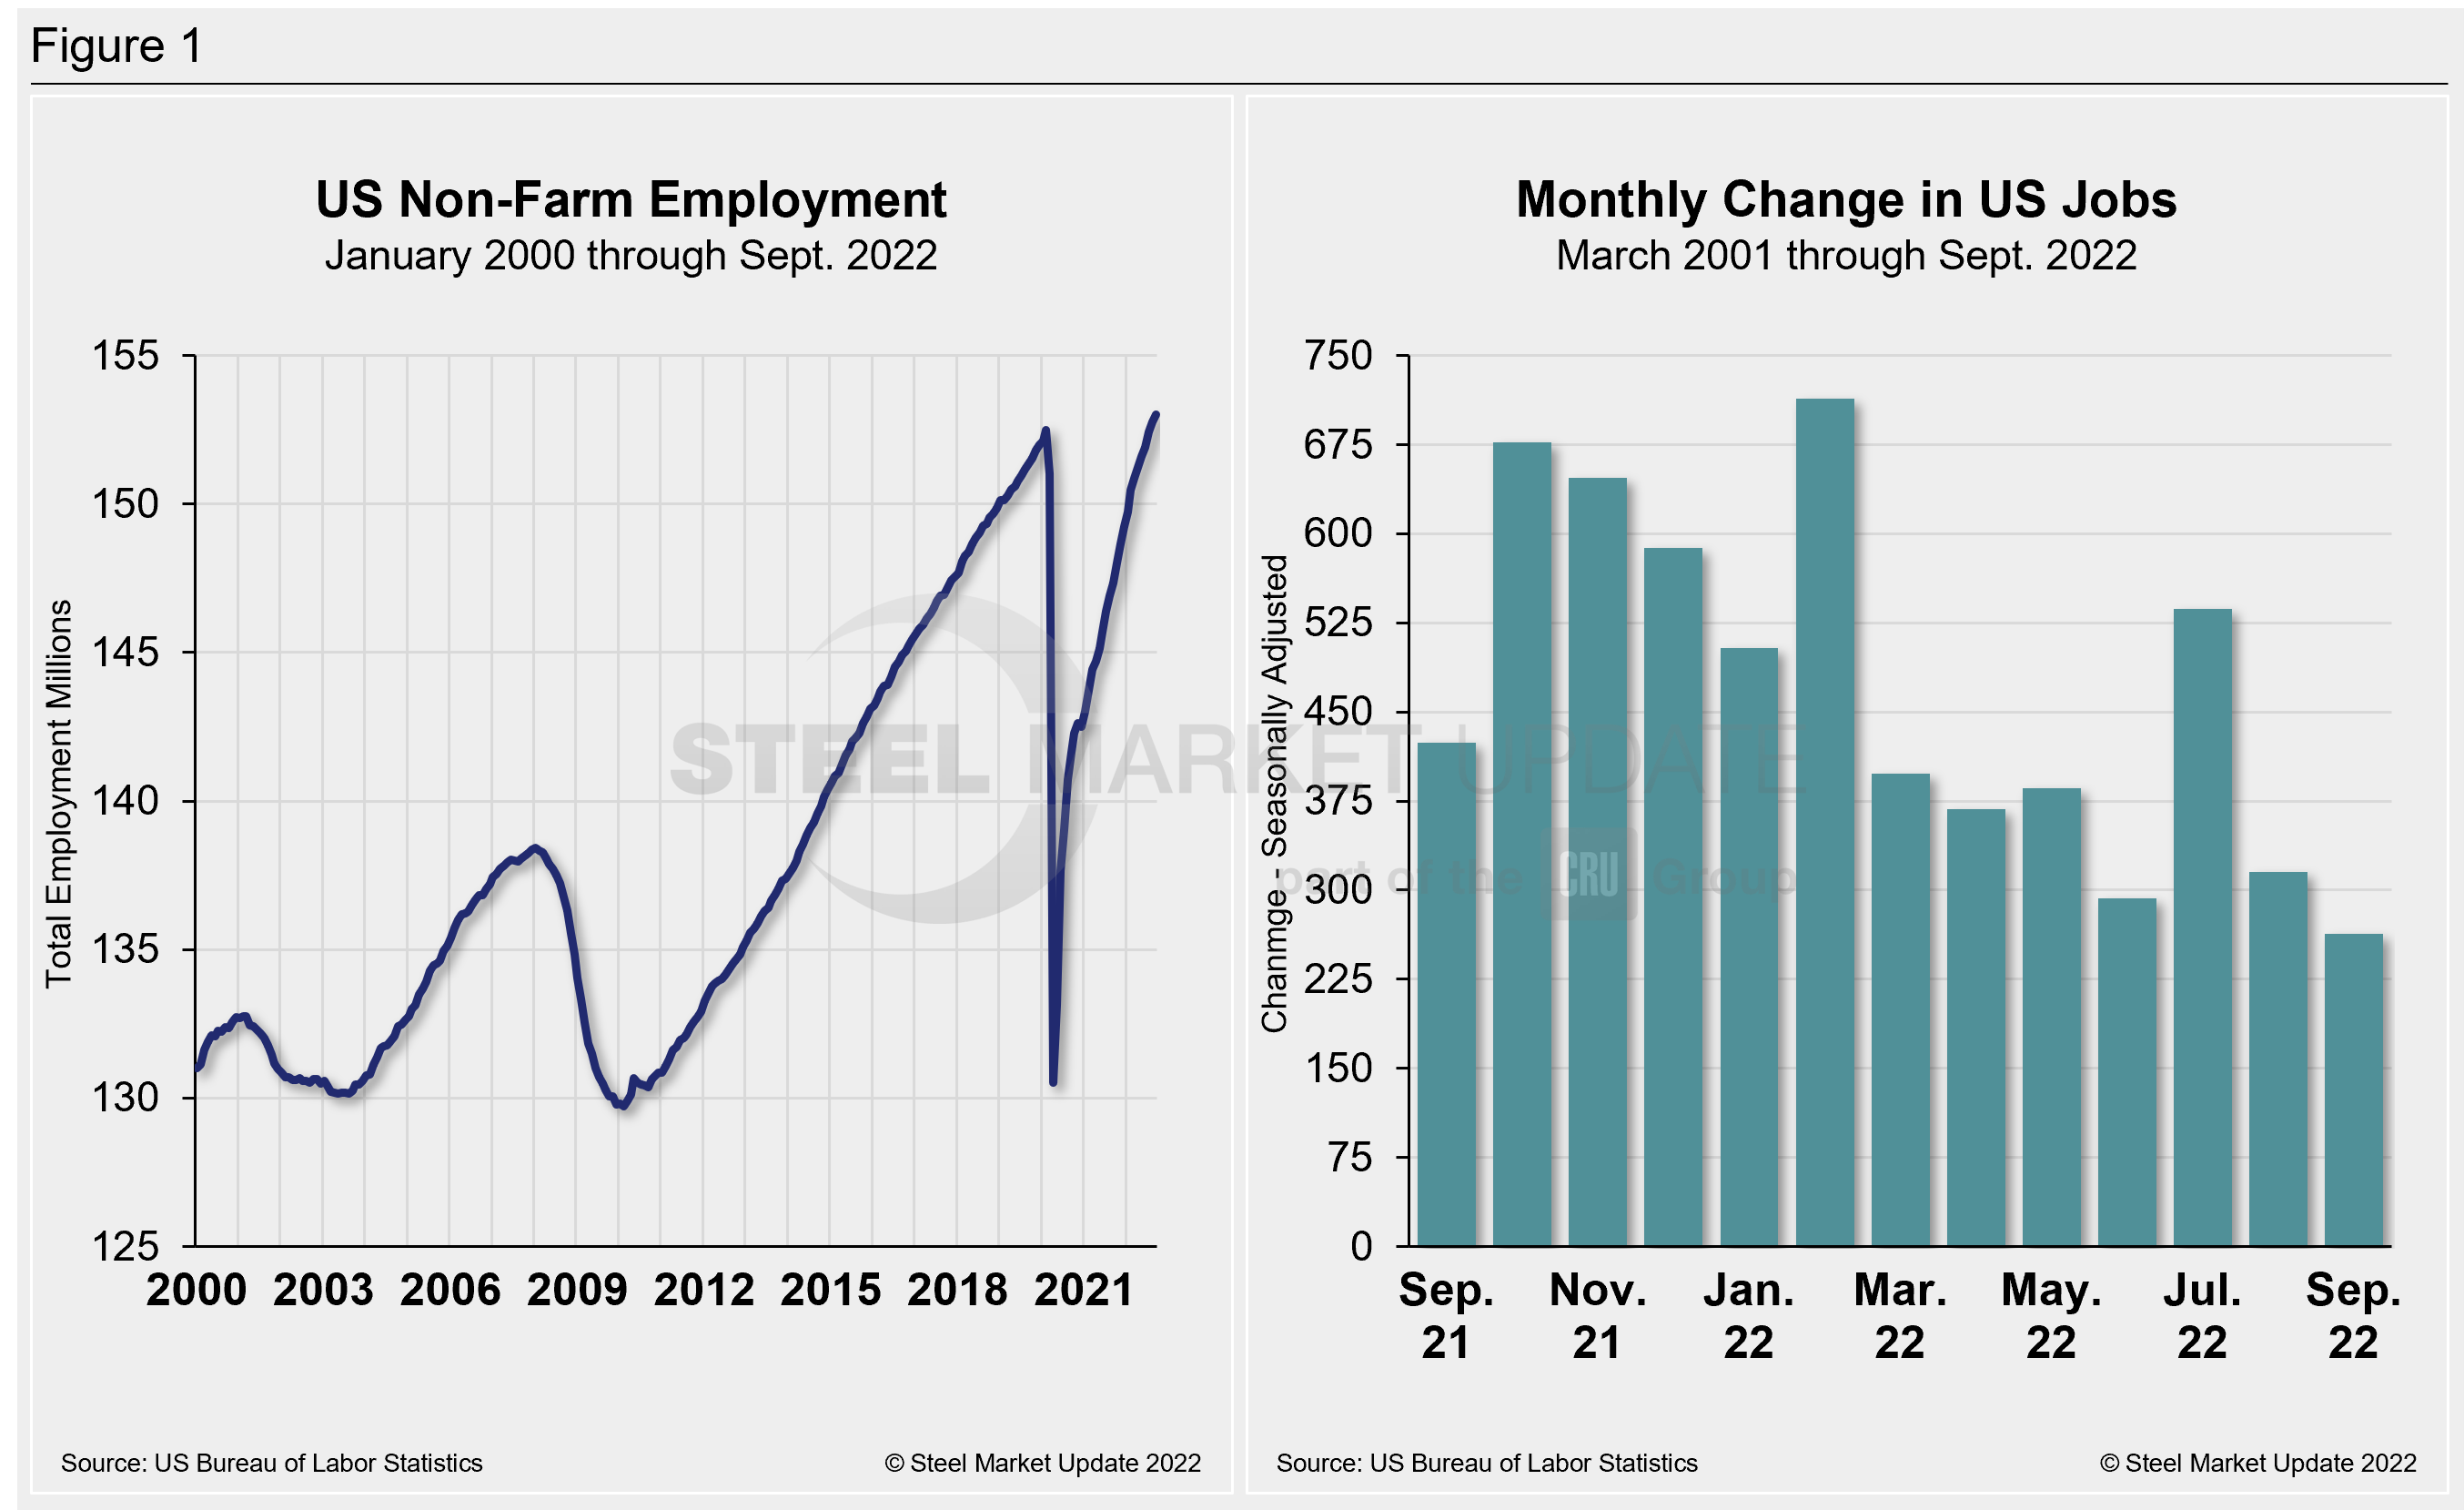
The US economy added 263,000 new jobs in September, slowing for the second straight month and marking the lowest monthly total since April 2021, according to data from the US Department of Labor.
Despite the repeated decline in hiring, last month’s total was still solid by pre-pandemic standards and slightly ahead of the expected payroll additions. The unemployment rate fell to 3.5% in September, matching a five-decade low.
The employment growth was widespread across industries, with healthcare and leisure, and hospitality, again seeing some of the biggest gains.
In September, leisure and hospitality led the way with 83,000 jobs added, followed by 60,000 new healthcare jobs. Professional and business services continued an upward trend last month but climbed at a slower pace, adding 46,000 payrolls. Manufacturing jobs rose by 22,000 in September. Meanwhile, payrolls fell by 8,000 in the transportation and warehousing sector and the financial services sector.
Side-by-side in Figure 1 below is a snapshot of the pace of hiring since April 2021 and the total number of non-farm workers employed in the US since 2000.
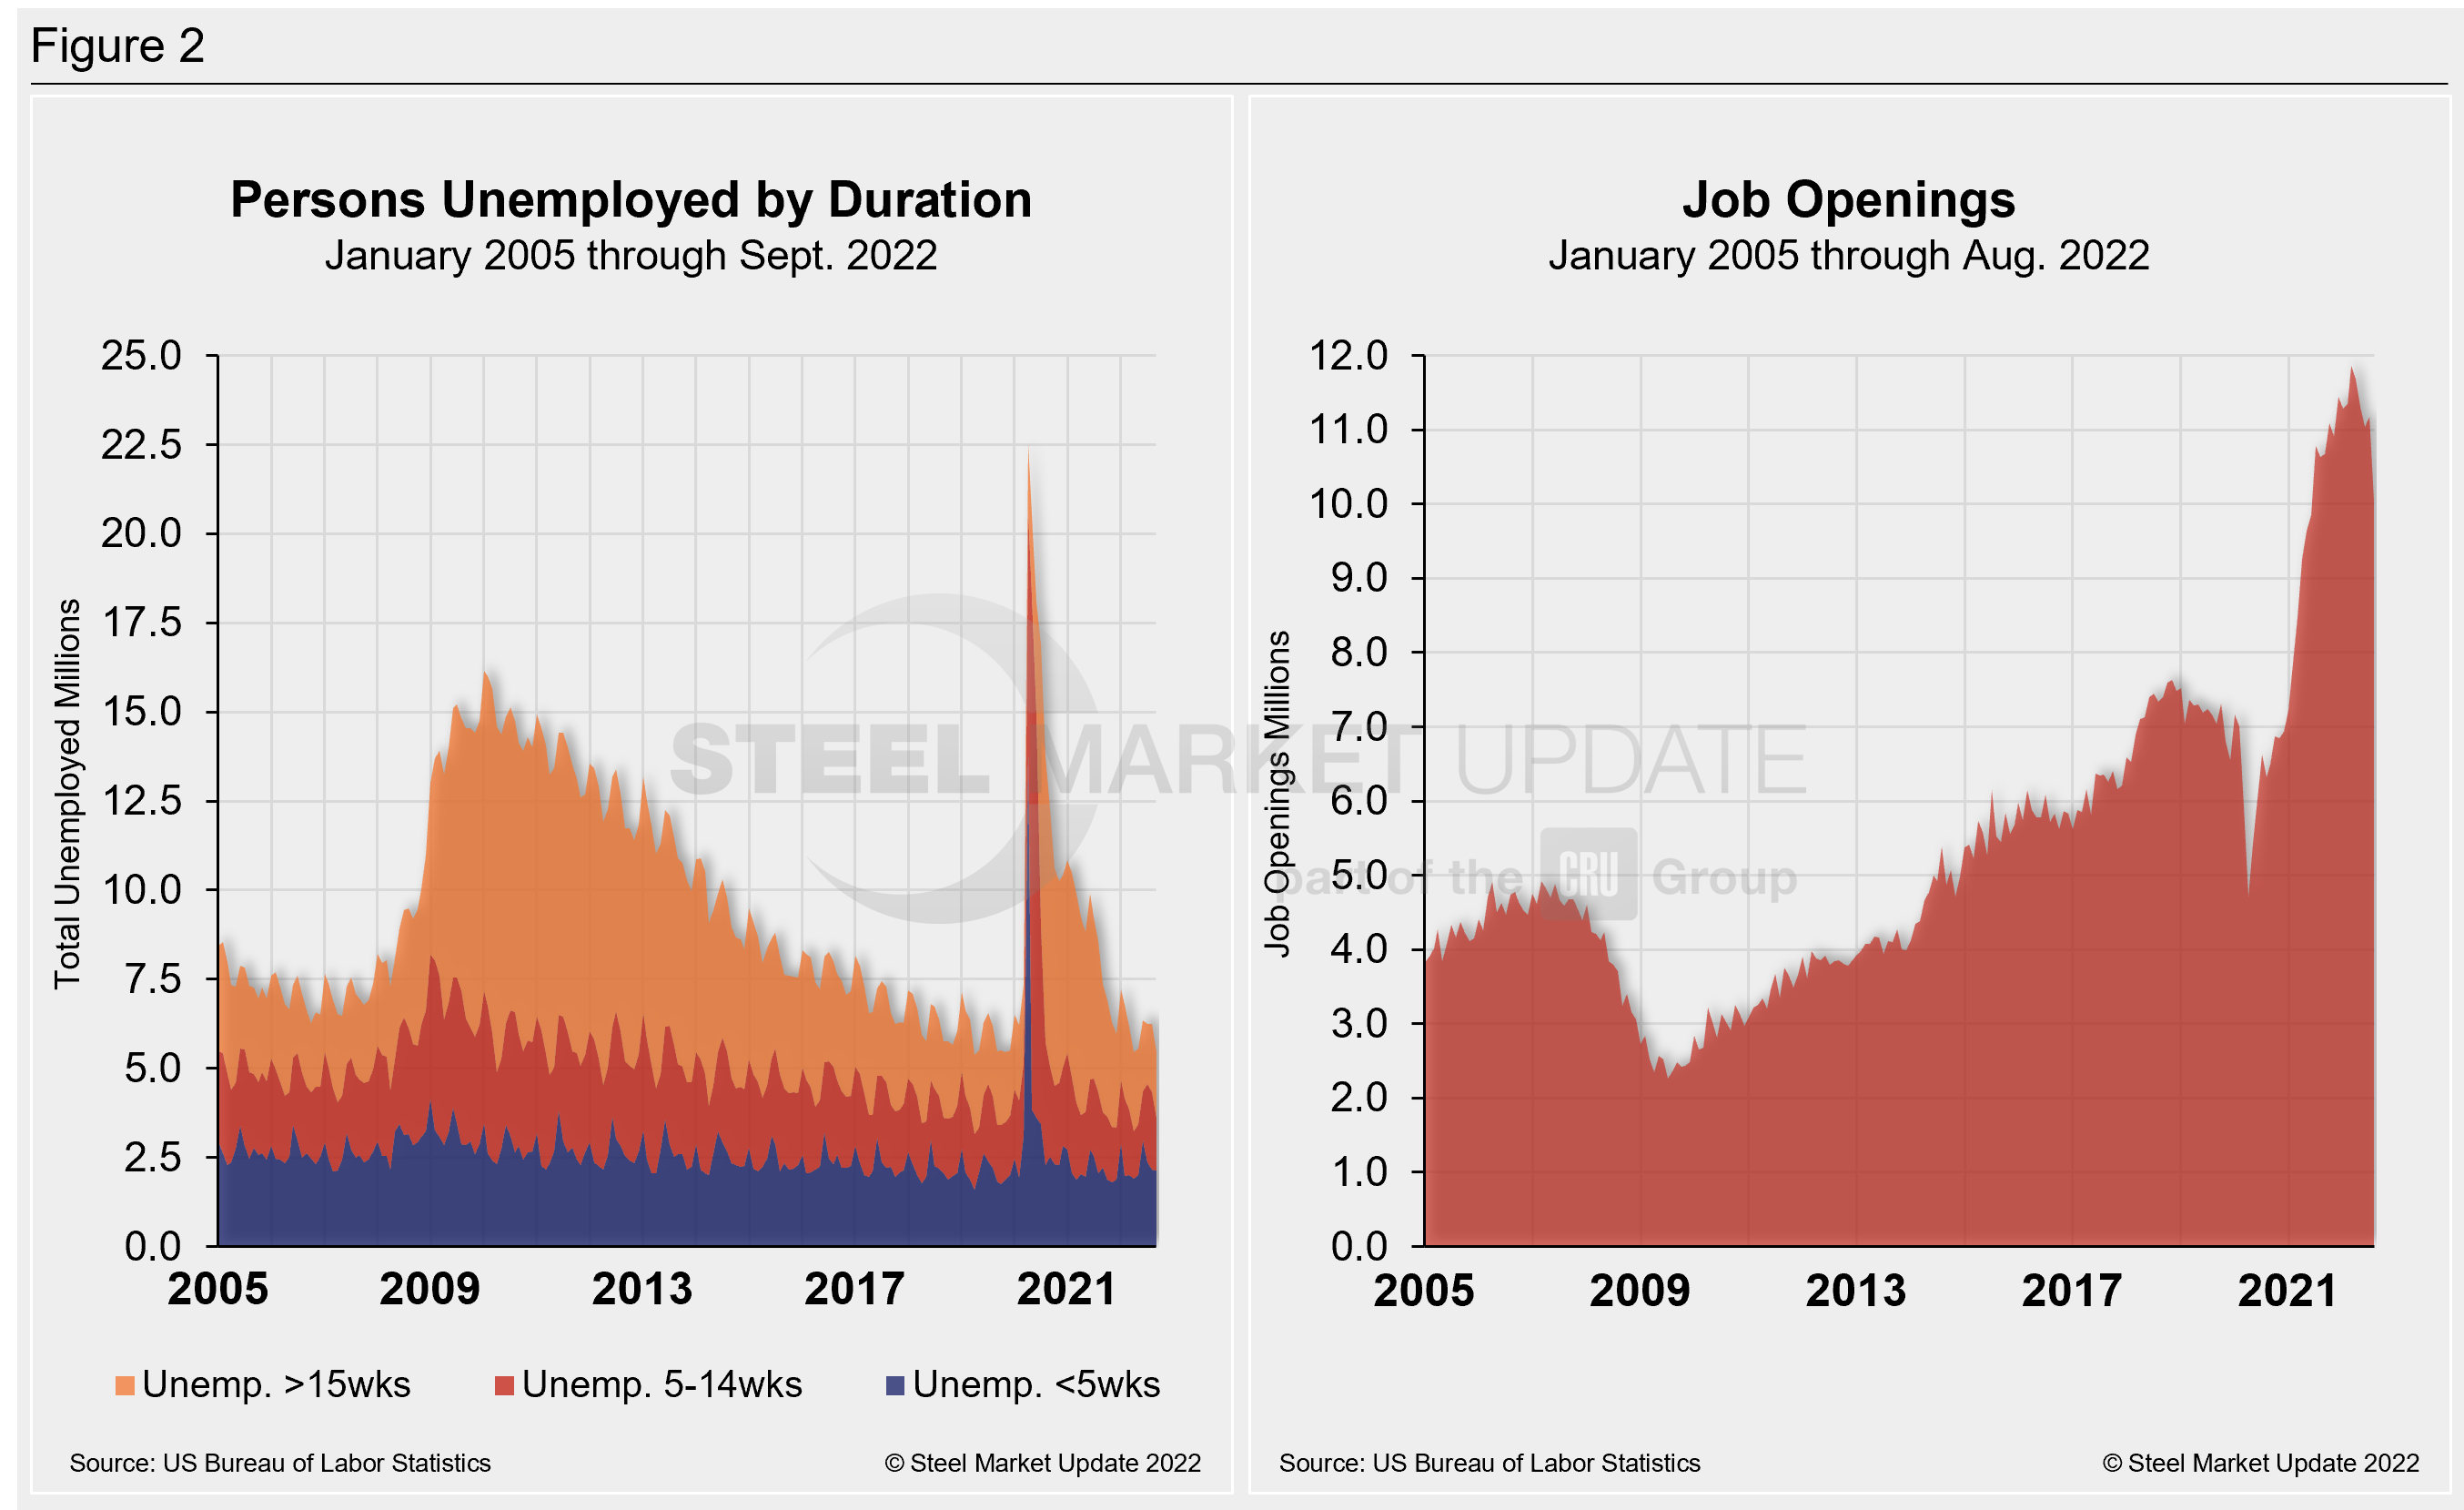
The number of long-term unemployed (out of work for at least 27 consecutive weeks) was little changed in September, totaling 1.1 million. That figure accounted for 18.5% of the total unemployed in the month.
The historic picture for the duration of unemployment since January 2005 is broken down into <5 weeks, 5 to 14 weeks, and >15 weeks in Figure 2. The total number of unemployed was 5.45 million at the end of September, a decrease of 796,000 compared to August. The decline put the result 758,000 below the pre-pandemic unemployment total in February 2020.
September’s results show that roughly 17.04 million more people now have jobs compared to the 22.5 million thrown out of work during the worst of the pandemic in April 2020. As of Oct. 7, 34% had been unemployed for more than 15 weeks, 27% for 5 to 14 weeks, and 39% for less than five weeks.
As part of September’s employment report, the Labor Department released its monthly report on job openings, layoffs, and quitting through the last day of June. Also known as the “JOLTS” report, the data indicates how much demand there is for workers in the US economy and the extent to which employers are still struggling with labor shortages nearly two years removed from the worst of the pandemic.
August’s job openings declined to it’s lowest total since June 2021. The report suggests that workers remain in high demand and are still quitting more often. There were about 10.05 million job openings in August — 1.1 million fewer job openings than in July and 1.8 million fewer than the record of 11.9 million set in March.
The charts below (Figure 2) detail the total persons unemployed by duration from 2005 through August 2022 and the total job openings over the same period.
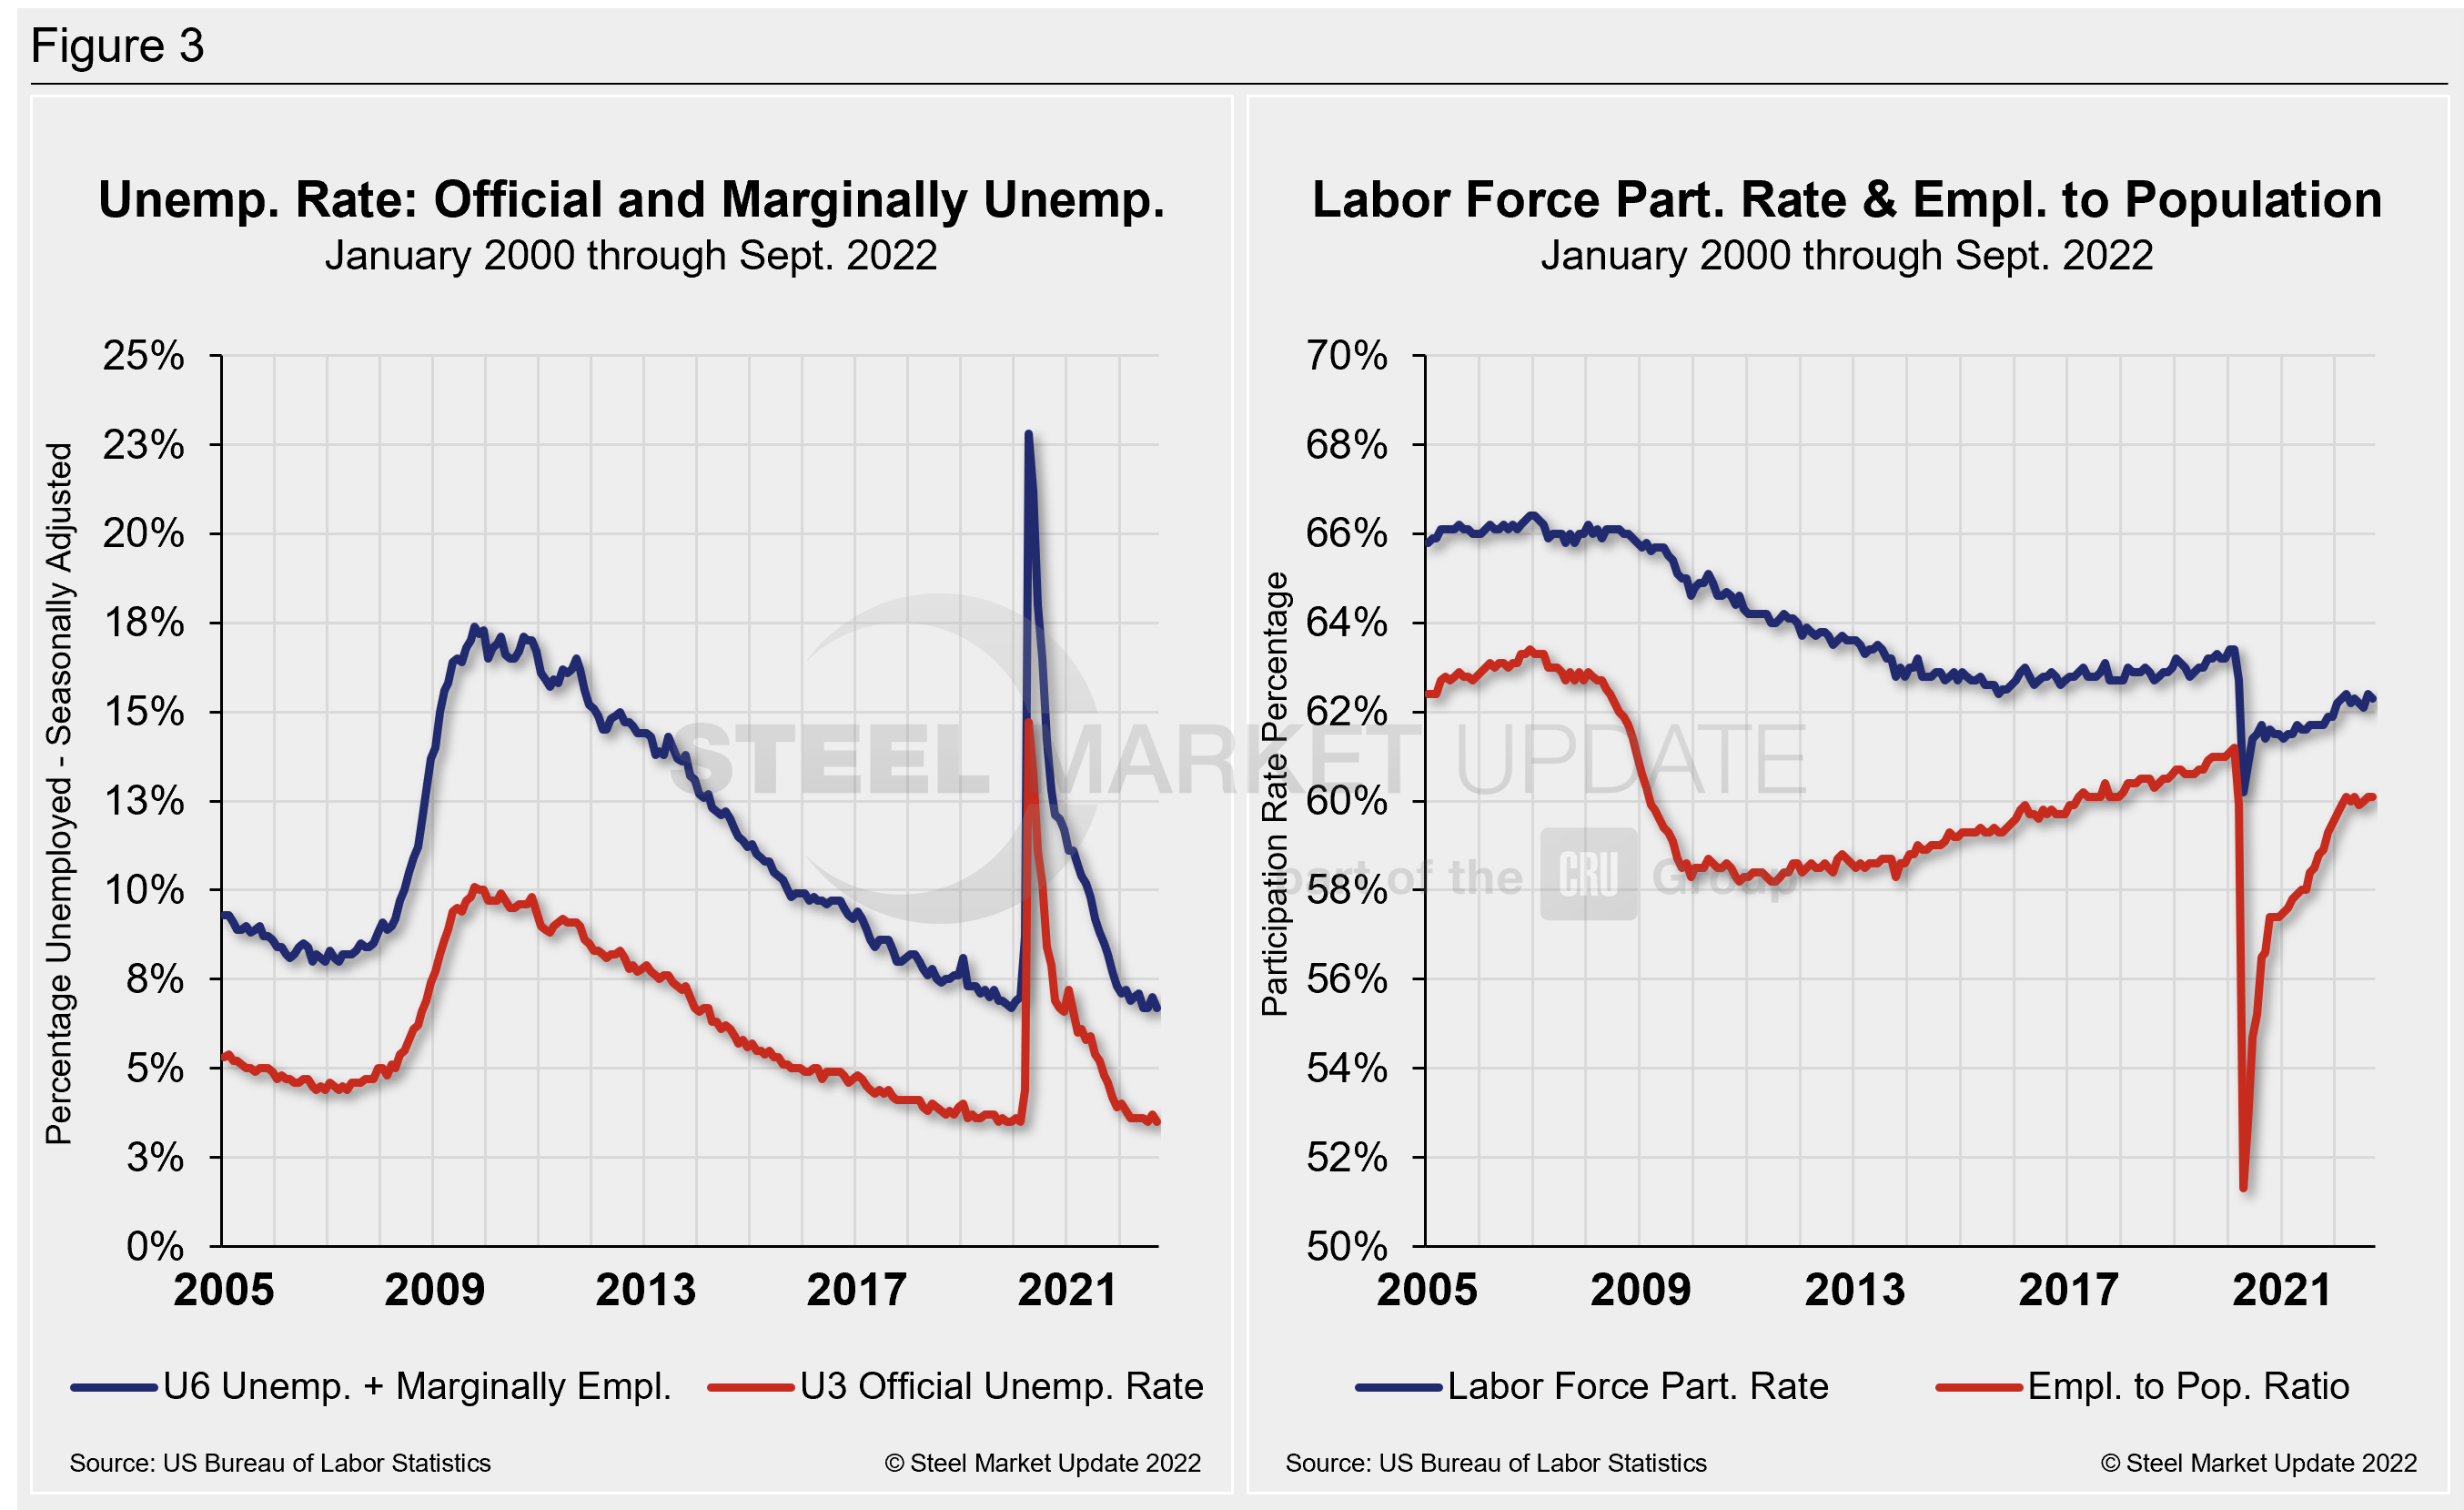
The official unemployment rate, U3, reported in the Bureau of Labor Statistics Household survey (see explanation below), increased from 3.5% in February 2020 to 14.7% in April 2020. A steady decrease followed until this past March when it remained unchanged at 3.6% for four months. September’s measure of 3.5% is now back to pre-pandemic form and is at its best reading in more than two decades.
A more encompassing view of unemployment (U6) that includes those holding part-time jobs for economic reasons as well as discouraged workers not looking for jobs was 6.7%, down from 7.0% in August.
Another gauge, and a more definitive view, are the number employed as a percentage of the population. Last month, the employment-to-population ratio was 60.1%, unchanged versus August, but matching its highest reading all year.
Figure 3 details side-by-side parallels of the unemployment rate (both the U3 and U6 rates) since 2005 as well as the labor force participation rate and employment-to-population ratio over the same period.
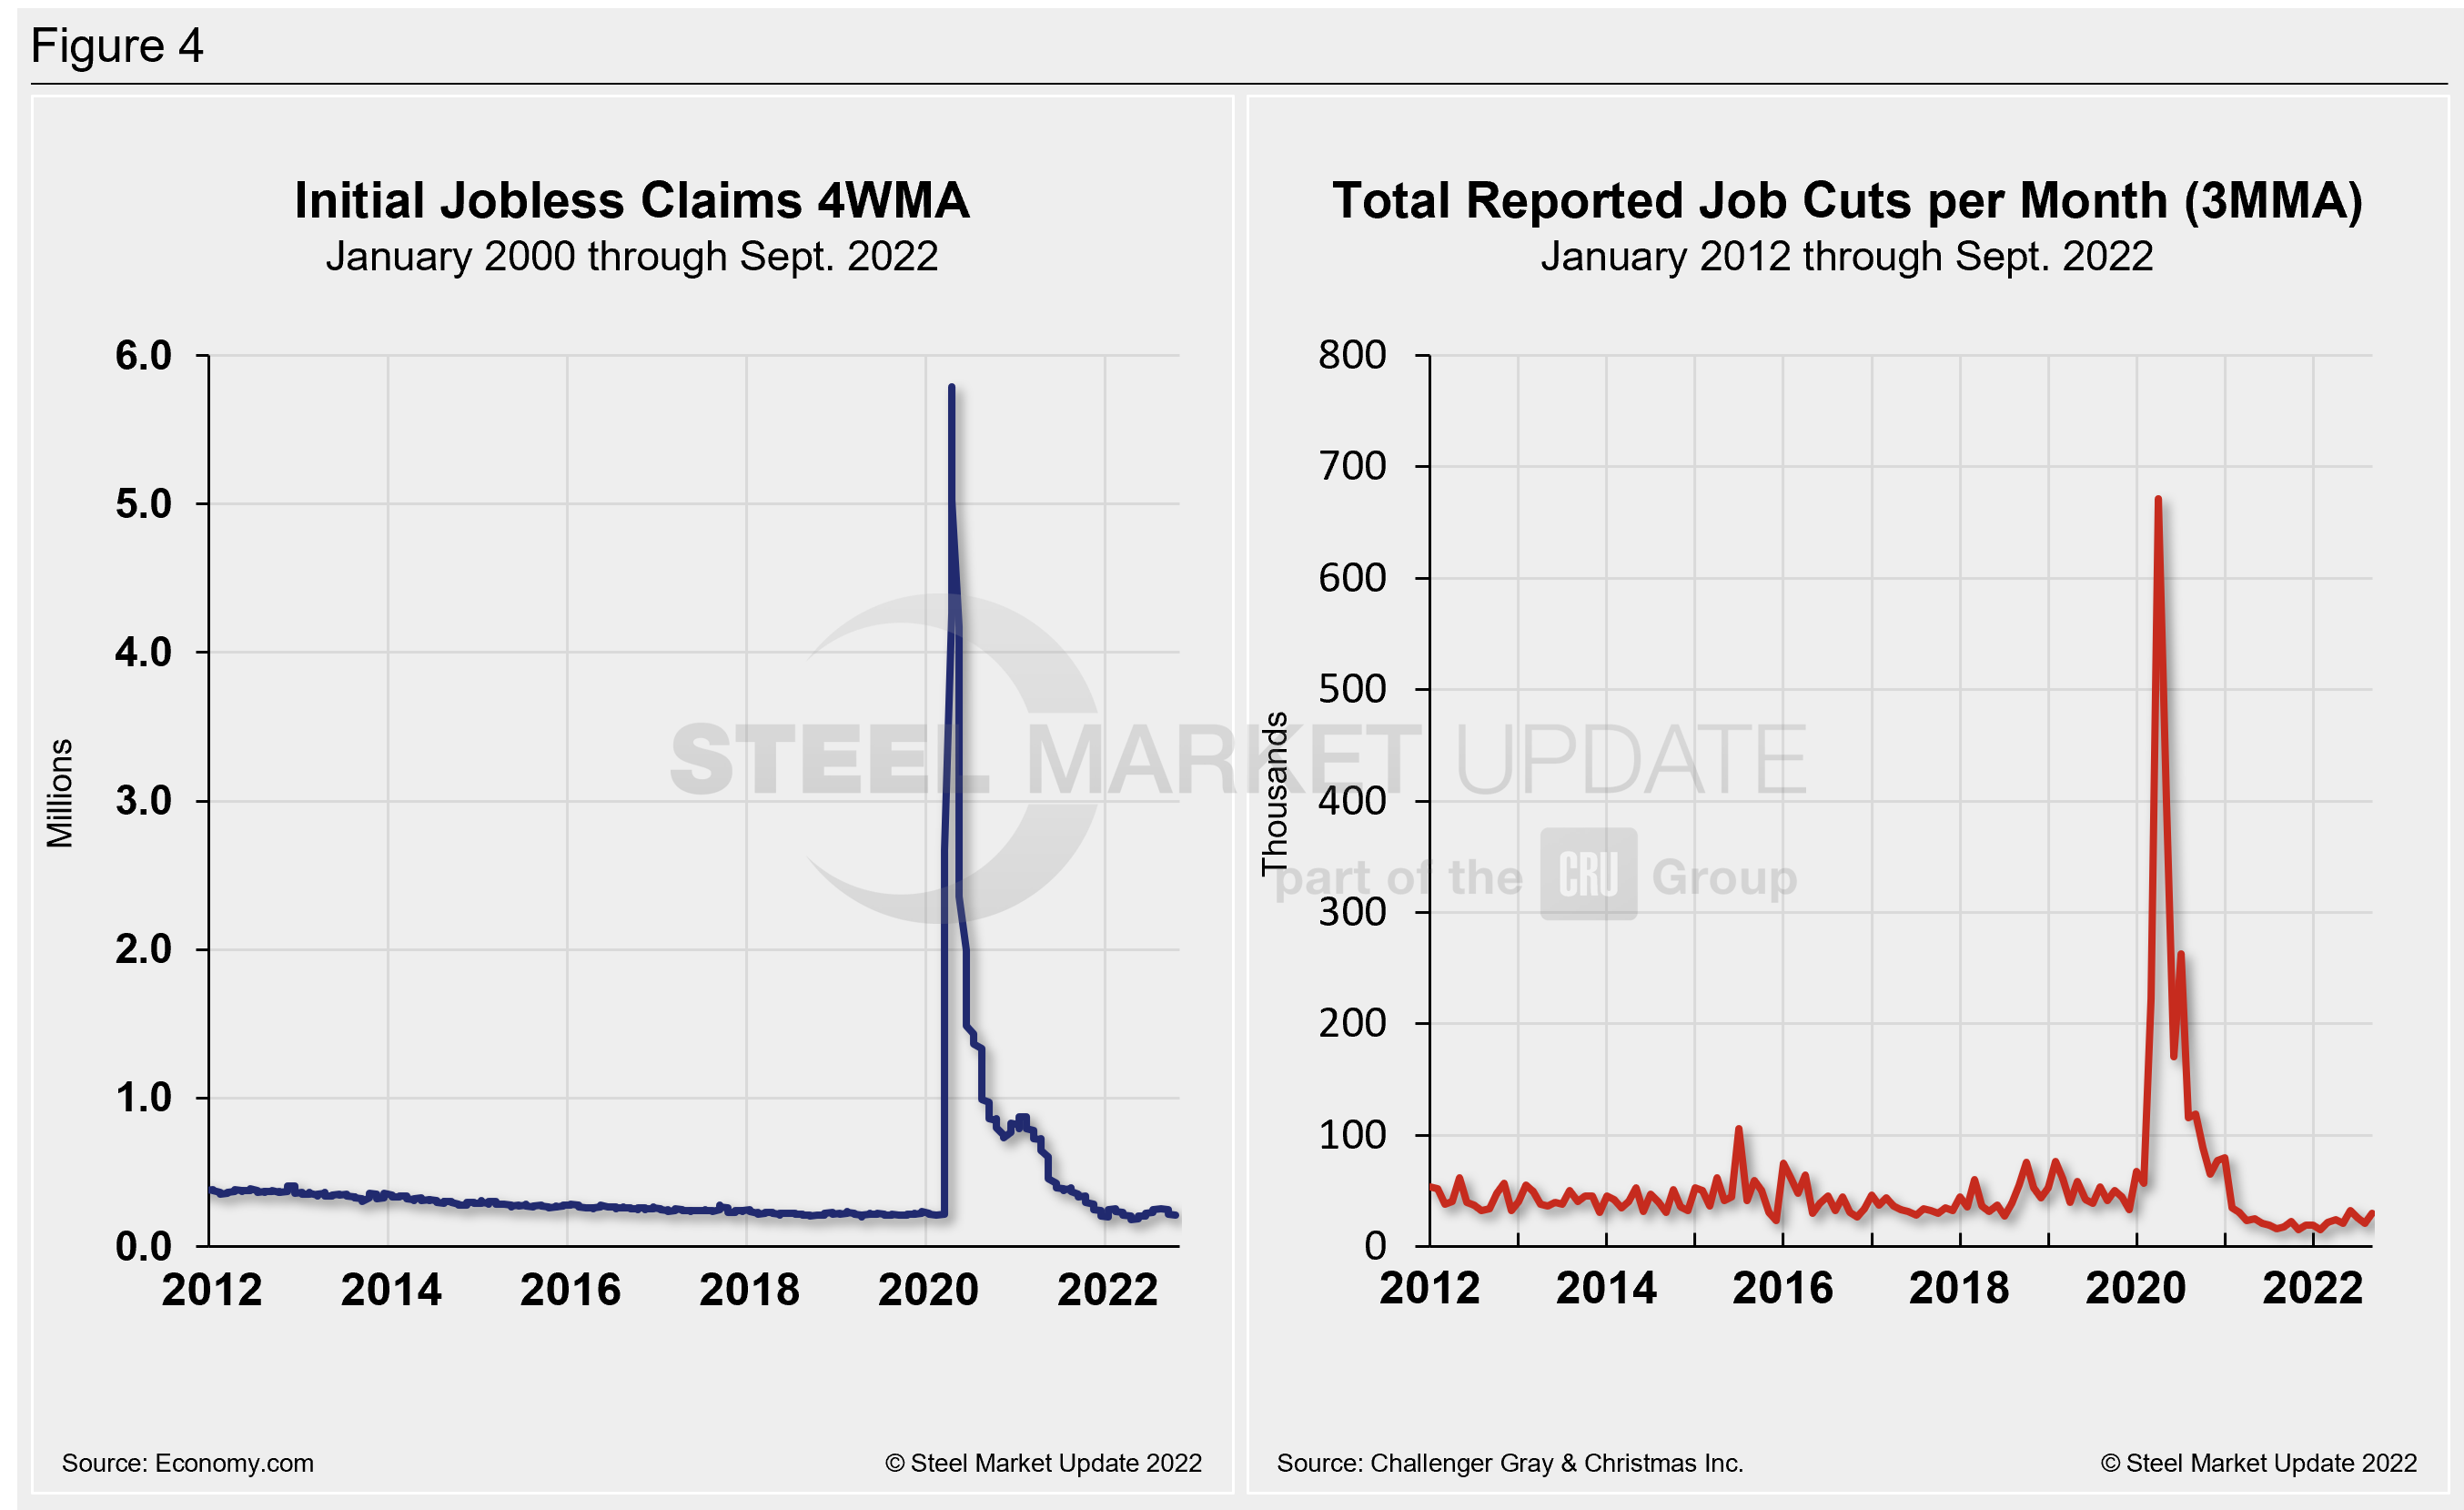
Initial claims for unemployment insurance, which are reported weekly by the Department of Labor, rose by 26,000 to 219,000 in the week ended Oct. 8, but were down by 13,000 new claims since our last report a month ago. The increase was more than anticipated but Hurricane Fiona and potentially Hurricane Ian are partly to blame. Despite the gain, the total remained below the 250,000 threshold but noted some potential stress on the labor market, the Department of Labor said.
“Advance state claims data showed the largest increase in Puerto Rico, which was hit by Hurricane Fiona. Missouri and Massachusetts also were among the states with the largest increases in initial claims in the week ended Oct. 1. The four-week moving average in new filings was little changed. Continuing claims, a proxy for hiring, rose by 15,000 to 1.361 million in the week ended Sept. 24,” Economy.com reported.
Human resources consulting firm Challenger, Gray and Christmas Inc. produces a monthly employment update for the US. It reported that job cuts in September totaled 29,989 — an increase of 46.4% from the 20,485 announced the prior month. September’s total is 67.6% higher than the same year-ago period when 17,898 cuts were announced.
September marks the fifth time this year that cuts were higher in 2022 than in the corresponding month a year earlier, the report said.
Year-to-date, employers announced 209,495 cuts, down 21% from the 265,221 cuts announced through the same period in 2021. It is the lowest January to September total since Challenger began tracking job cuts in 1993.
According to the report, in the third quarter, employers announced 76,284 job cuts, down 1.6% from the 77,515 cuts announced in the previous quarter. It is up 45.1% from Q3 of 2021 when employers planned to cut 52,560 workers from payrolls.
“Some cracks are beginning to appear in the labor market. Hiring is slowing and downsizing events are beginning to occur,” said Challenger. “The cooling housing market and Fed’s rate hikes are leading to job cuts among mortgage staff at banks and lenders. The recession concerns are leading to increased uncertainty, and companies across sectors are beginning to reassess staffing needs,”
Cuts were widespread in September. Retailers led in job cut announcements last month, with 9,273, followed by technology companies with 4,212 cuts in September. The automotive sector leads all industries in job cuts this year with 28,922, up 194% from the 9,831 cuts announced through September last year.
Meanwhile, cuts in the financial technology sector have increased 927% over last year, from 563 through September 2021 to 5,780 cuts through the same time this year.
Figure 4 shows the four-week moving average of new claims since January 2012, seasonally adjusted. It also shows the total reported job cuts per month, according to Challenger, on a three-month moving average.
Explanation: On the first Friday of each month, the Bureau of Labor Statistics releases the employment data for the previous month. Data is available at www.bls.gov. The BLS reports on the results of two surveys. The Establishment survey reports the actual number employed by industry. The Household survey reports on the unemployment rate, participation rate, earnings, average workweek, the breakout into full-time and part-time workers and lots more details describing the age breakdown of the unemployed, reasons for and duration of unemployment.
By David Schollaert, David@SteelMarketUpdate.com


