

Analysis

October 19, 2022
North American Auto Assemblies Slipped in September
Written by David Schollaert
North American auto assemblies declined by 8.7% in September after reaching their highest mark in nearly two years the month prior. Despite the lower output in September, production was a hefty 39.6% higher year-on-year (YoY) and still the third-best total year-to-date (YTD), according to LMC Automotive data.
Though the market remains supply-constrained due to ongoing parts and supply shortages, production in September continued to show signs that the situation is improving.
Disruptions across the North American automotive market over the past two years cannot be understated. Driven by a global semiconductor crisis, automakers have dealt with production halts, delays, and inventory shortages. Though slow, the recovery has been remarkable over the past three-to-four months. However, when compared to the last ‘normal’ year in 2019, production is down 3.4%.
September was the 16th consecutive month that retail inventories closed below 1 million units. September retail inventories improved from August, however, and remained above the 900,000-units mark, a threshold that carried on for nearly 10 straight months.
Despite the improvements, September is yet another month where supply constraints kept vehicle sales artificially low but delivered record transaction prices and dealer profitability.
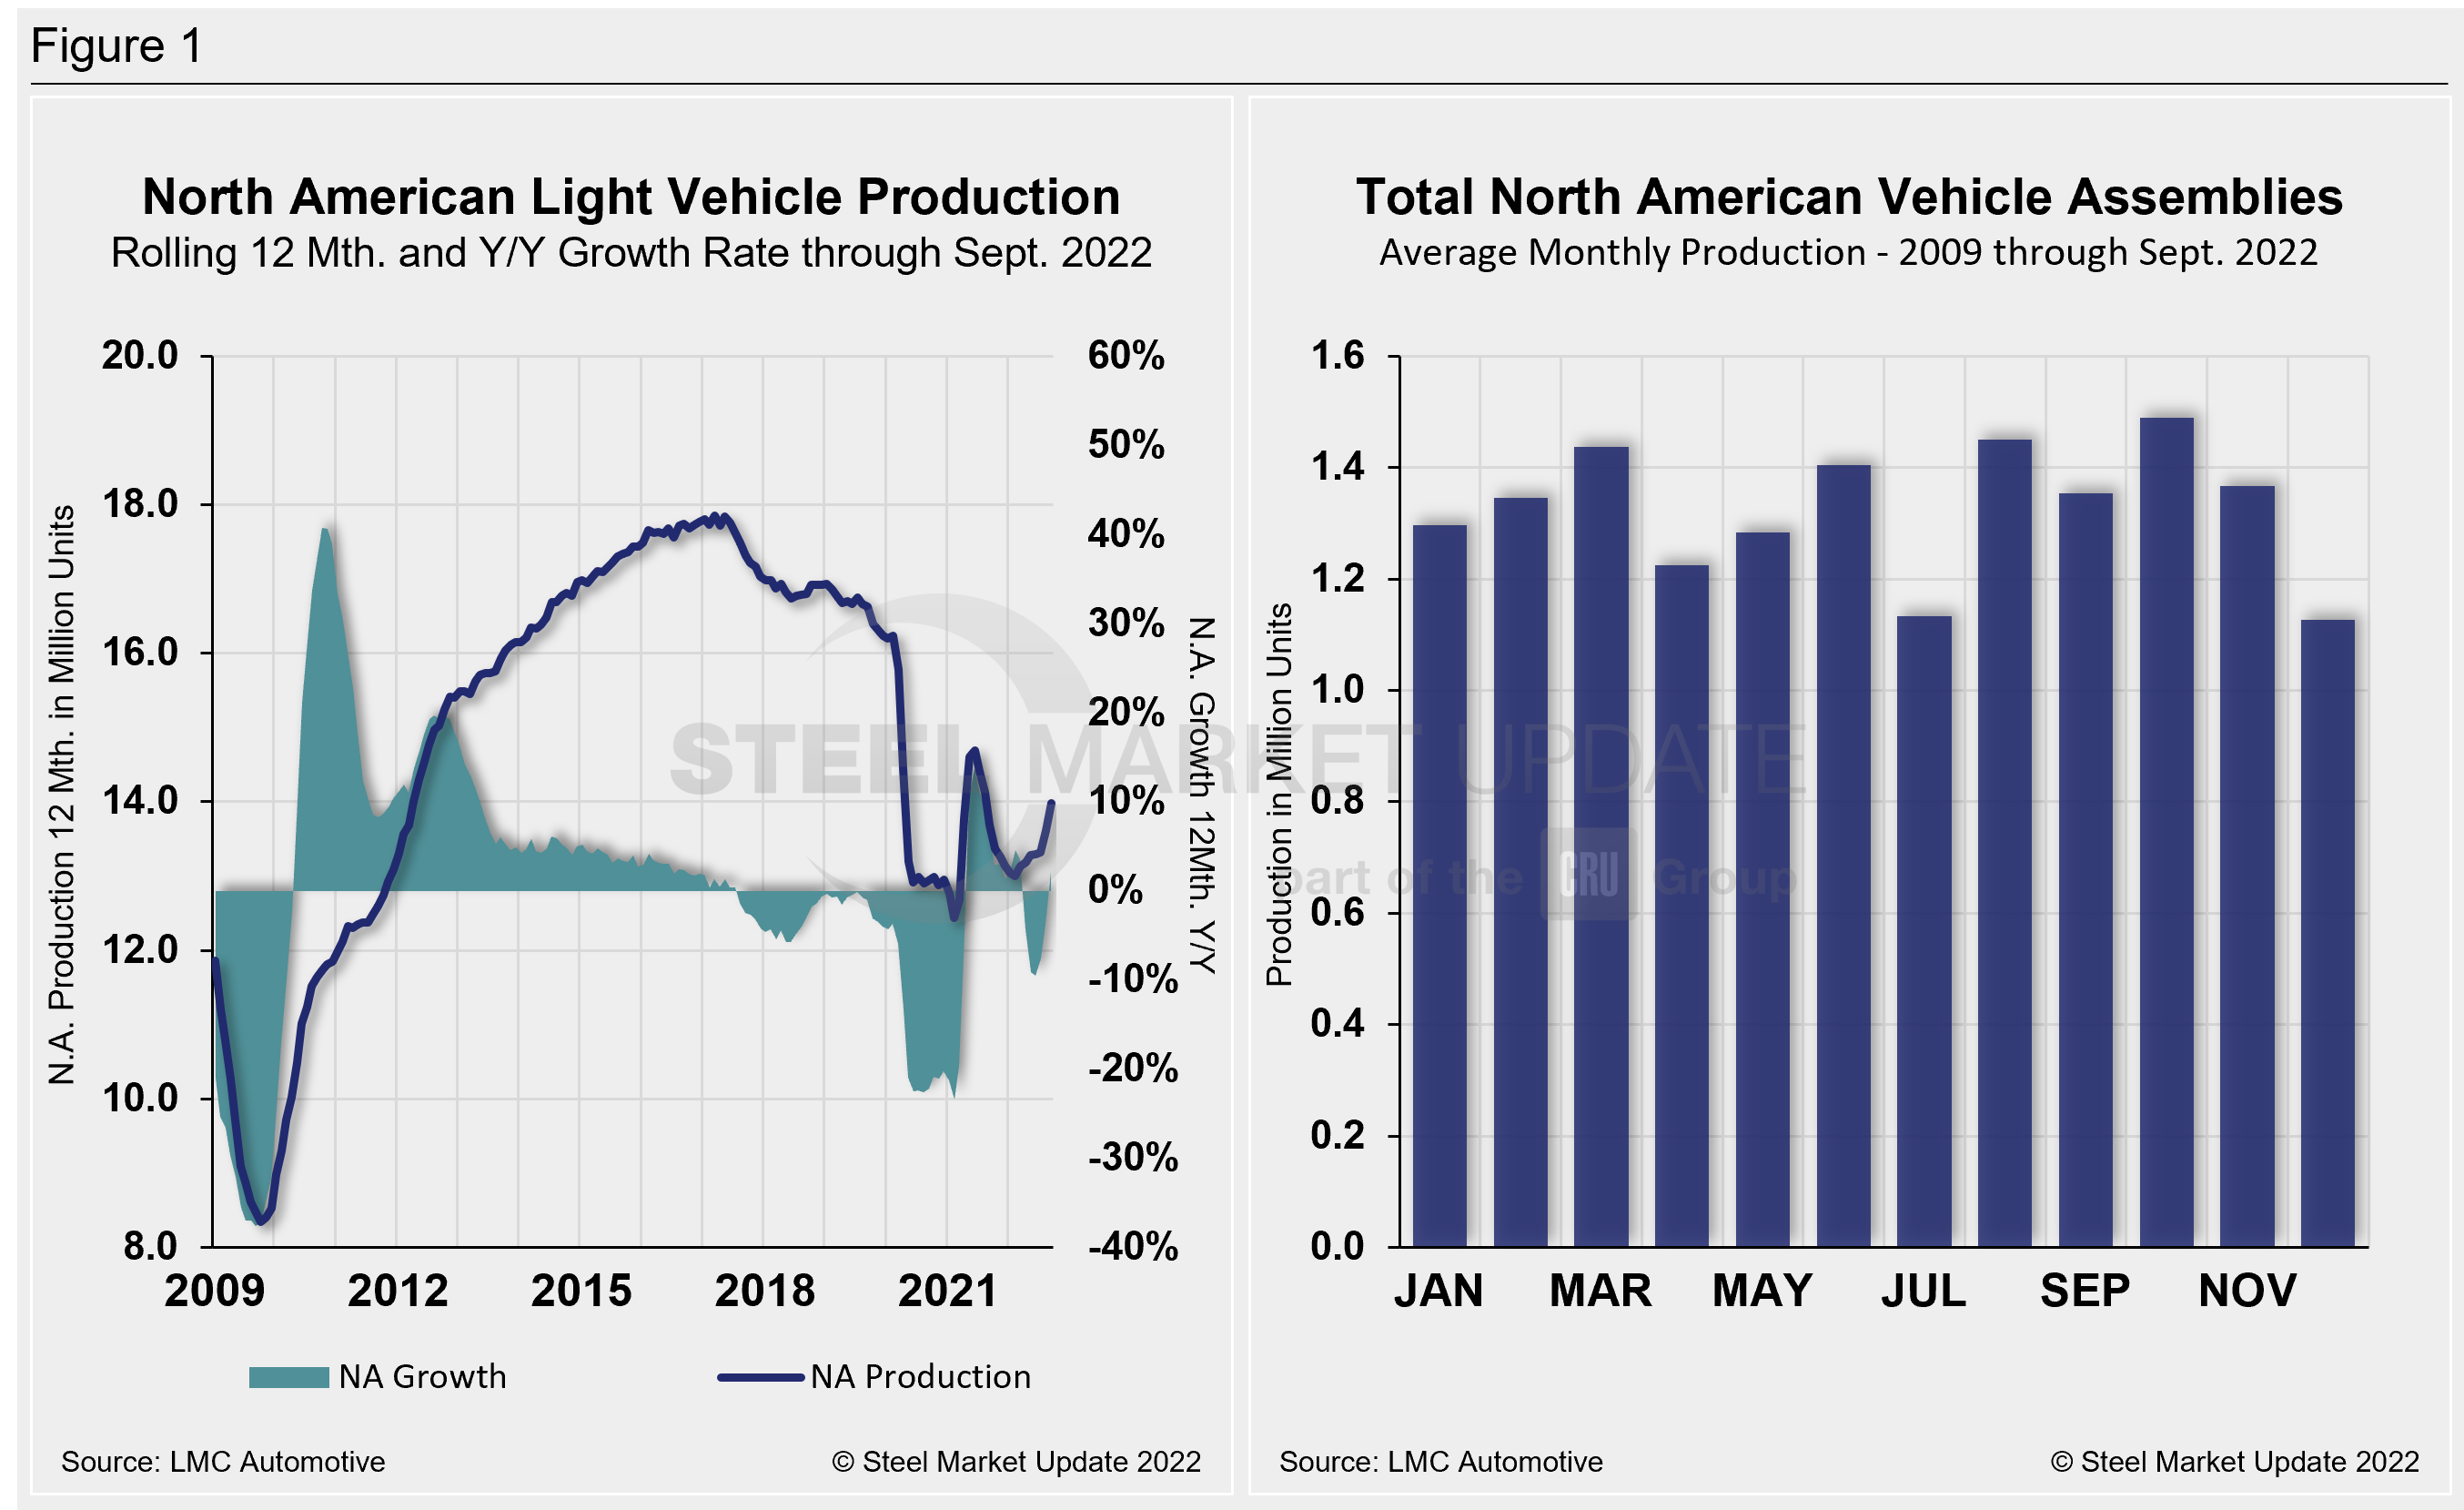
North American vehicle production, including personal and commercial vehicles, totaled 1.278 million units in September, down from 1.399 million units in August, but better than the 915,452 units produce one year ago.
Below in Figure 1 is North American light vehicle production since 2009 on a rolling 12-month basis with the YoY growth rate. Also included is the average monthly production, which includes seasonality, over the same period.
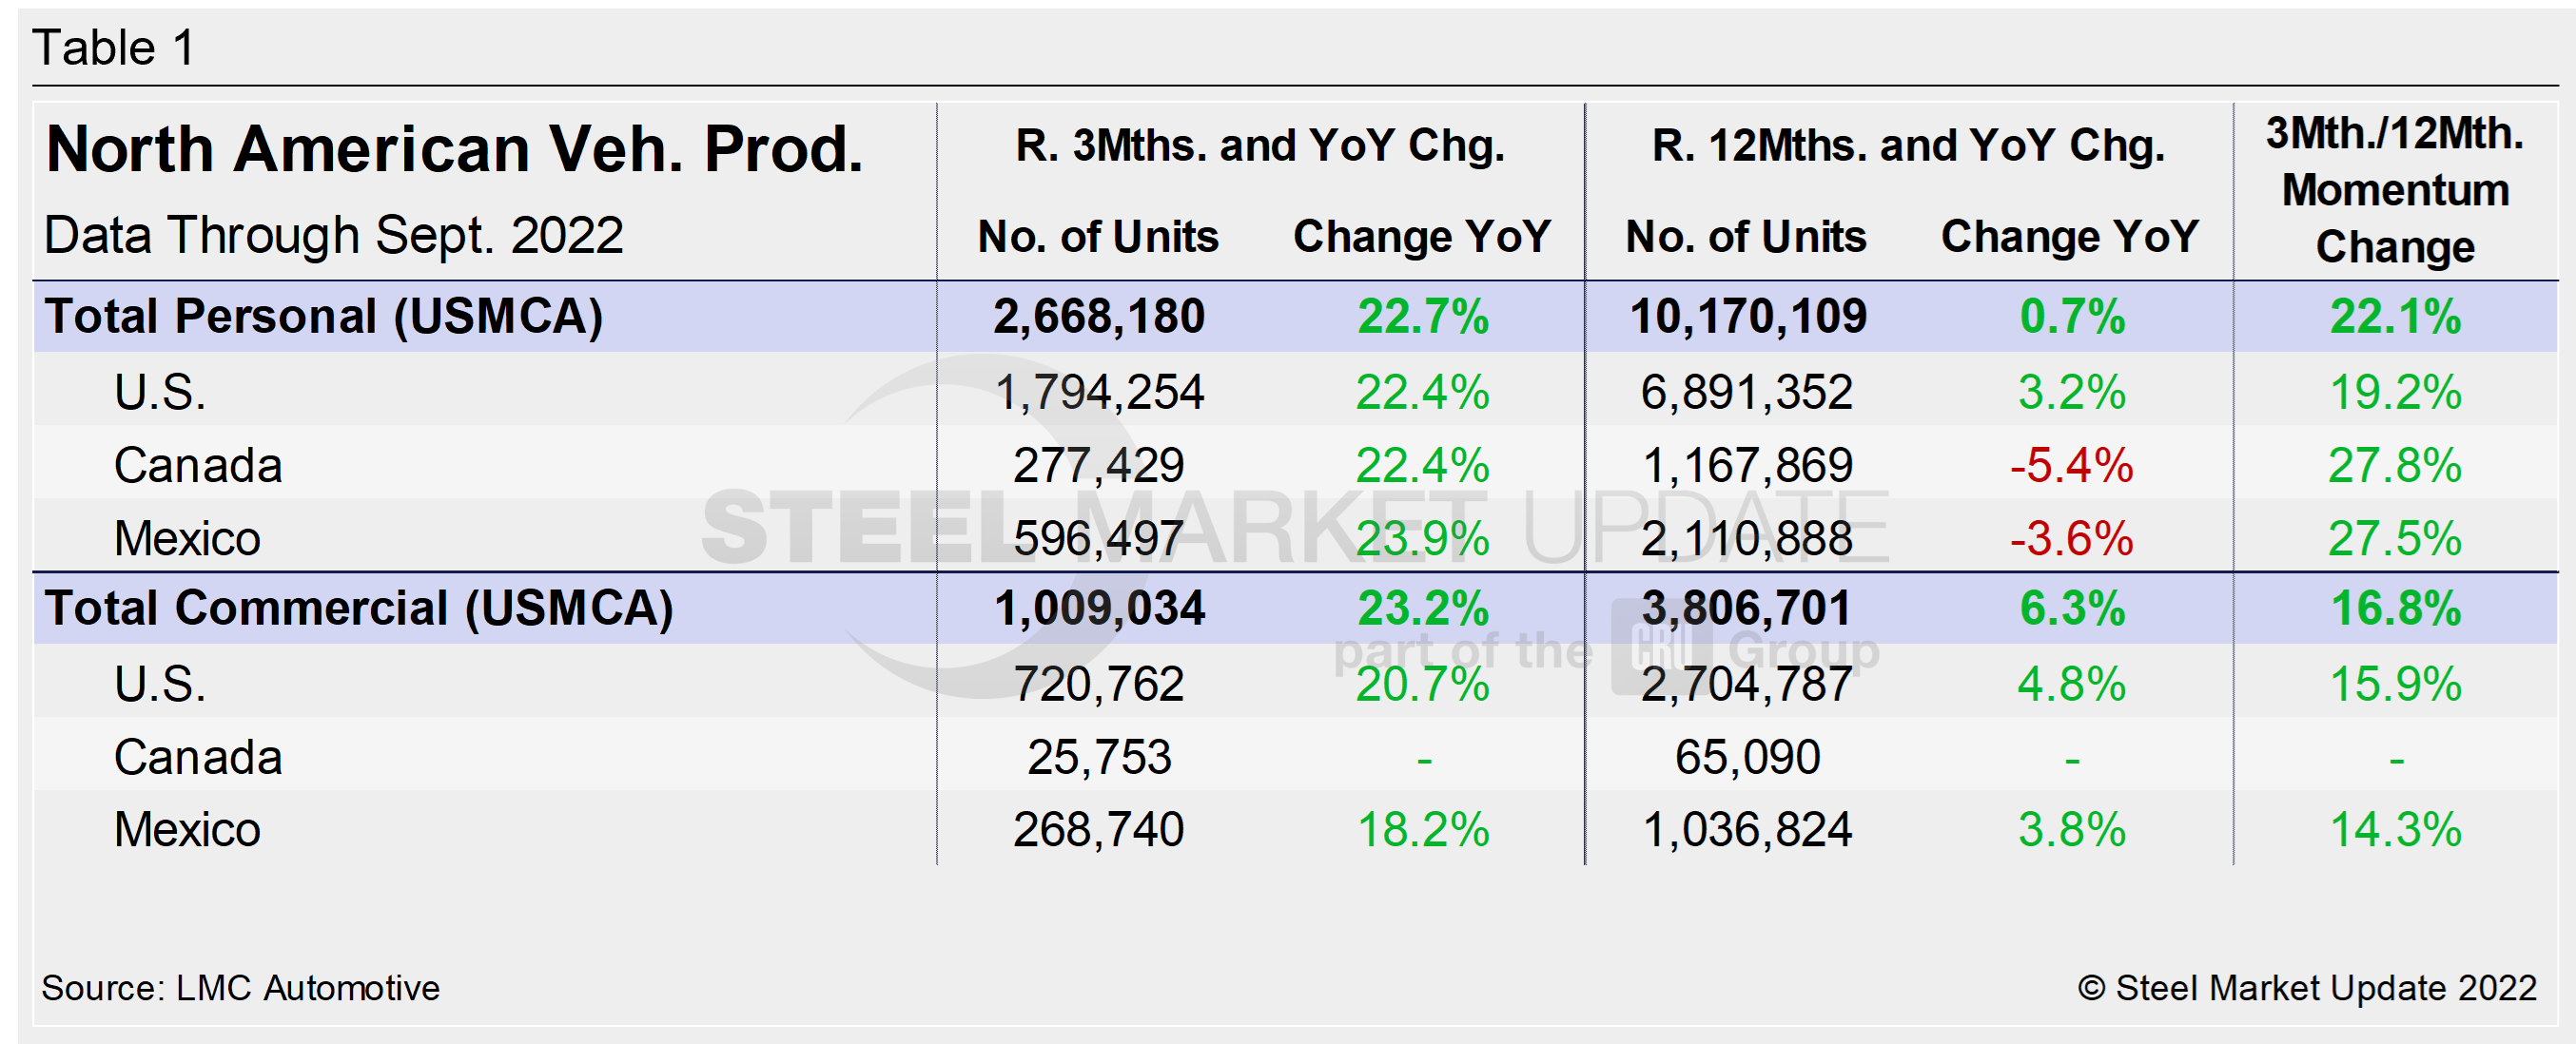
A short-term snapshot of assembly by nation and vehicle type is shown in the table below. It breaks down total North American personal and commercial vehicle production into US, Canadian and Mexican components, along with the three- and 12-month growth rate for each. On the far right, it shows the momentum for the total and each of the three nations.
The initial recovery from Covid’s early spread was significant, but the effect of the chip and parts shortage has been extended due to its prolonged nature. Through last September, growth rates for personal and commercial light vehicles were -26% and -22%, respectively, owing to the ongoing chip shortage and supply-chain disruptions. They have since recovered nicely, now both posting strong double-digit gains.
For the three months through September, the growth rate for total personal and commercial vehicle assemblies in the USMCA region is up noticeably. On the 12 months through September, the story is a bit different: Though in positive territory, the gains have been more controlled, particularly for personal vehicle assemblies.
Personal Vehicle Production
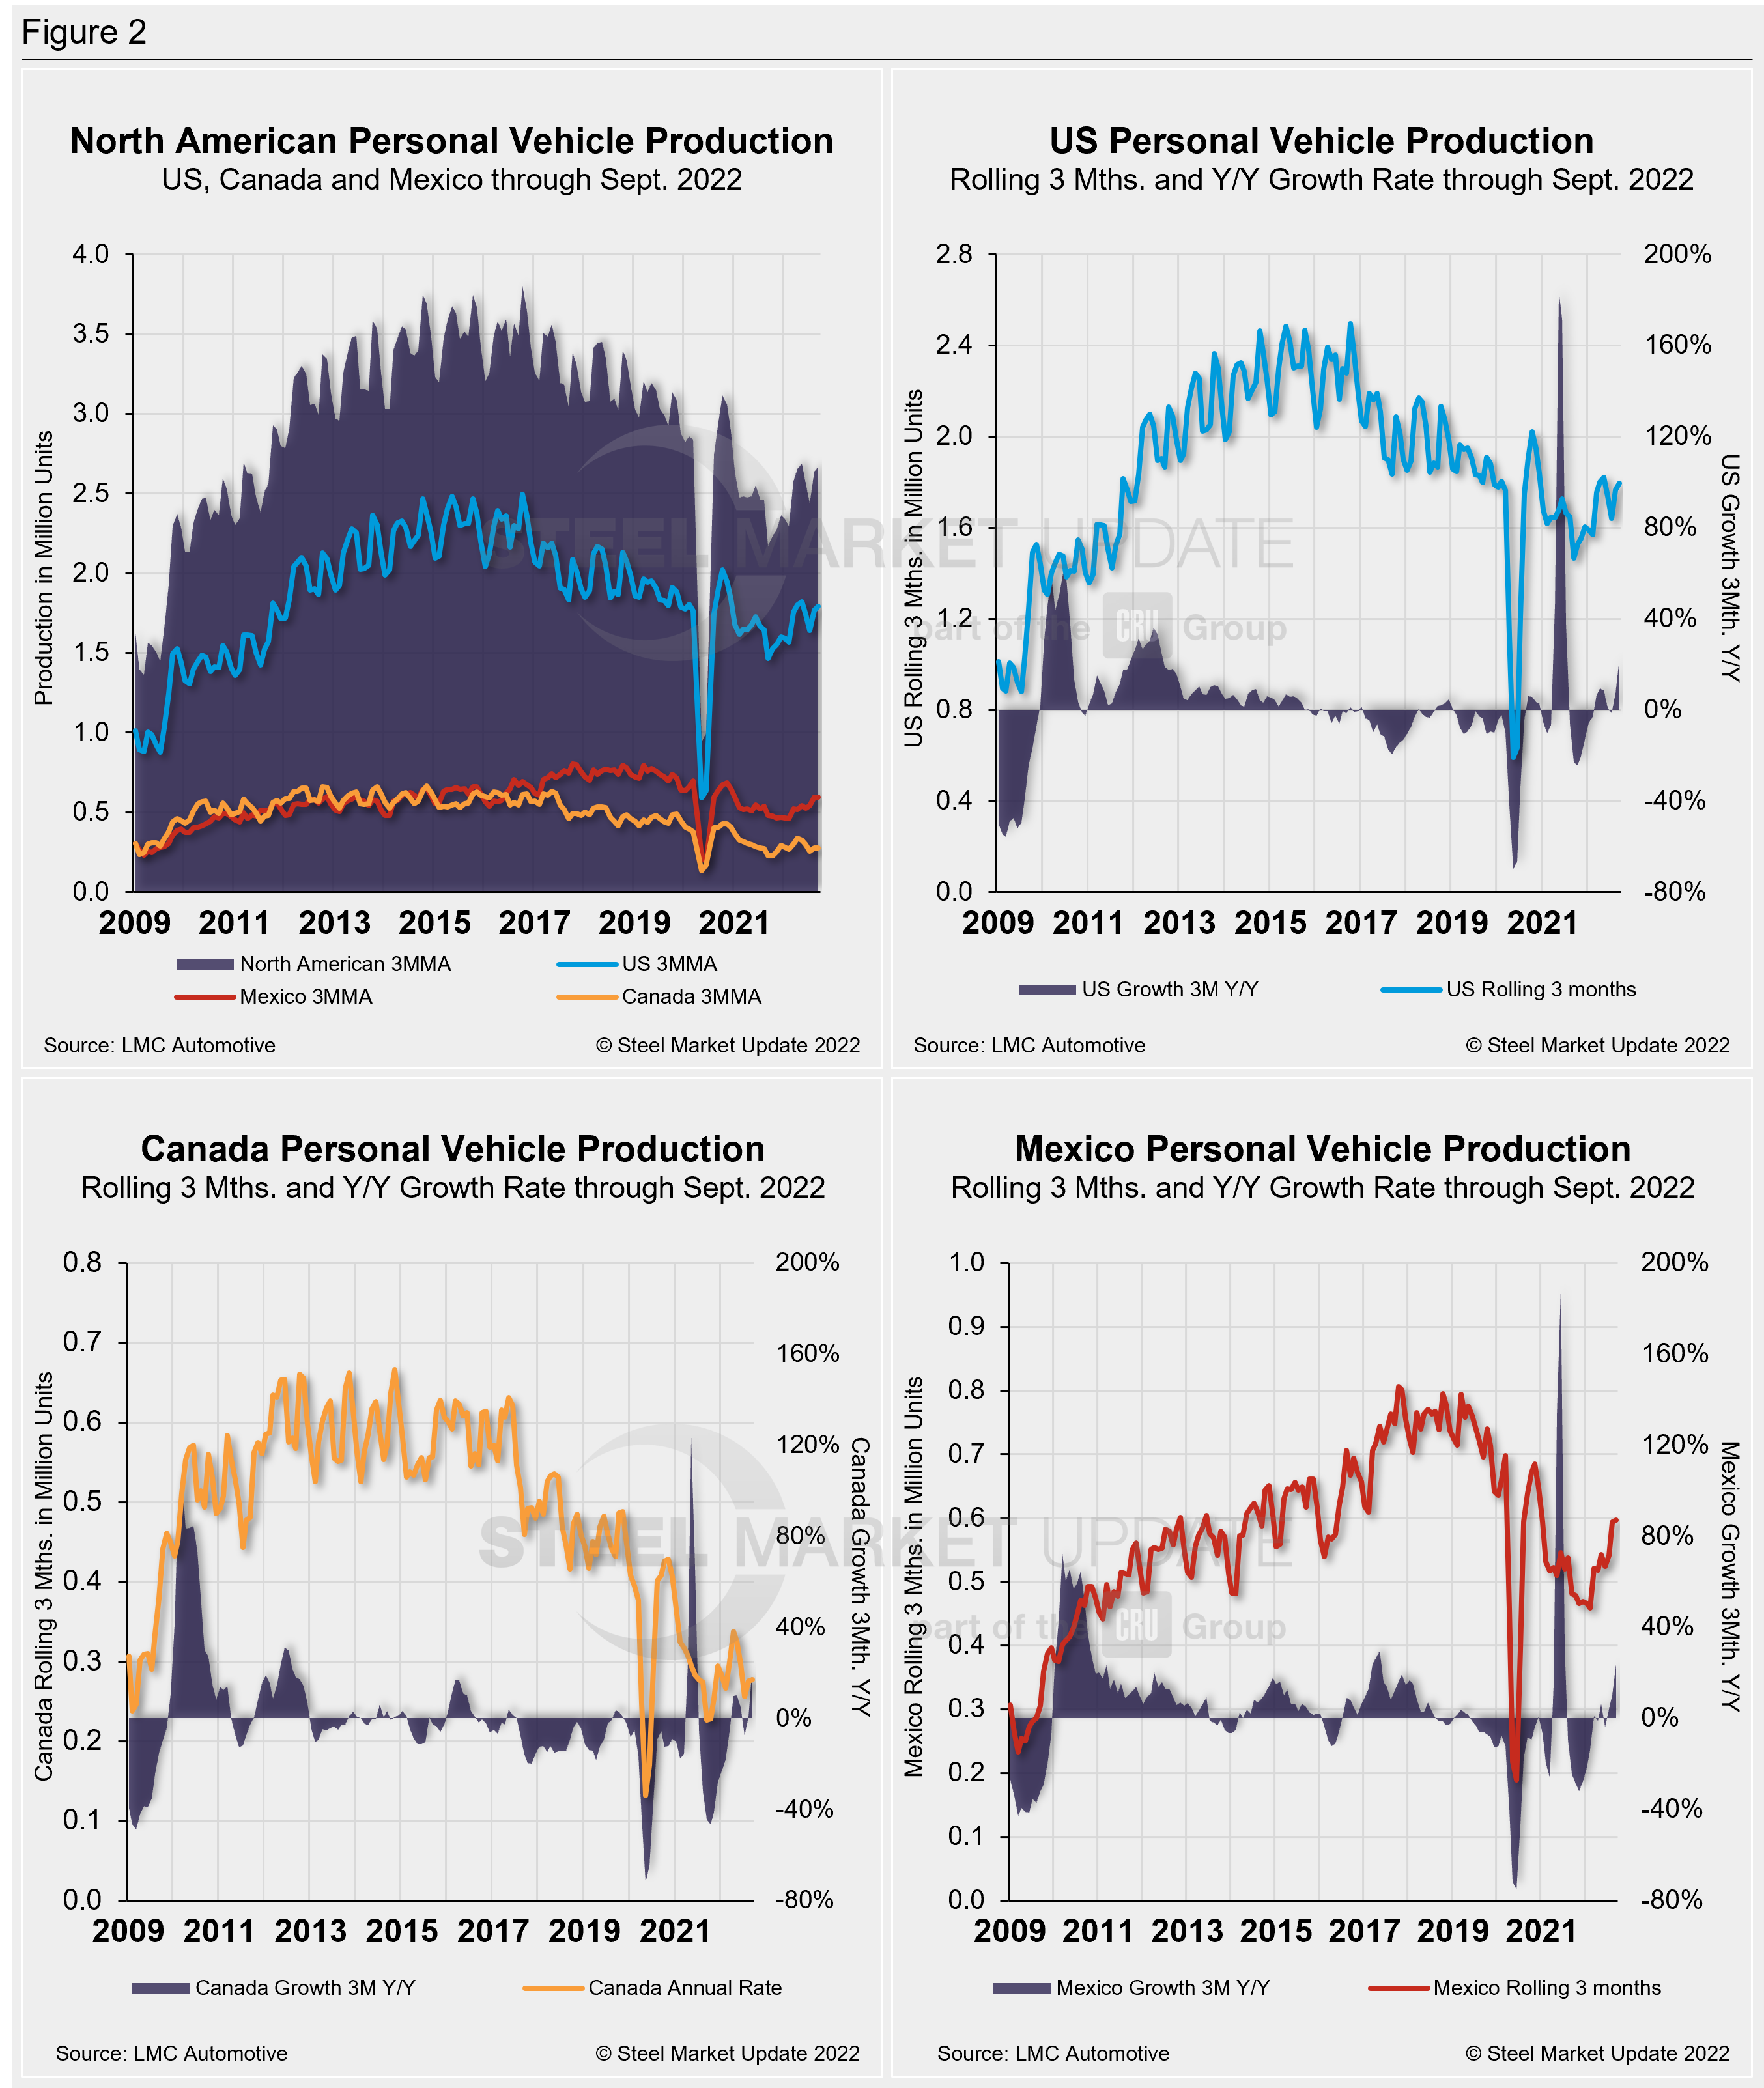
The longer-term picture of personal vehicle production across North America is shown below. The charts in Figure 2 show the total personal vehicle production for North America and the total for the US, Canada, and Mexico. The production of personal vehicles in the US, Canada, and Mexico and their YoY growth rate are also displayed.
In terms of personal vehicle production, all three countries saw MoM declines in September.
The US saw the largest decline in units produced in September versus August, down 56,567 units (-8.2%). Mexico saw the greatest percentage change MoM, down 14.2%, or 32,027 units. Canada assembled just 393 fewer vehicles in September when compared to August, a 0.4% decrease MoM.
The annual growth rate across the region in September was up. The US and Canada saw the sharpest gains, both growing at a 22.4% rate in September, followed by Mexico, expanding at 23.9%.
Production share across the region was largely unchanged. Both Canada and Mexico saw their personal vehicle production share of the North American market edge down by just 0.1 of a percentage point to 10.4% and 22.4%, respectively. The US saw its share of the North American market edge up fractionally to 67.2% in September, just 0.2 percentage points higher MoM.
Commercial Vehicle Production
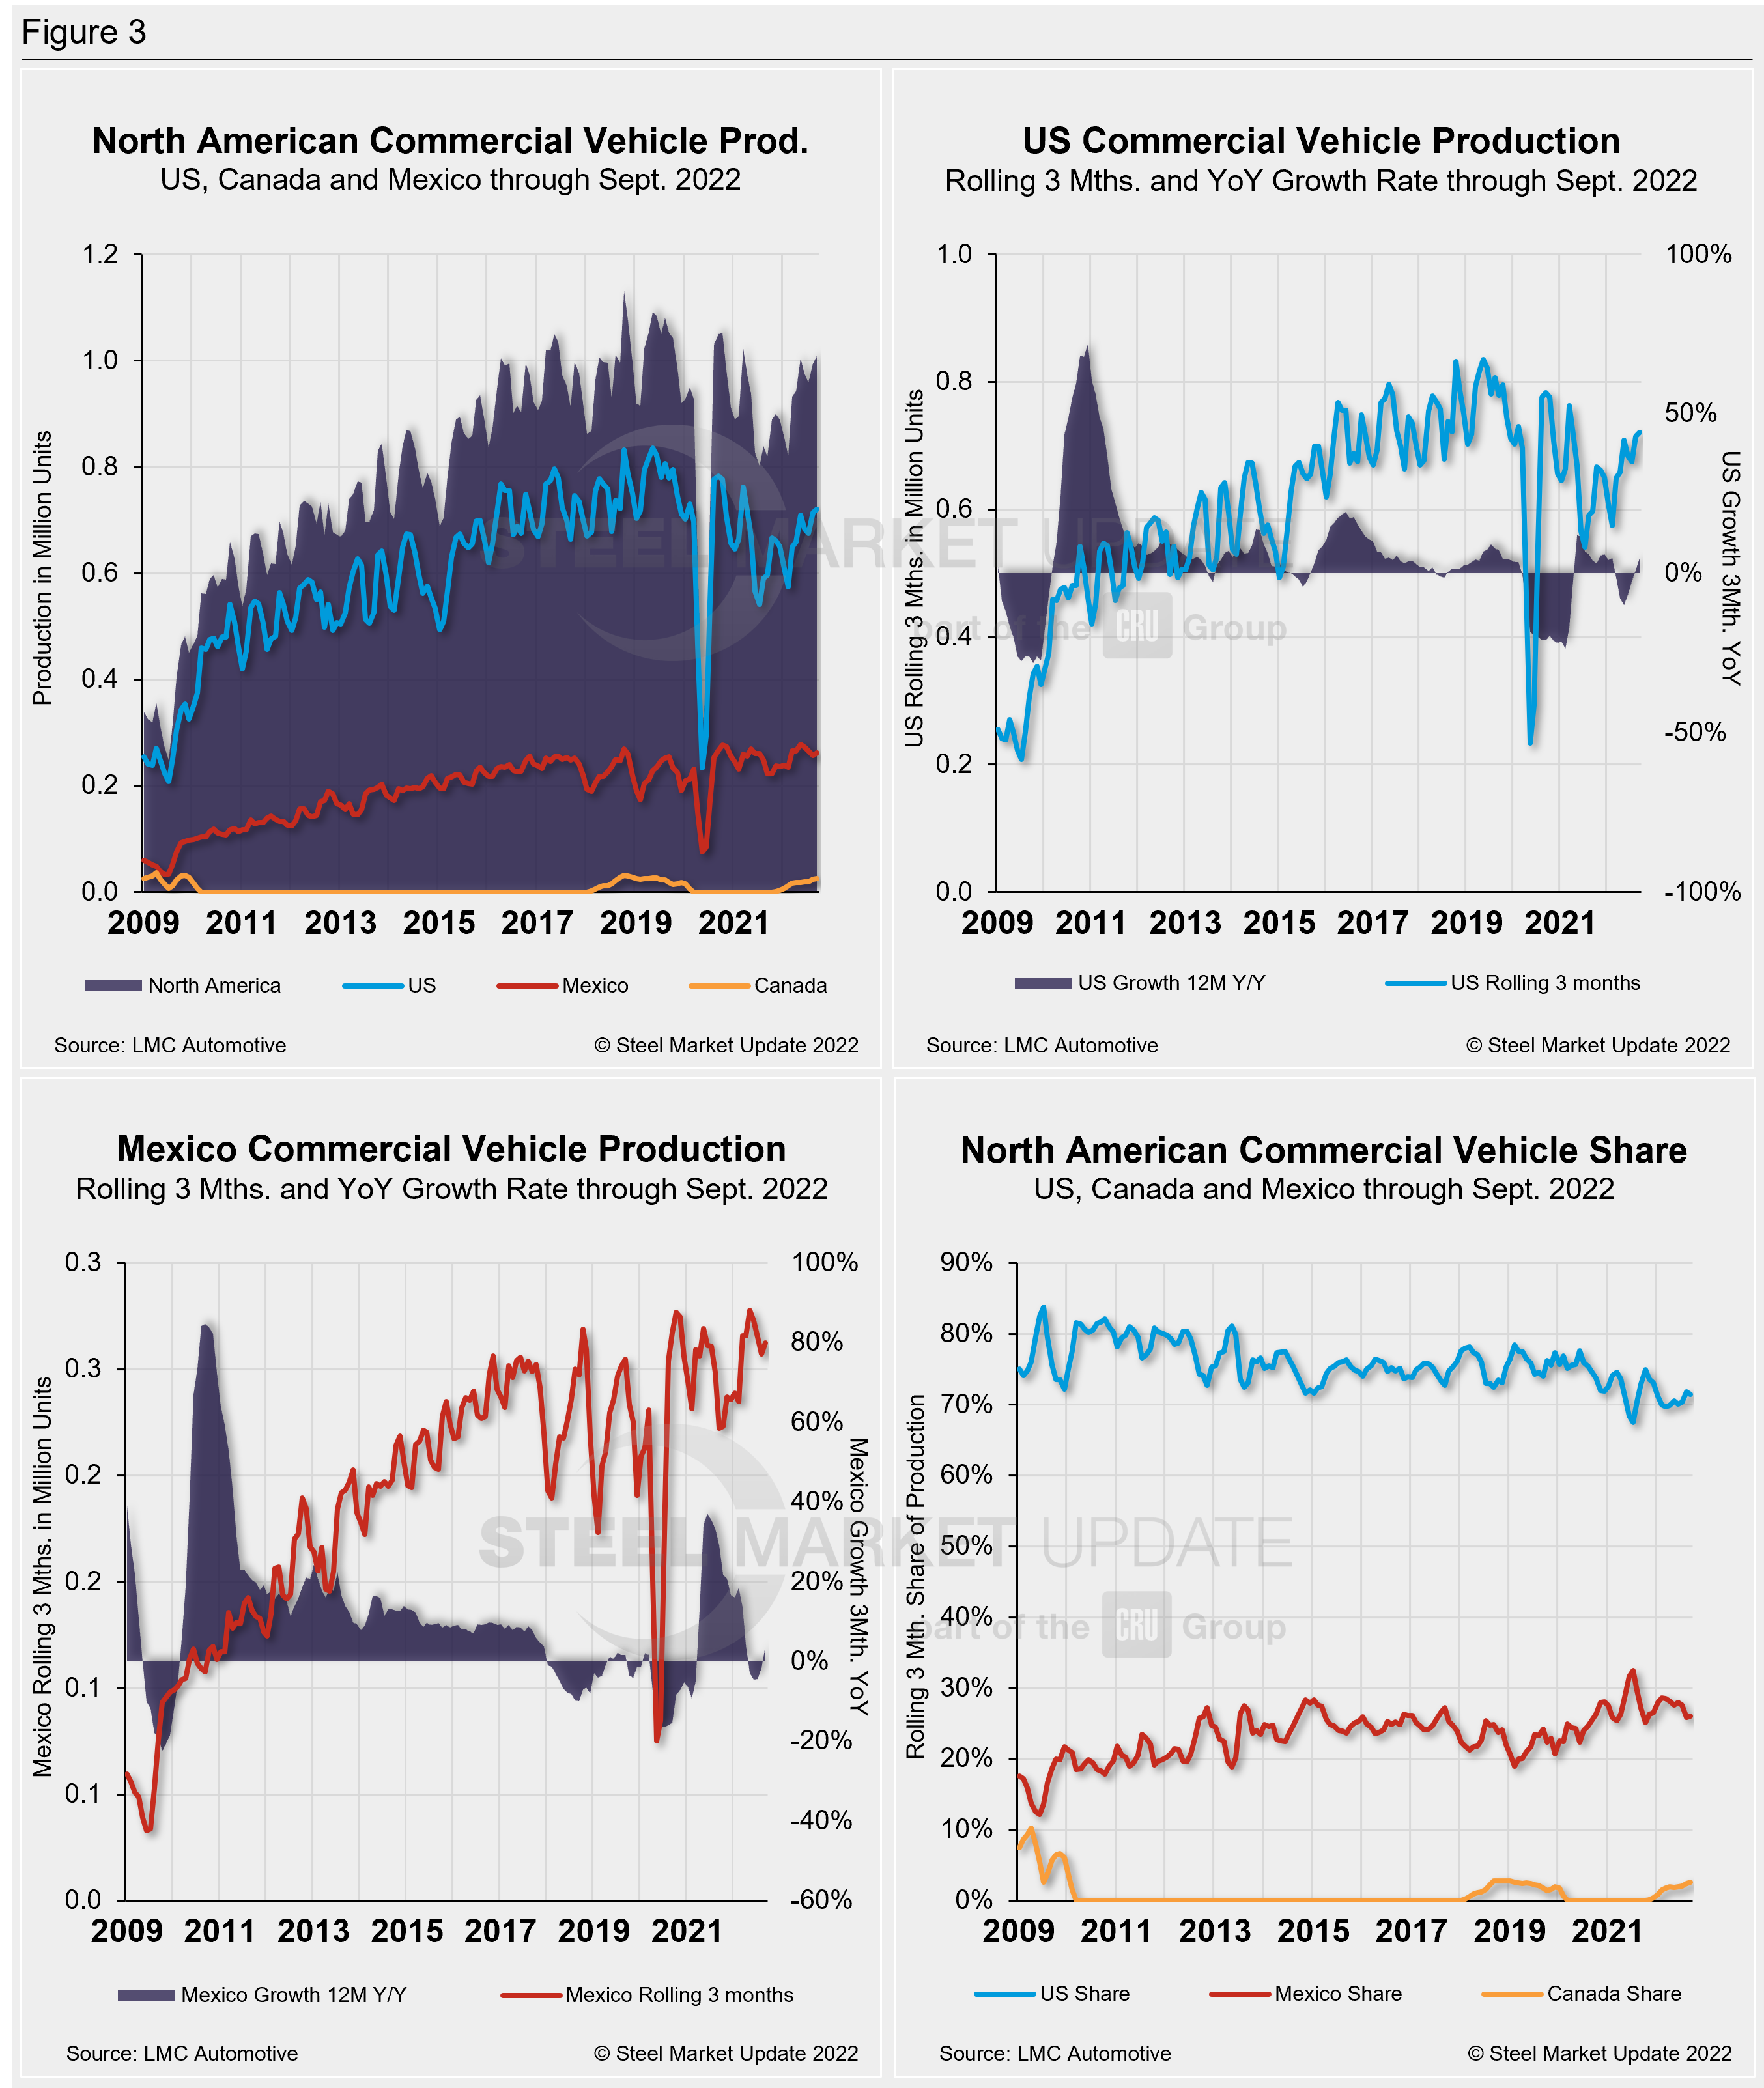
Total commercial vehicle production for North America and the total for each nation within the region are shown in the first chart in Figure 3 on a rolling three-month basis. Commercial vehicle production in the US and Mexico and their YoY growth rates, as well as the production share for each nation in North America, are also shown.
Of note for the Canadian automotive sector: September marked Canada’s 11th consecutive month of commercial vehicle production after a 20-month production halt. Canada produced 10,030 light commercial vehicles in September, a 0.3% decline from August’s total of 10,056 units — its highest total since resuming production last November.
North American commercial vehicle production declined by 8.5% in September to 347,514 units from 379,965 units in August. The 32,451-unit MoM loss was still North America’s third-highest production total YTD. The US saw the greatest unit and percentage loss, down 36,565 units (-13%), followed by Canada, down just 26 units (-0.3%). Mexico posted a 4.6% gain MoM, with a total of 93,770 units for the month, up by 4,140 units in September.
Despite the overall decline, the commercial production growth rate is now 6.3% for the region, an improvement from 1.8% in August. The US share was little changed, but slipped to 71.4% in September, down from 71.8% in August. Canada saw its share increase slightly to 2.6% in September from 2.4% in August. Mexico also saw its share increase by two percentage points last month to 26%. Presently, Mexico exports just under 80% of its light vehicle production. The US and Canada are the highest volume destinations for Mexican exports.
Editor’s Note: This report is based on data from LMC Automotive for automotive assemblies in the US, Canada, and Mexico. The breakdown of assemblies is “Personal” (cars for personal use) and “Commercial” (light vehicles less than 6.0 metric tons gross vehicle weight rating; heavy trucks and buses are not included).
By David Schollaert, David@SteelMarketUpdate.com


