

Market Data

October 24, 2022
ABI: Demand Grew at a Slower Pace in September
Written by David Schollaert
Demand for design services from US architecture firms continued to grow in September, though the pace of growth declined month-on-month (MoM).
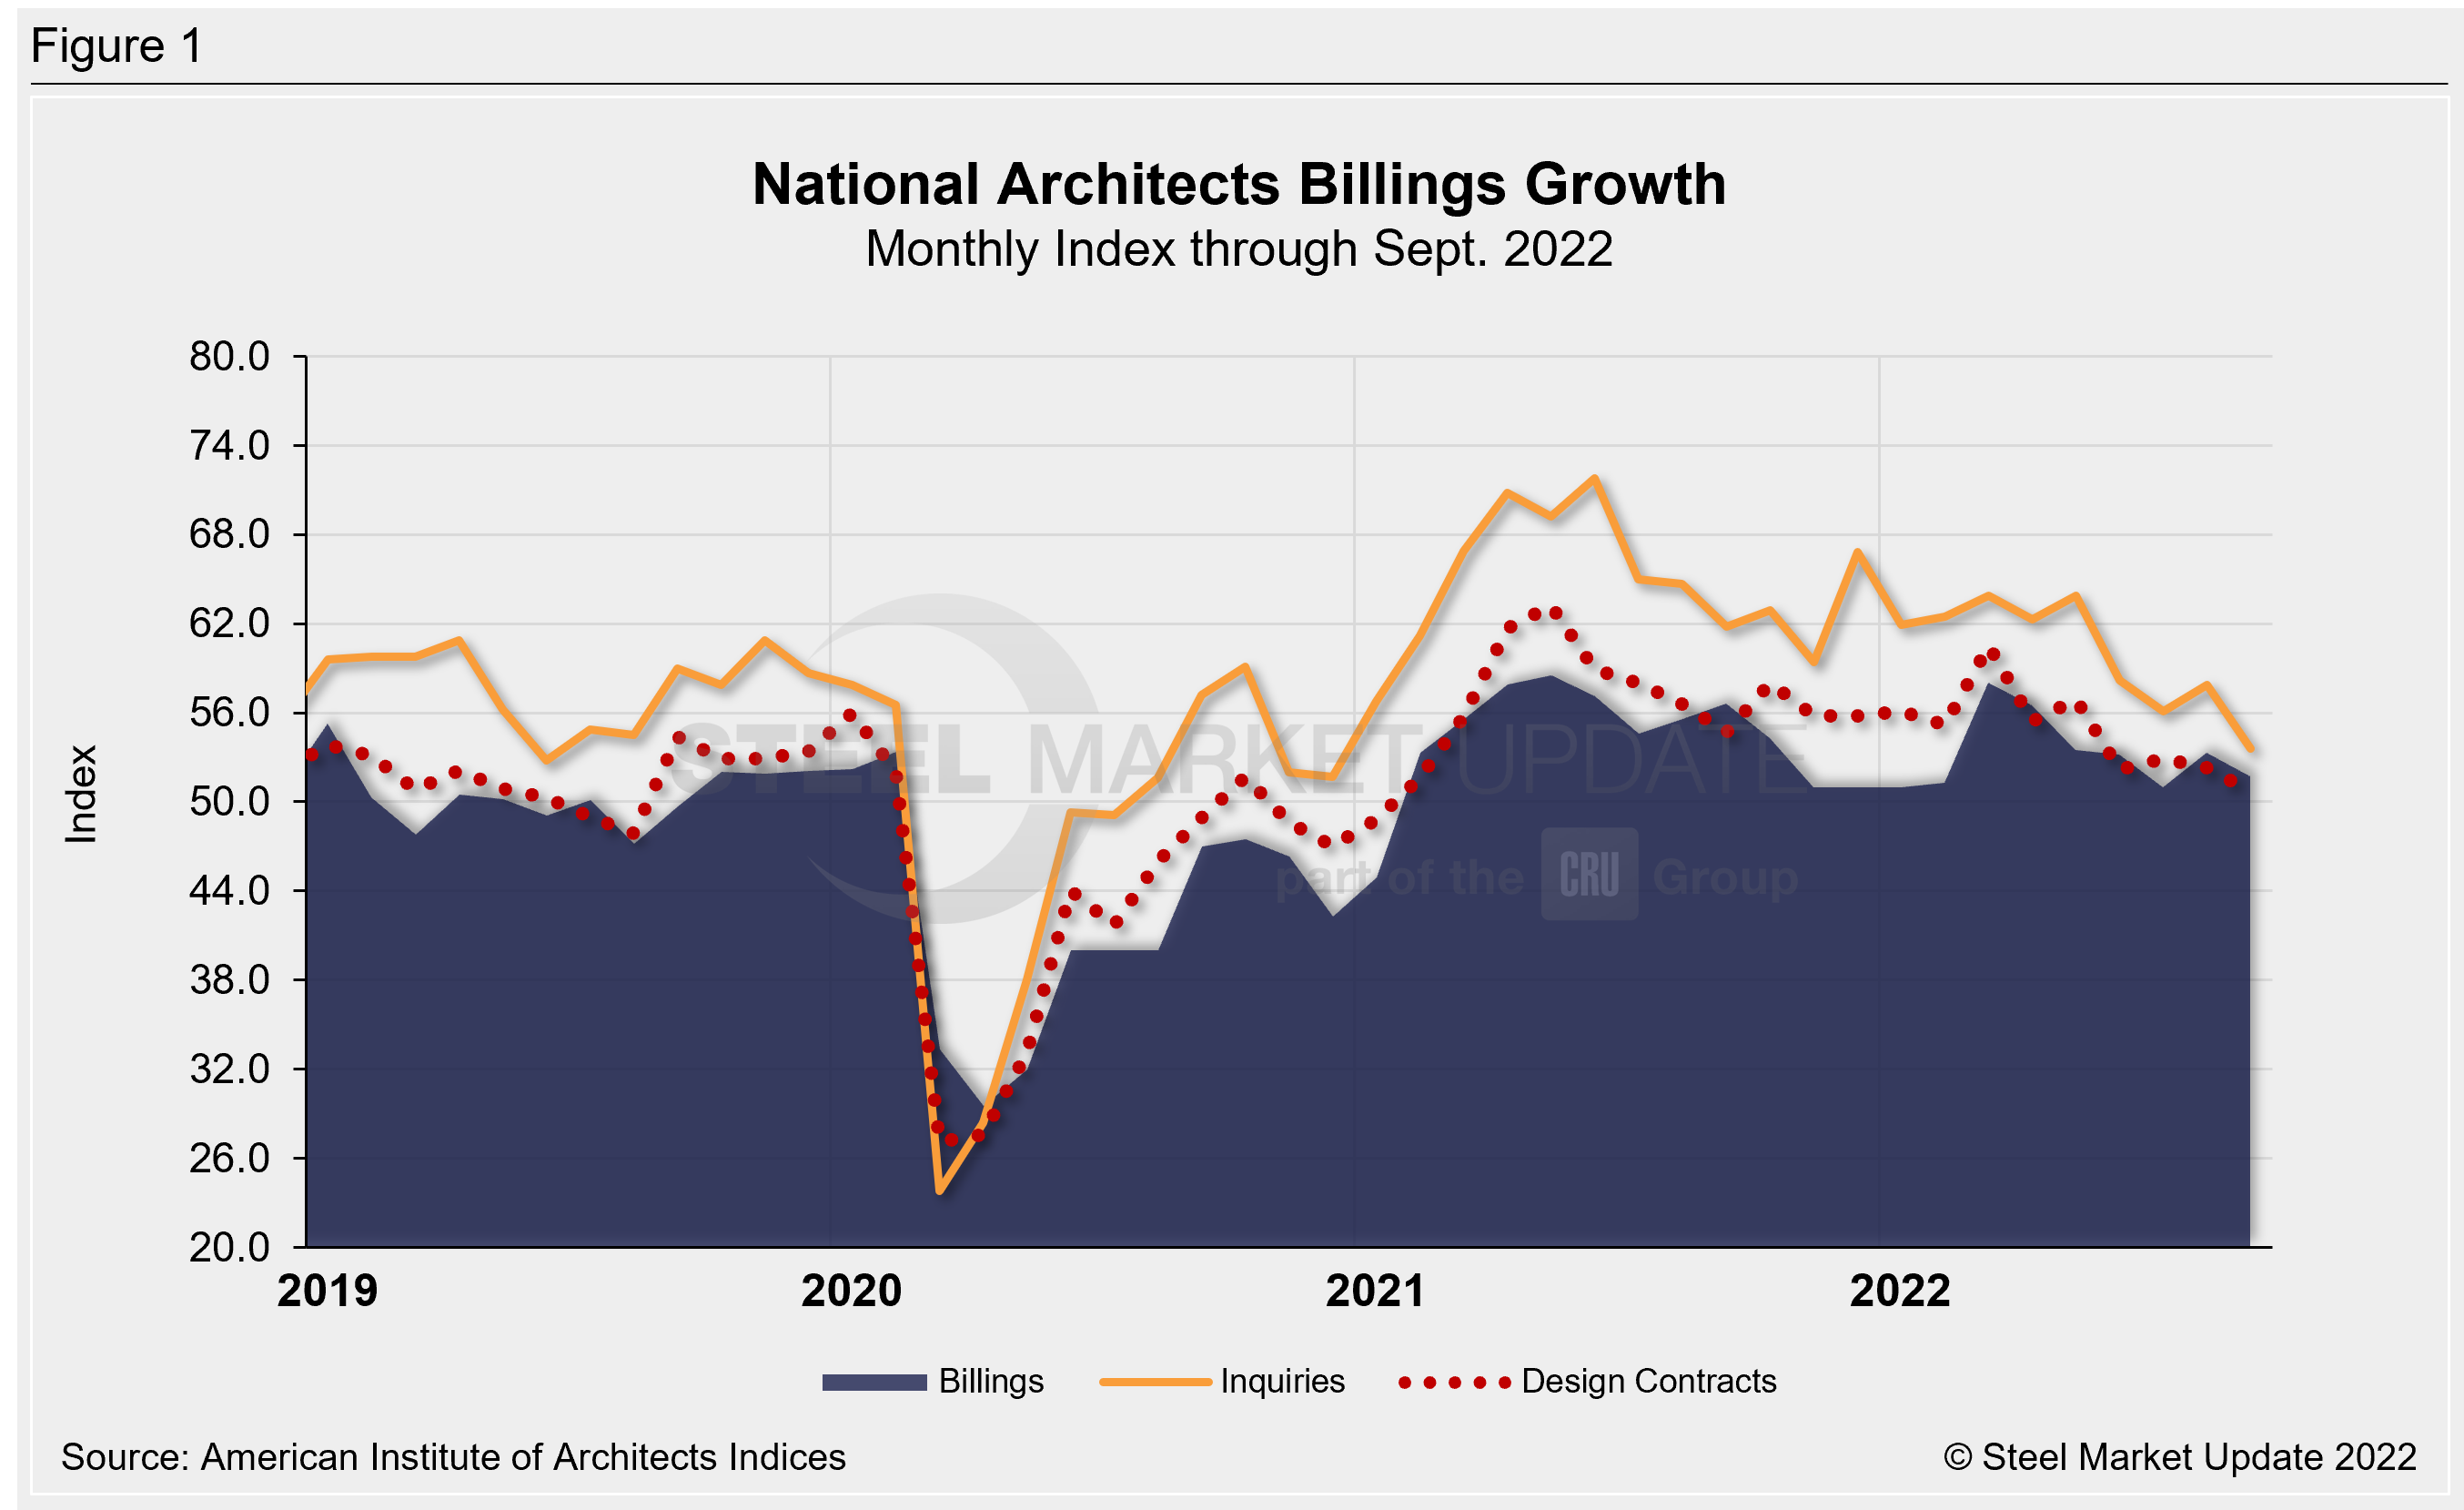
The September AIA Architecture Billings Index (ABI) score slipped last month after rising for the first time in five months in August. Despite the MoM decline, the development also marked the 20th consecutive month of growth following the pandemic-induced downturn in 2020.
Recall that the ABI is an advanced economic indicator for nonresidential construction activity with a lead time of 9–12 months. A score above 50 indicates an increase in activity, and a score below 50 indicates a decrease.
The September ABI registered 51.7, down from August’s score of 53.3, according to the latest report from the American Institute of Architects (AIA). Last month’s result was the second-lowest score since January. The result points to ongoing issues such as inflation and economic uncertainty.
In September, new project inquiries and design contracts dipped slightly to 53.6 and 50.7, respectively, from 57.9 and 52.3 in August. They still indicate robust growth despite the MoM easing.
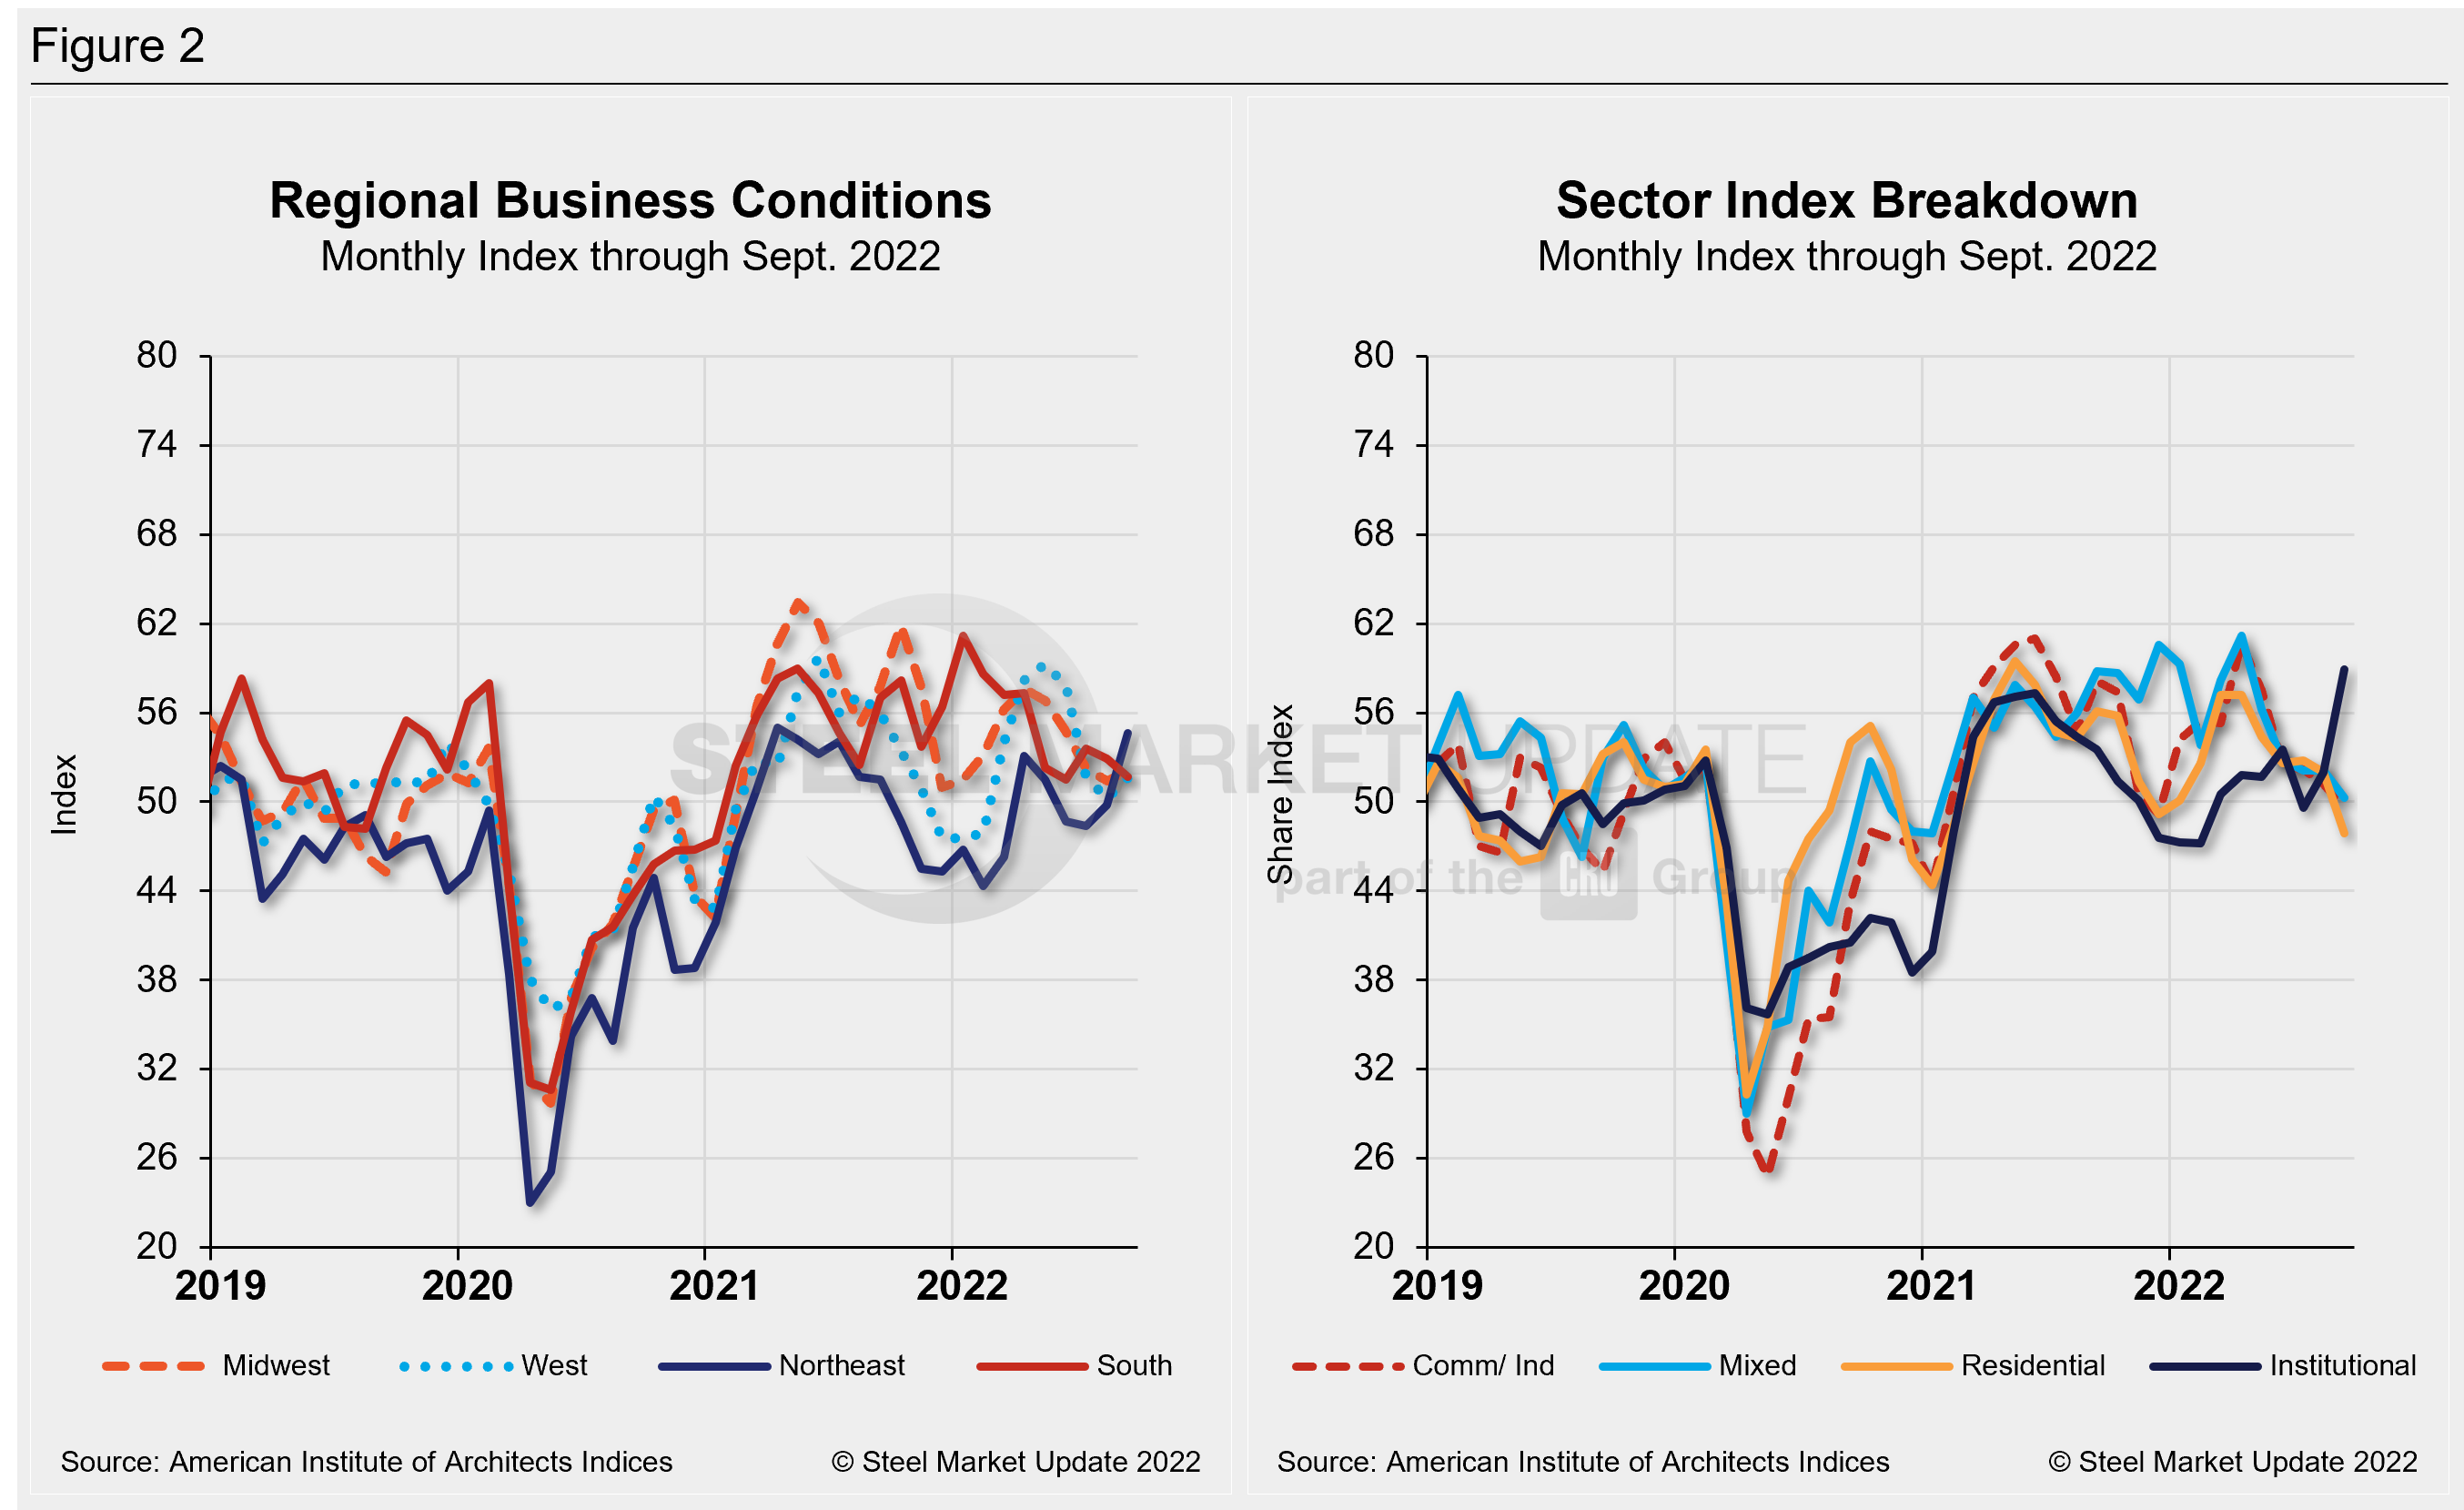
While the national average ABI score decreased, business conditions in the Northeast improved and reached their “highest pace of growth” in recent years coming in with a score of 54.6 – up sharply from 49.8 in August. The Northeast also outpaced the rate of growth in the South, which posted 51.7 in September, down from 52.9 the month prior. Scores in the Midwest and Western regions inched up to 52.1 and 51.6, respectively.
By end market, all segments – residential, commercial, and institutional – reported increases in billings, with the strongest growth in multifamily residential and institutional projects.
“While billings in the Northeast region and the Institutional sector reached their highest pace of growth in several years, there appears to be emerging weakness in the previously healthy multifamily residential and commercial/industrial sectors, which saw a decline in billings for the first time since the post-pandemic recovery began,” AIA chief economist Kermit Baker said.
Both multifamily residential and commercial/industrial sectors reported a decrease in billings, with commercial down to 49.6 and residential slightly below that at 47.9, the report said.
“Across the broader architecture sector, backlogs at firms remained at a robust 7.0 months as of the end of September, still near record-high levels since we began collecting this data regularly more than a decade ago,” added Baker.
Key ABI highlights for September include:
- Regional averages: Northeast (54.6), Midwest (52.1), South (51.7), West (51.6)
- Sector index breakdown: institutional (58.9), mixed practice (50.3), commercial/industrial (49.6), multi-family residential (47.9)
Regional and sector scores are calculated as 3MMA. Below are three charts showing the history of the AIA Architecture Billings Index, Reginal Business Conditions, and Sectors.
An interactive history of the AIA Architecture Billings Index is available on our website. Please contact us at info@SteelMarketUpdate.com if you need assistance logging into or navigating the website.
By David Schollaert, David@SteelMarketUpdate.com


