

Market Data

November 9, 2022
US Jobs Creation Slows, Nearing a Two-Year Low
Written by David Schollaert
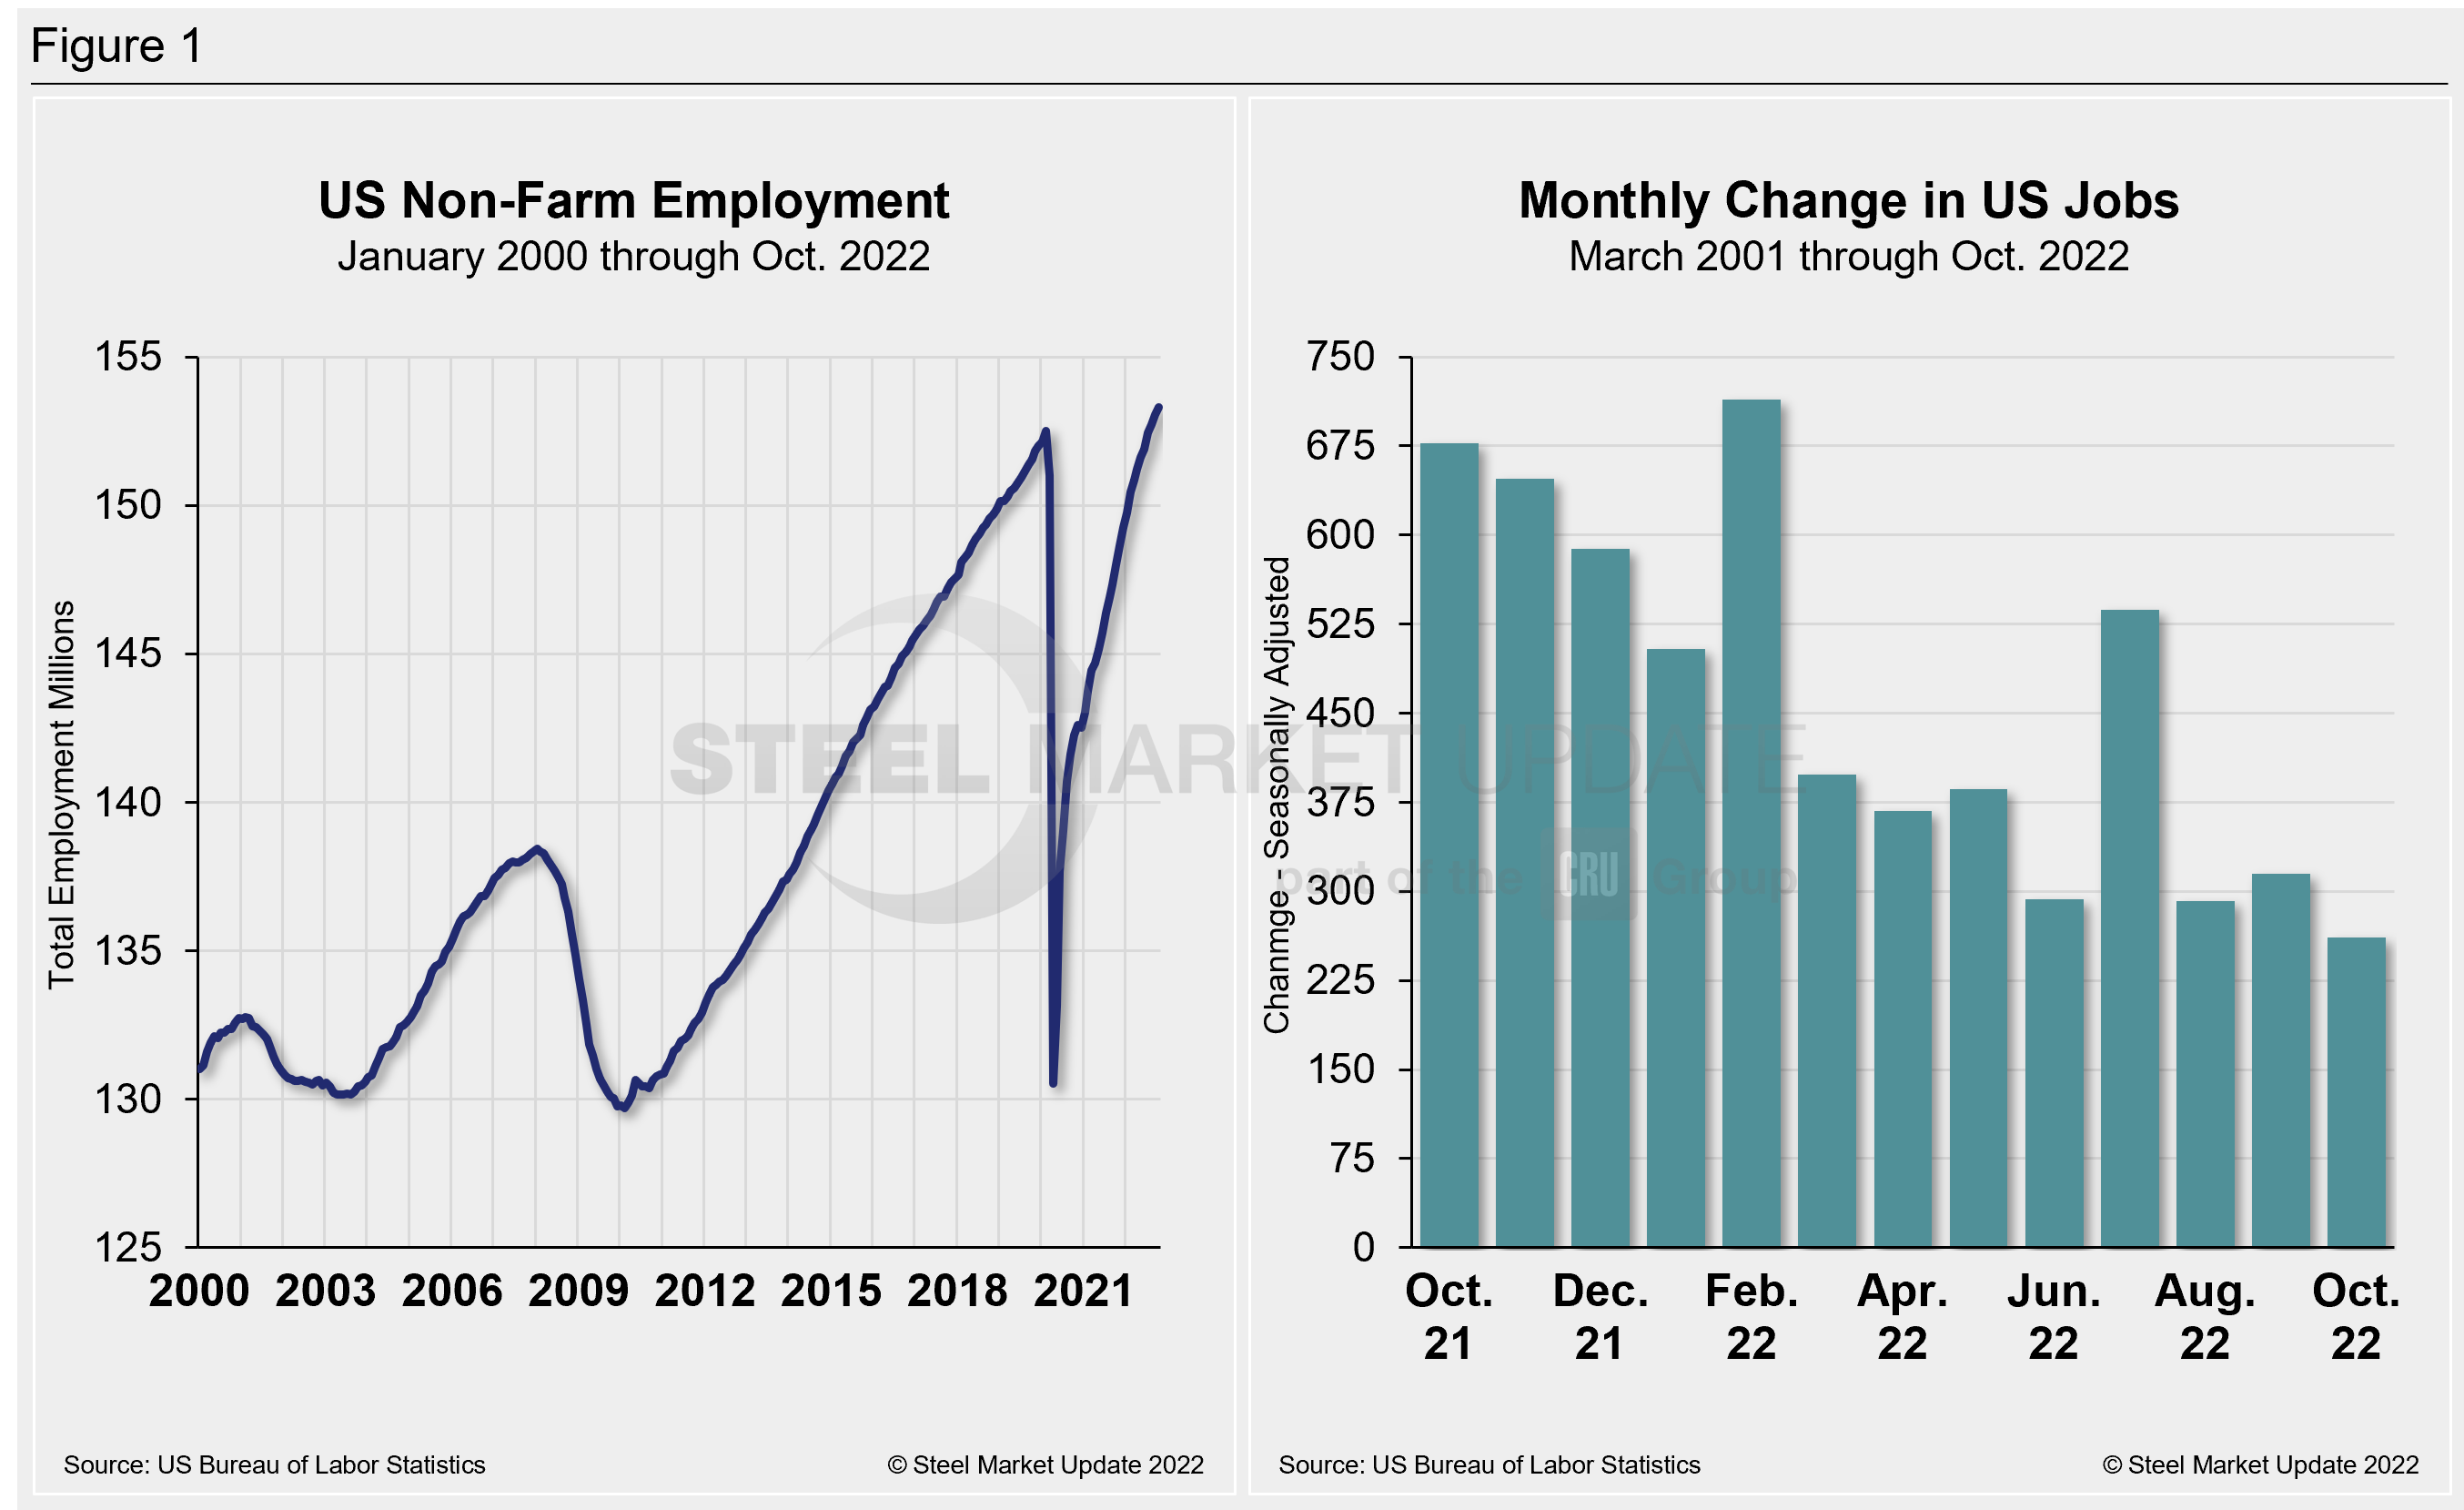
The US economy added 261,000 new jobs in October, outperforming consensus expectations but still decelerating to the slowest pace since December 2020, according to data from the US Department of Labor.
In contrast, the unemployment rate moved higher last month to 3.7%, after estimates expected the October measure to remain sideways and match the five-decade low of 3.5% seen the month prior.
Despite the slowdown in hiring, last month’s total was still solid by pre-pandemic standards, and somewhat resilient given the repeated interest rate hikes by the Federal Reserve aimed at slowing the labor market.
The employment growth was again widespread across industries last month, with manufacturing, healthcare, and professional and technical services seeing some of the biggest gains.
Side-by-side in Figure 1 below is a snapshot of the pace of hiring since April 2021 and the total number of non-farm workers employed in the US since 2000.
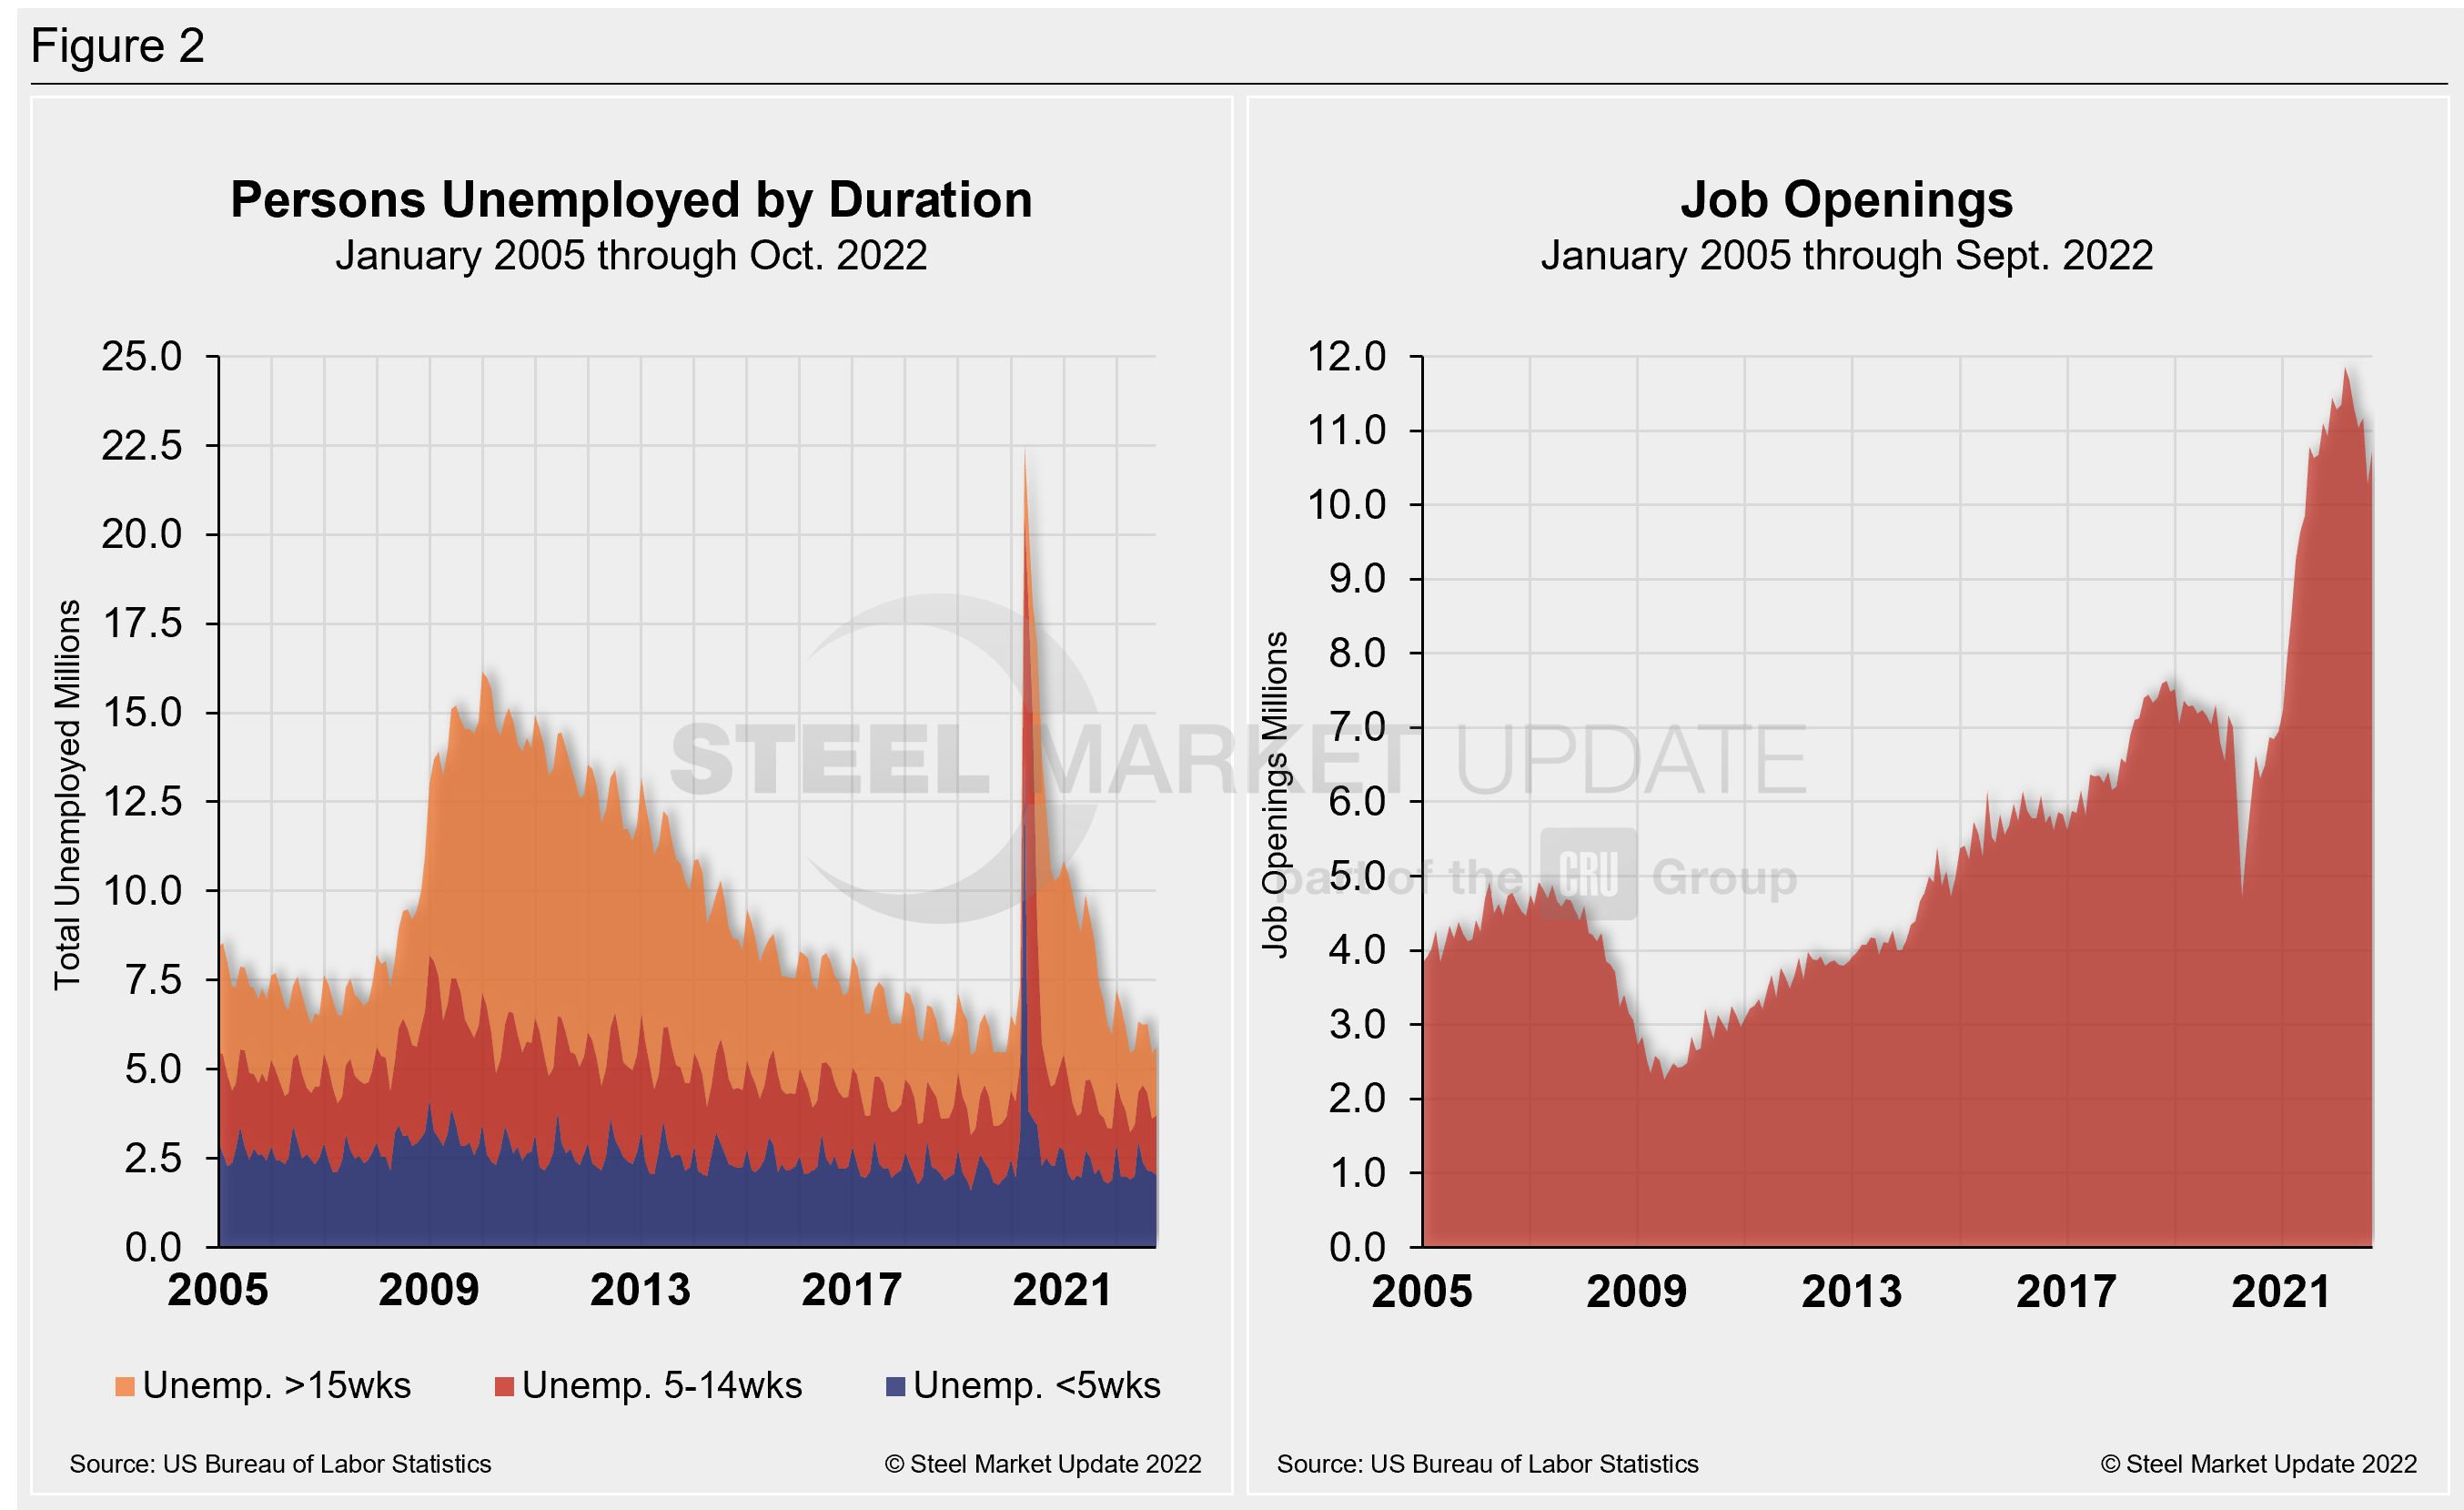
The number of long-term unemployed (out of work for at least 27 consecutive weeks) was little changed in September, totaling 1.2 million. That figure accounted for 19.5% of the total unemployed in the month.
The historic picture for the duration of unemployment since January 2005 is broken down into <5 weeks, 5–14 weeks, and >15 weeks in Figure 2. The total number of unemployed was 5.61 million at the end of October, an increase of 149,000 compared to September. The increase put the result 609,000 below the pre-pandemic unemployment total in February 2020.
October’s results show that roughly 16.9 million more people now have jobs compared to the 22.5 million thrown out of work during the worst of the pandemic in April 2020. As of Nov. 9, 34% had been unemployed for more than 15 weeks, 30% for 5 to 14 weeks, and 36% for less than five weeks.
As part of October’s employment report, the Labor Department released its monthly report on job openings, layoffs, and quitting through the last day of September. Also known as the “JOLTS” report, the data indicates how much demand there is for workers in the US economy and the extent to which employers are still struggling with labor shortages nearly two years removed from the worst of the pandemic.
September’s job openings rose month-on-month (MoM) after declining the month before to the lowest total since June 2021. The report suggests that workers remain in high demand and are still quitting more often. There were about 10.7 million job openings in September — 437,000 more job openings than in August and 1.2 million fewer than the record of 11.9 million set in March.
The charts below (Figure 2) detail the total persons unemployed by duration from 2005 through September 2022 and the total job openings over the same period.
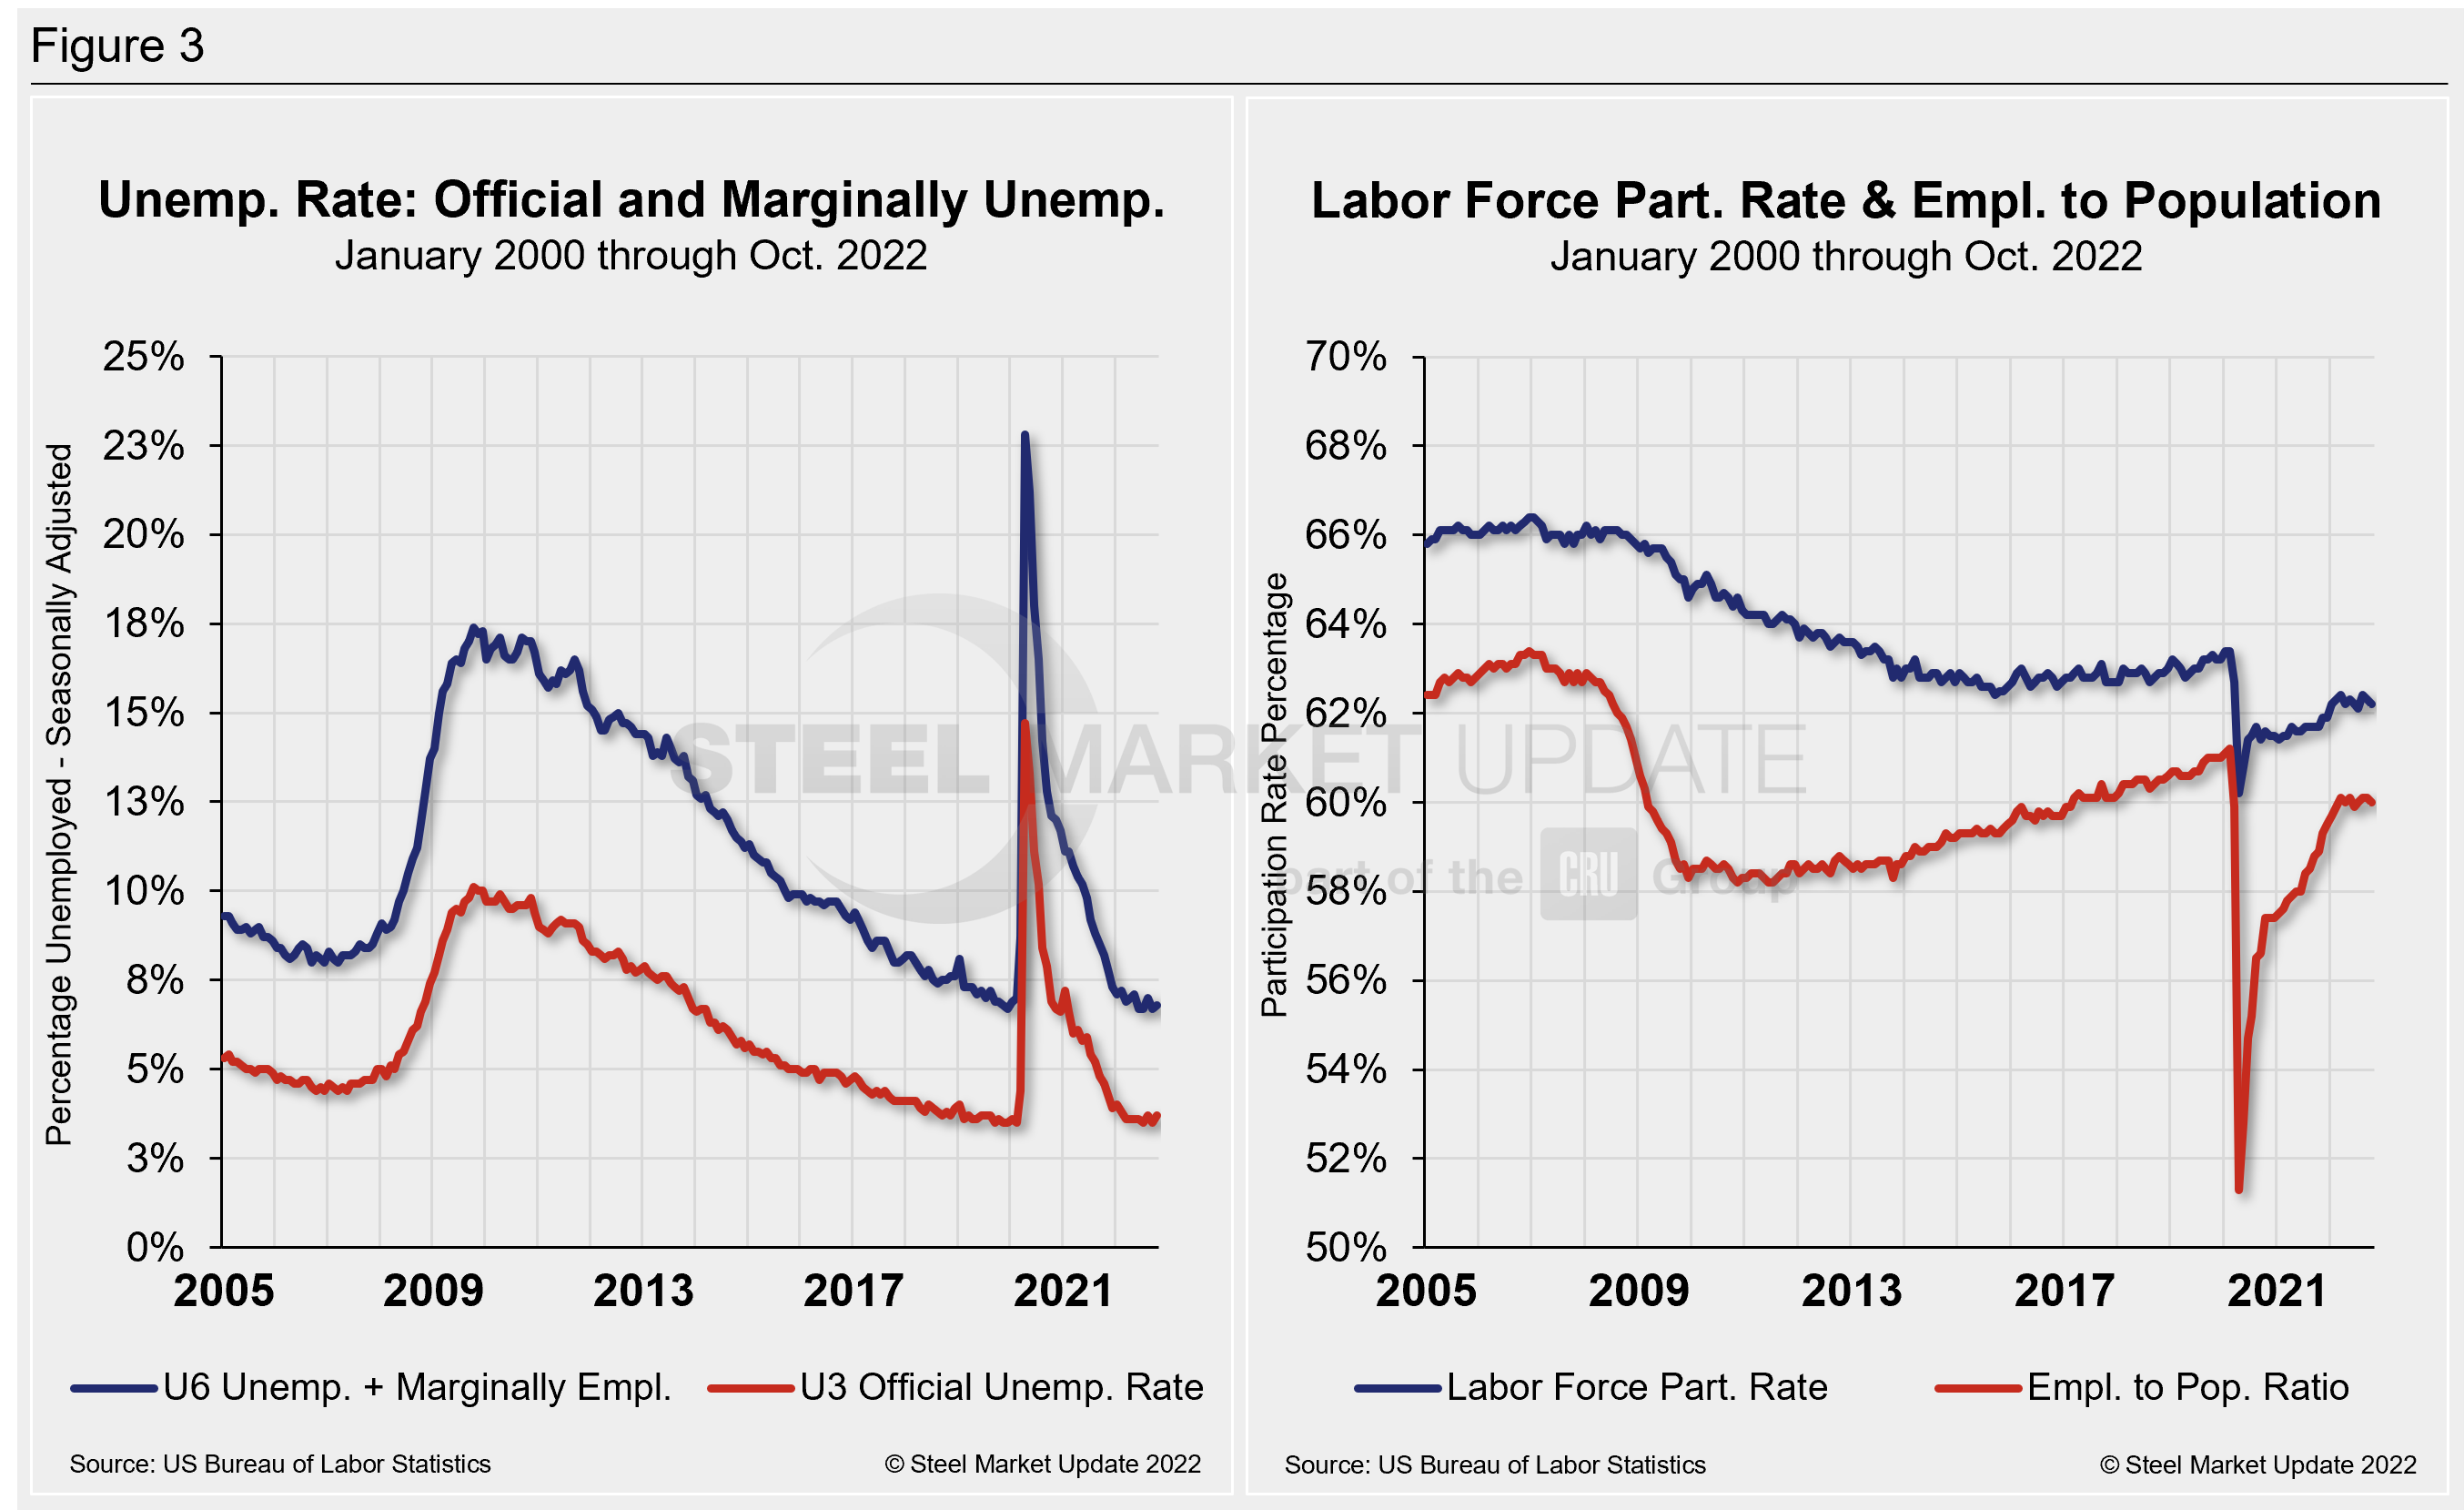
The official unemployment rate, U3, reported in the Bureau of Labor Statistics Household survey (see explanation below), increased from 3.5% in February 2020 to 14.7% in April 2020. A steady decrease followed until a slight increase in March. October’s measure of 3.7% is up 0.2 percentage points MoM and is no longer in pre-pandemic form as it has been.
A more encompassing view of unemployment (U6) that includes those holding part-time jobs for economic reasons, as well as discouraged workers not looking for jobs, was 6.8%, up from 6.7% in September.
Another gauge, and a more definitive view, are the number employed as a percentage of the population. Last month, the employment-to-population ratio was 60%, down 0.1 percentage point versus September.
Figure 3 details side-by-side parallels of the unemployment rate (both the U3 and U6 rates) since 2005 as well as the labor force participation rate and employment-to-population ratio over the same period.
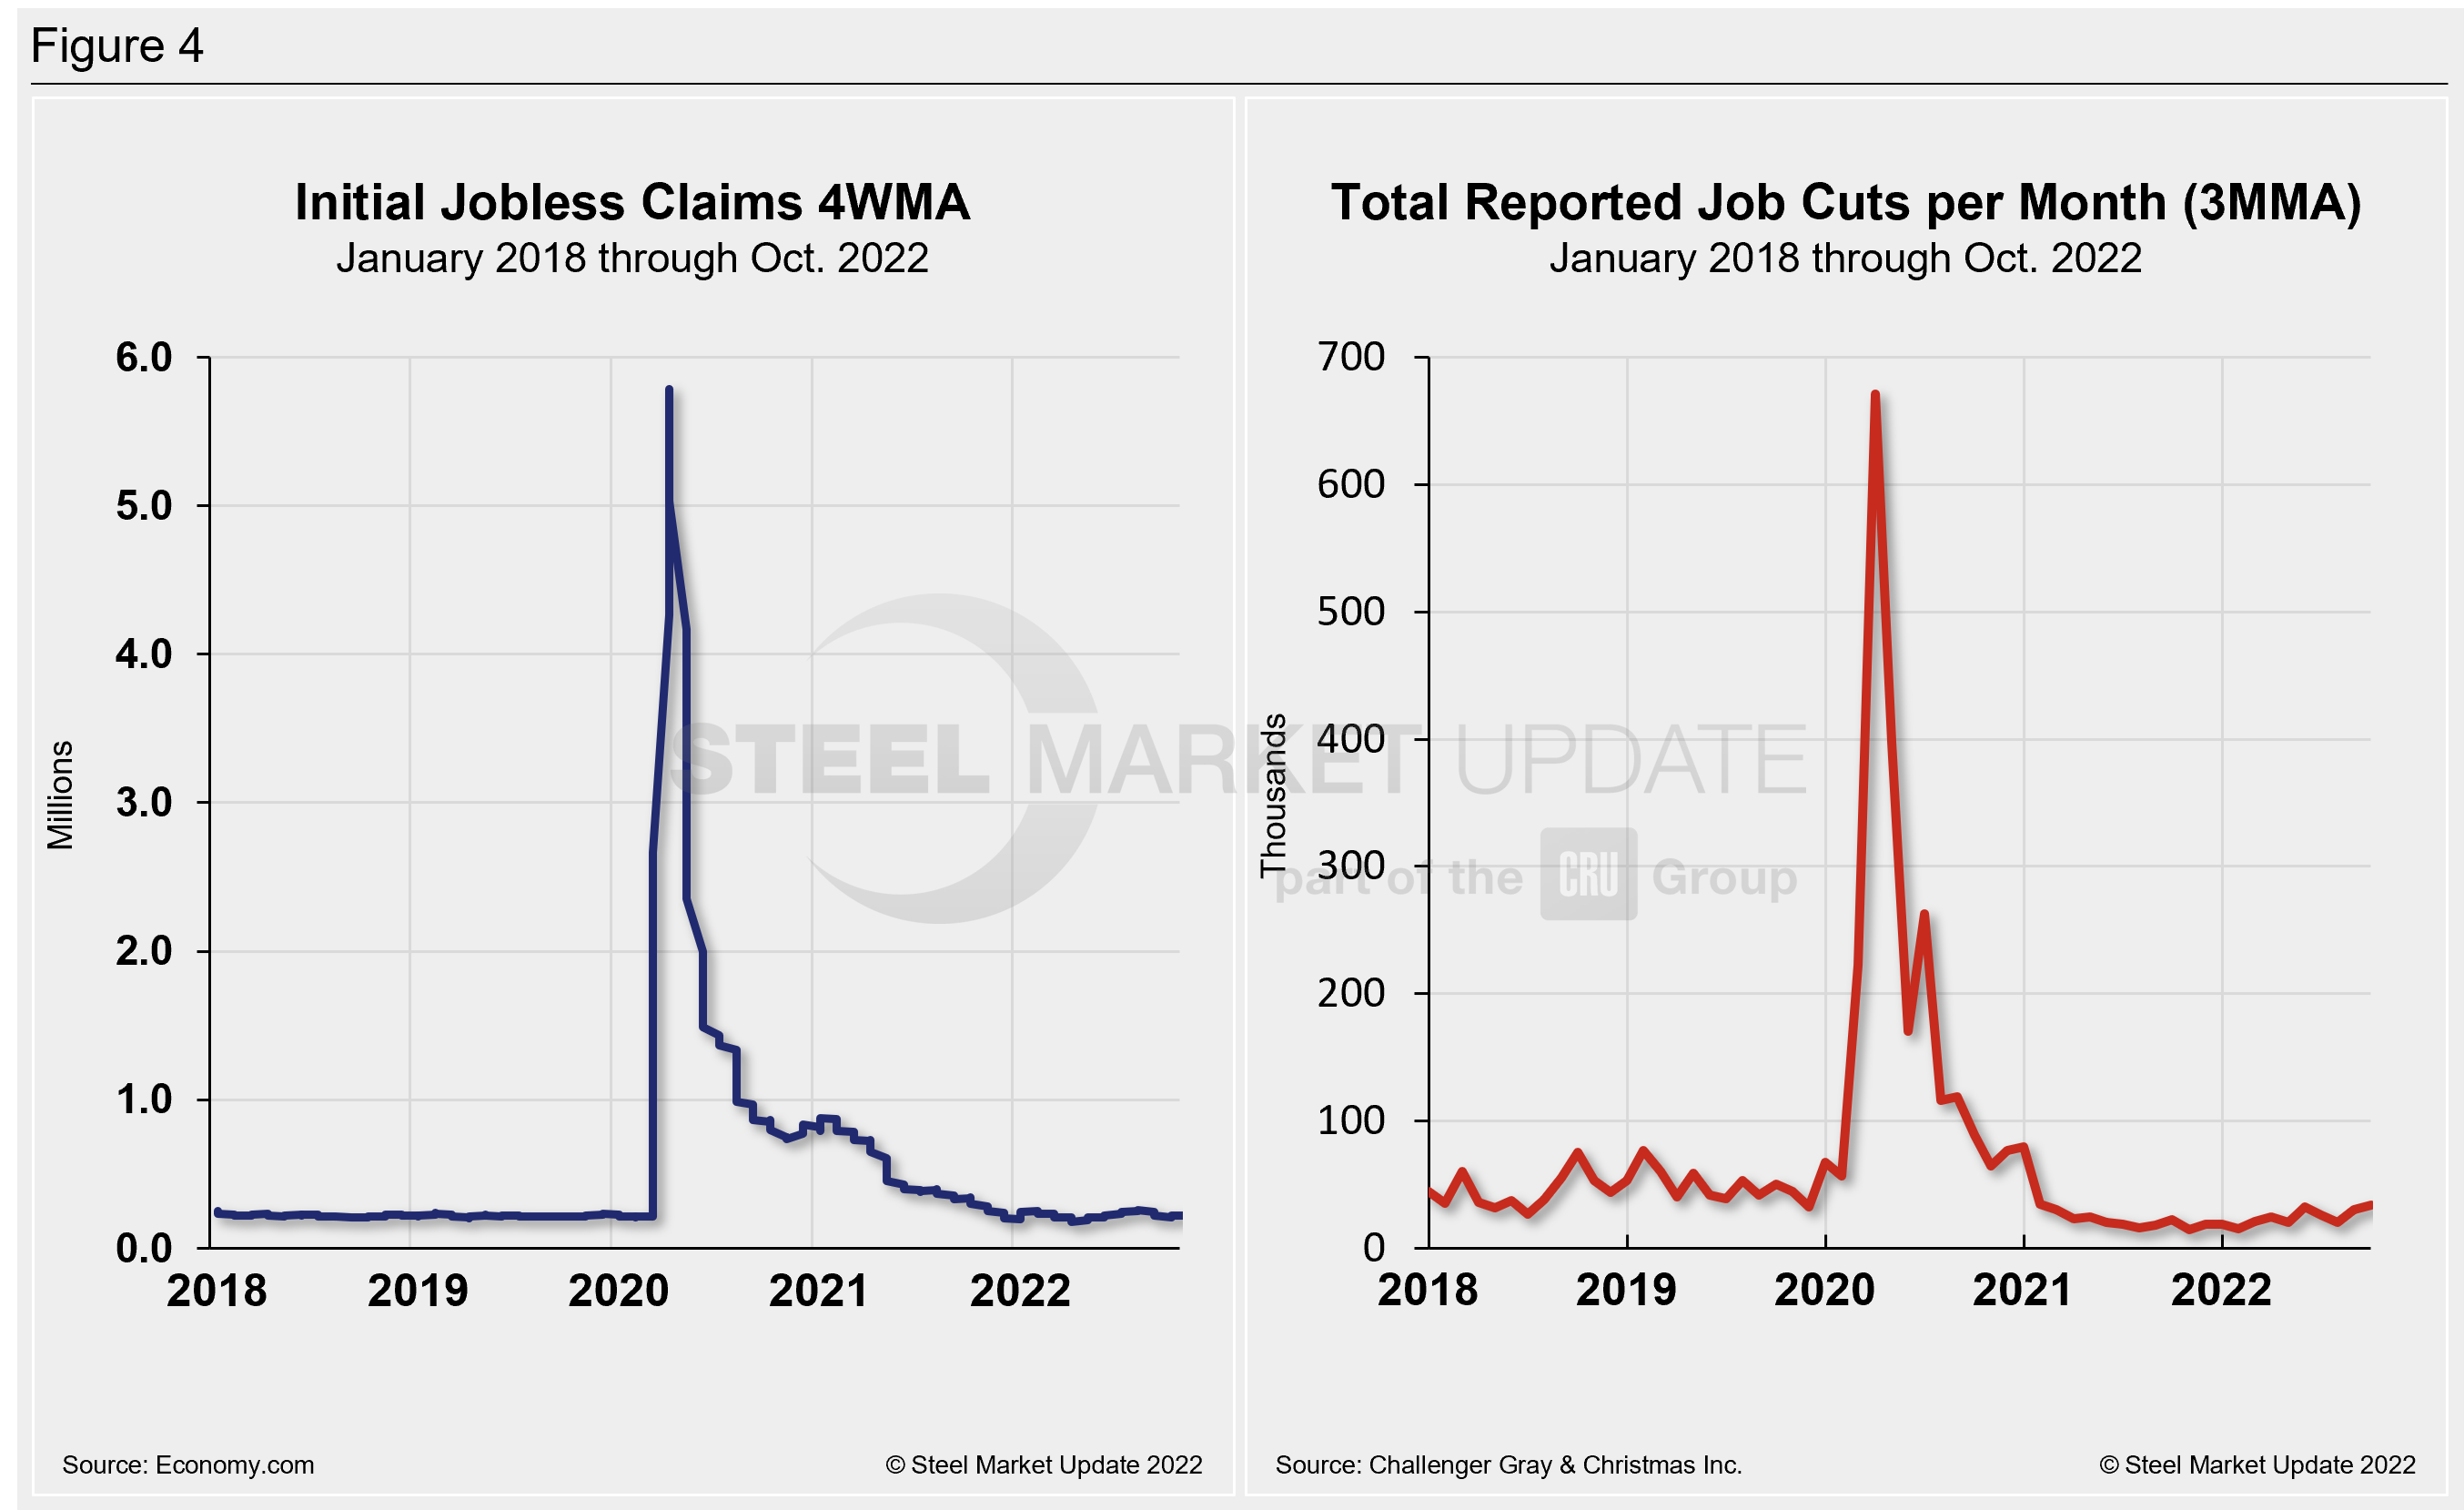
Initial claims for unemployment insurance, which are reported weekly by the Department of Labor, were sideways in the week ended Nov. 3, totaling 217,000 but up by 24,000 new claims since our last report a month ago. Despite the MoM increase, they remain historically low and well below the 250,000 threshold and reflective of a strong labor market, the Department of Labor said.
The four-week moving average of initial claims is up slightly over the last month but still “reflective of a very strong labor market. Continuing claims were also up modestly, while the insured unemployment rate held steady at 1%,” Economy.com reported.
Human resources consulting firm Challenger, Gray and Christmas Inc. produces a monthly employment update for the US. It reported that job cuts in October totaled 33,843 — an increase of 13% from the 29,989 announced the previous month. October’s total is 48% higher than the same year-ago period when 22,282 cuts were announced.
October marks the sixth time this year that cuts were higher in 2022 than in the corresponding month a year earlier. Last month’s total was the highest total job cuts in a single month since February 2021, the report said.
Year-to-date (YTD), employers announced 243,338 cuts, down 16% from the 288,043 cuts announced through the same period in 2021. It is the lowest January to October total since Challenger began tracking job cuts in 1993.
“We are beginning to see more job cut activity in the fourth quarter, historically when the bulk of cuts occur, as companies finalize budgets and plans,” Challenger said. “Many companies are anticipating a downturn, and with a still-tight labor market and the Fed’s rate hikes, more cuts will be on the way as we enter 2023.”
Cuts were widespread in September. Technology companies led in job cut announcements last month, with 9,587, bringing total cuts YTD to 28,207, a 162% surge YoY in the sector. Other cuts included automotive, construction, and real estate, the report said.
Figure 4 shows the four-week moving average of new claims since January 2018, seasonally adjusted. It also shows the total reported job cuts per month, according to Challenger, on a three-month moving average.
Explanation: On the first Friday of each month, the Bureau of Labor Statistics releases the employment data for the previous month. Data is available at www.bls.gov. The BLS reports on the results of two surveys. The Establishment survey reports the actual number employed by industry. The Household survey reports on the unemployment rate, participation rate, earnings, average workweek, the breakout into full-time and part-time workers and lots more details describing the age breakdown of the unemployed, reasons for and duration of unemployment.
By David Schollaert, David@SteelMarketUpdate.com


