Logistics

December 4, 2022
Final Thoughts
Written by David Schollaert
This past week was a rather notable one in recent memory when it comes to steel prices. We saw a wave of $60-per-ton sheet price hikes announced by domestic mills. It’s somewhat of an unfamiliar sight in the industry over the past couple of years or so, but just about everyone got in on the action.
Granted, there hasn’t been a real need to provide formal pricing notices when tags are climbing at a record pace, and on a years-long run onto historic highs. But when you need to control the hemorrhaging, it’s all hands on deck.
We’ve spoken with several buyers this week – mainly service center and manufacturing OEM executives – to get a gauge on sentiment and whether they think the latest round of hikes will stick. Generally, most remain skeptical.
The move appears to have at least temporarily stopped the bleeding seen over the last two months, and time will tell if the price hike attempt finds support.
I own no crystal ball and I’ll refrain from forecasting or predicting what happens next, since it’s well over my pay grade, and again, no crystal ball. But I figured we could look at some interesting data on mill negotiations, lead times, and how they correlate with pricing.
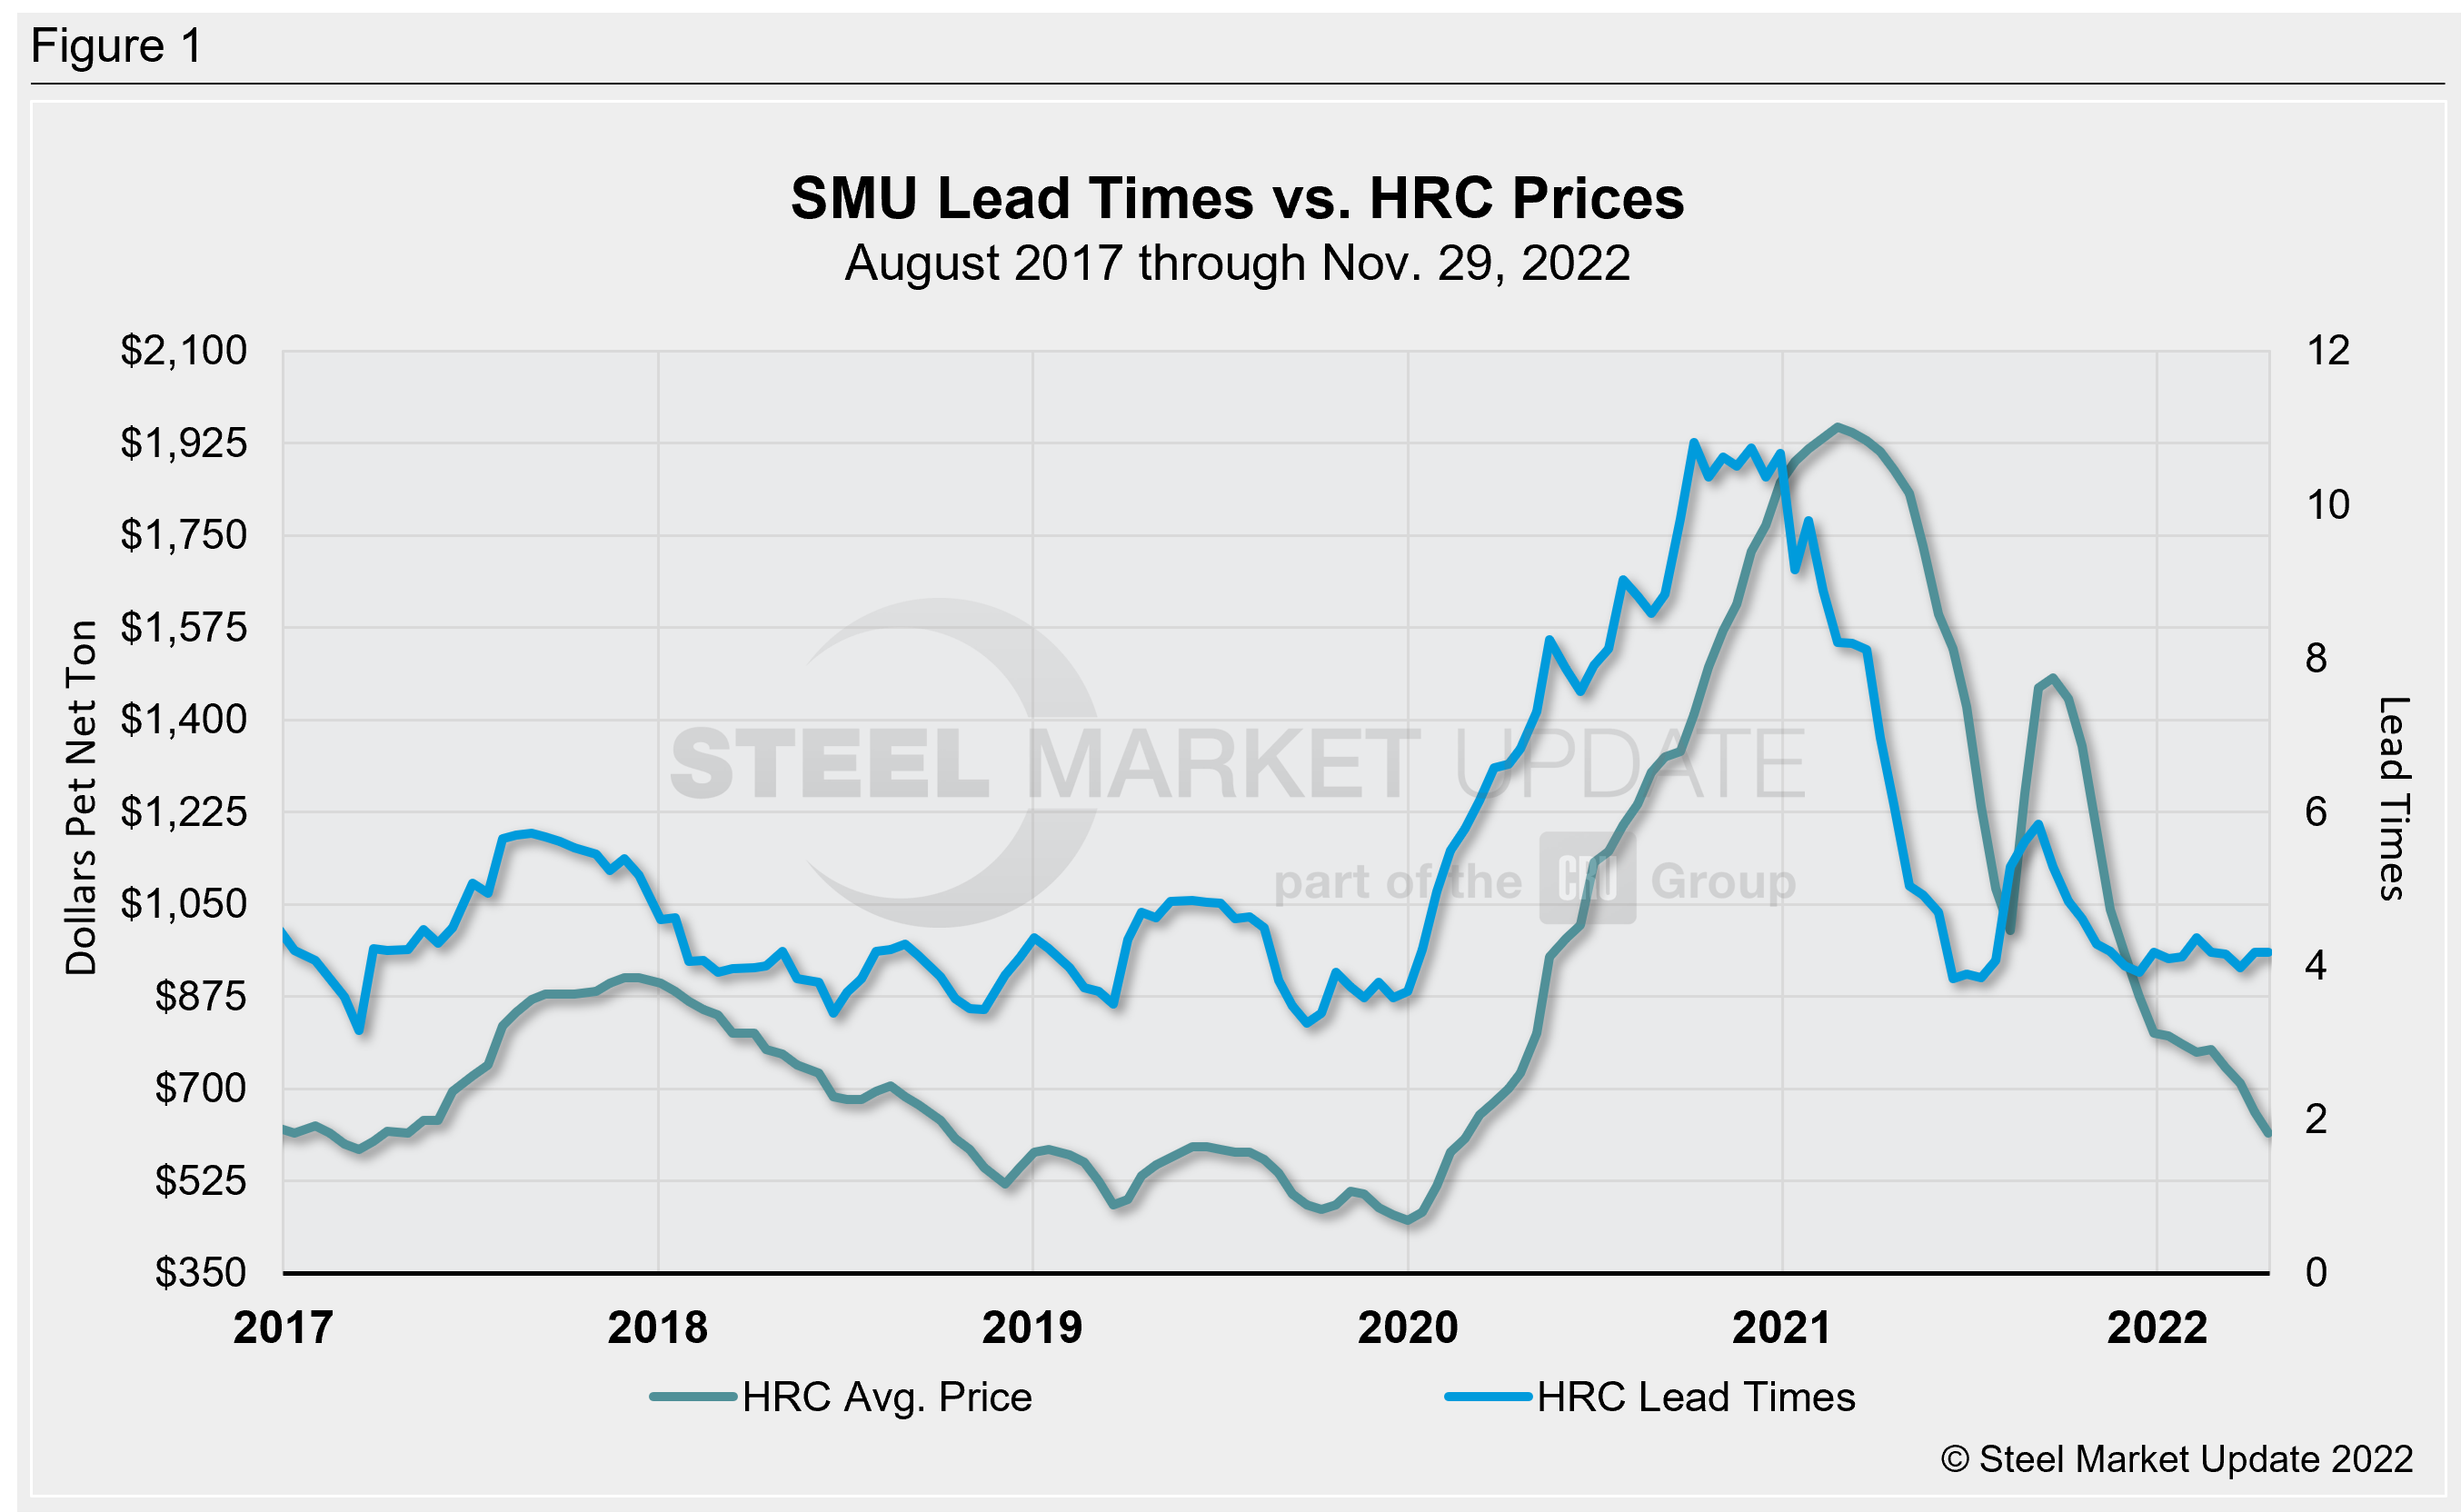
For starters, SMU’s lead times have historically been a leading indicator for flat-rolled steel prices, and HRC prices in particular (Figure 1 features the past five years). But there is some interesting nuance to maybe keep in mind when reviewing lead times. A four-week lead time when mill run rates are at or near 90% is very different from when mill run rates slip well below 80%. We have seen mills steadily dialing back production as much as possible.
There’s a close relationship between mills’ motivation to negotiate with buyers and lead times. That same dynamic can be seen when comparing prices and negotiation. These dynamics are displayed in Figure 2 and Figure 3 below.
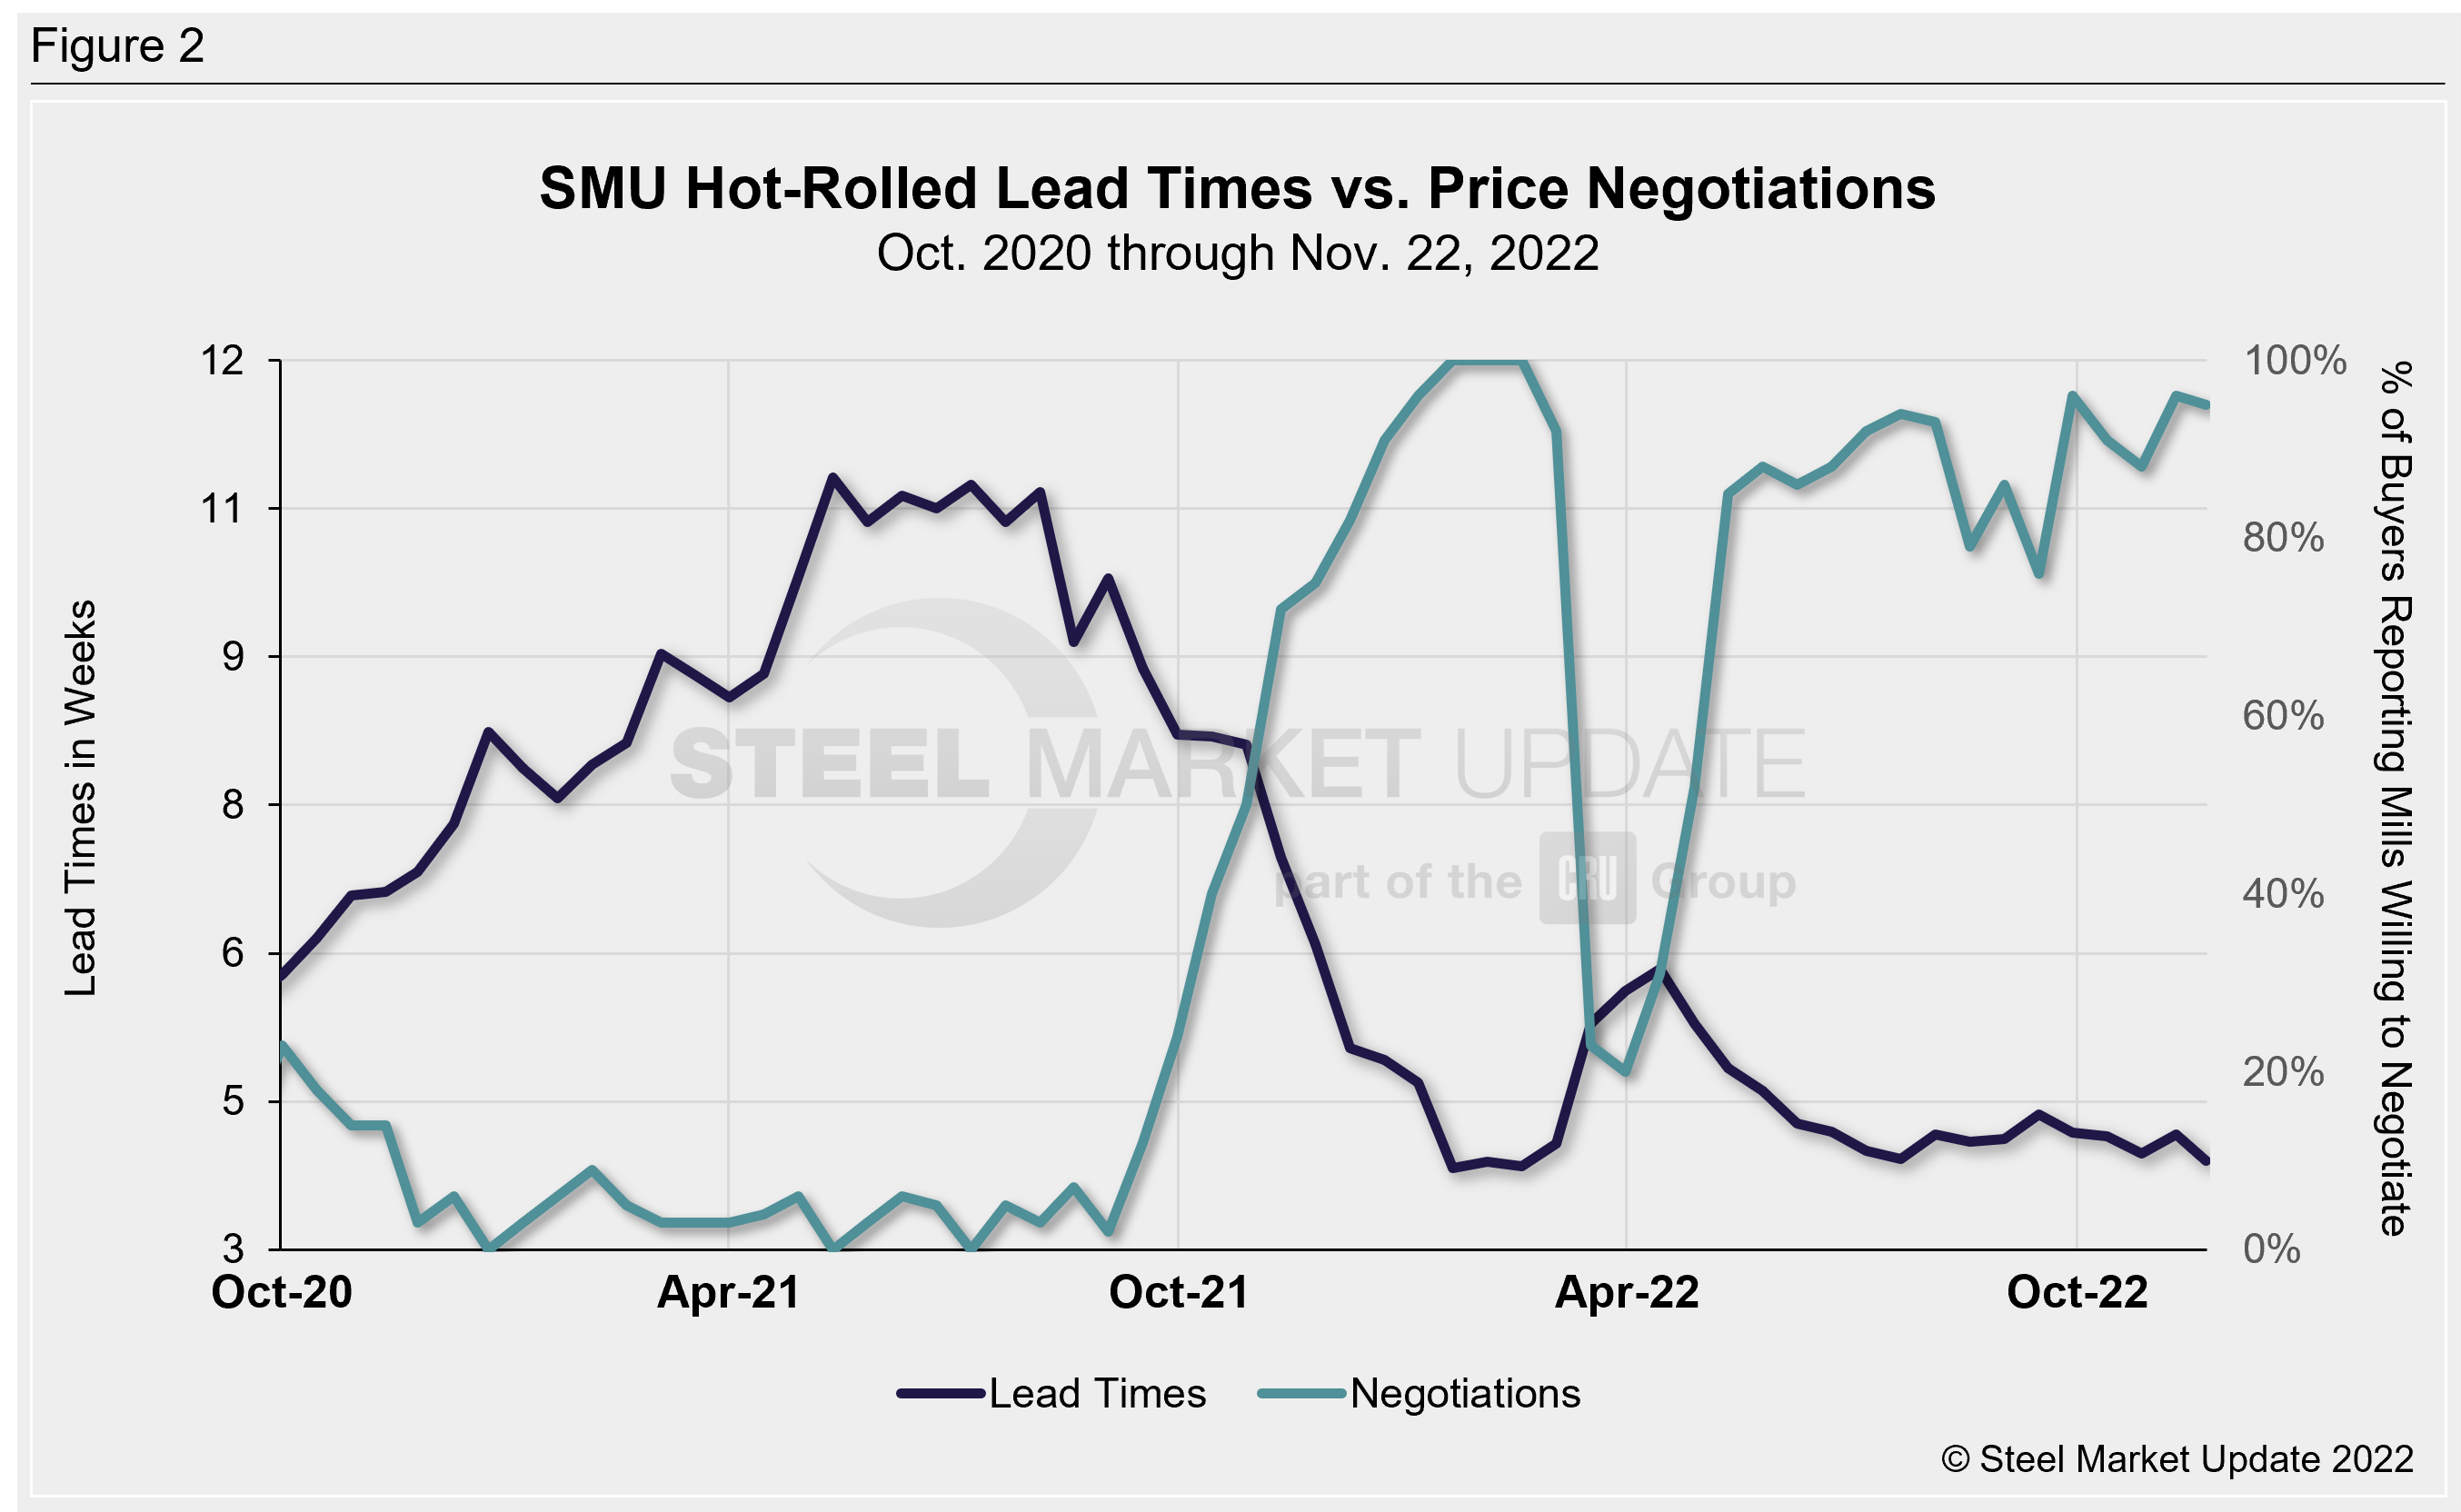
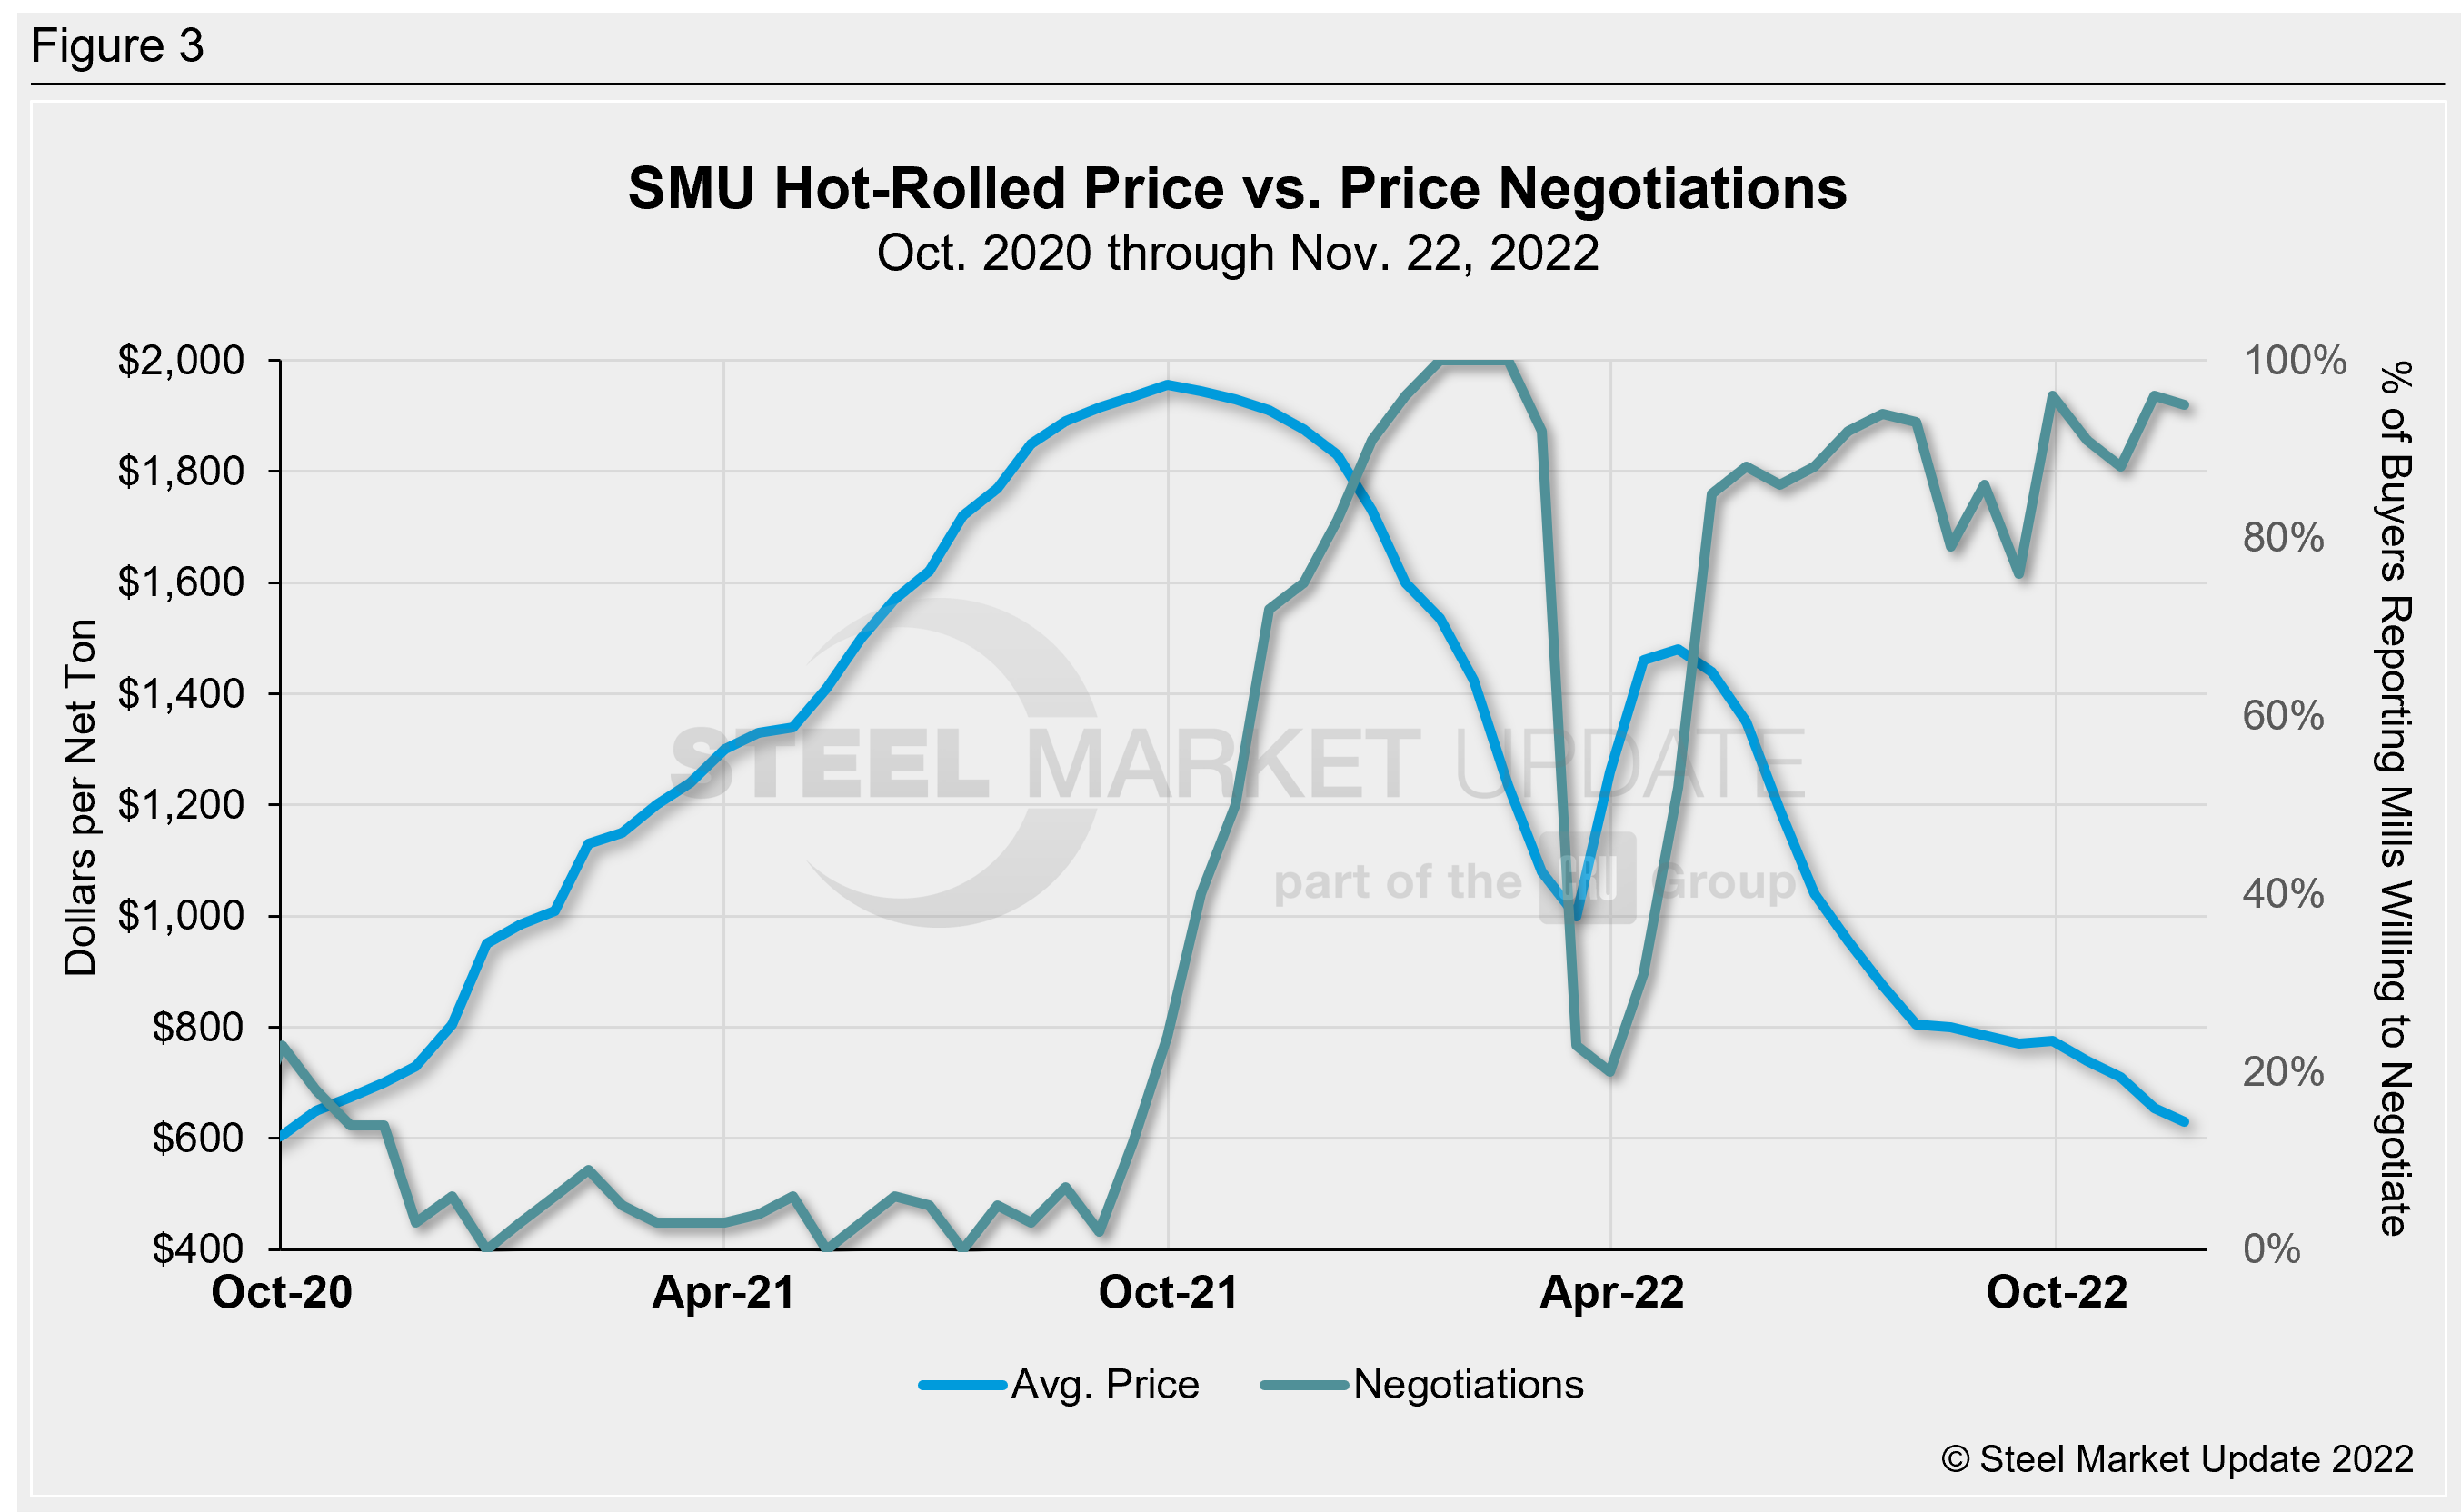
We will have to keep a close eye on this week’s survey results. But as of late November, buyers continue to hold the upper hand in price negotiations.
A very high percentage of sheet buyers were still reporting that mills are willing to talk price to secure an order, as they have since May. If buyers are still saying mills are willing to negotiate, how will prices find an upward lift? Mills will have to reverse this dynamic for the latest round of price hikes to hold.
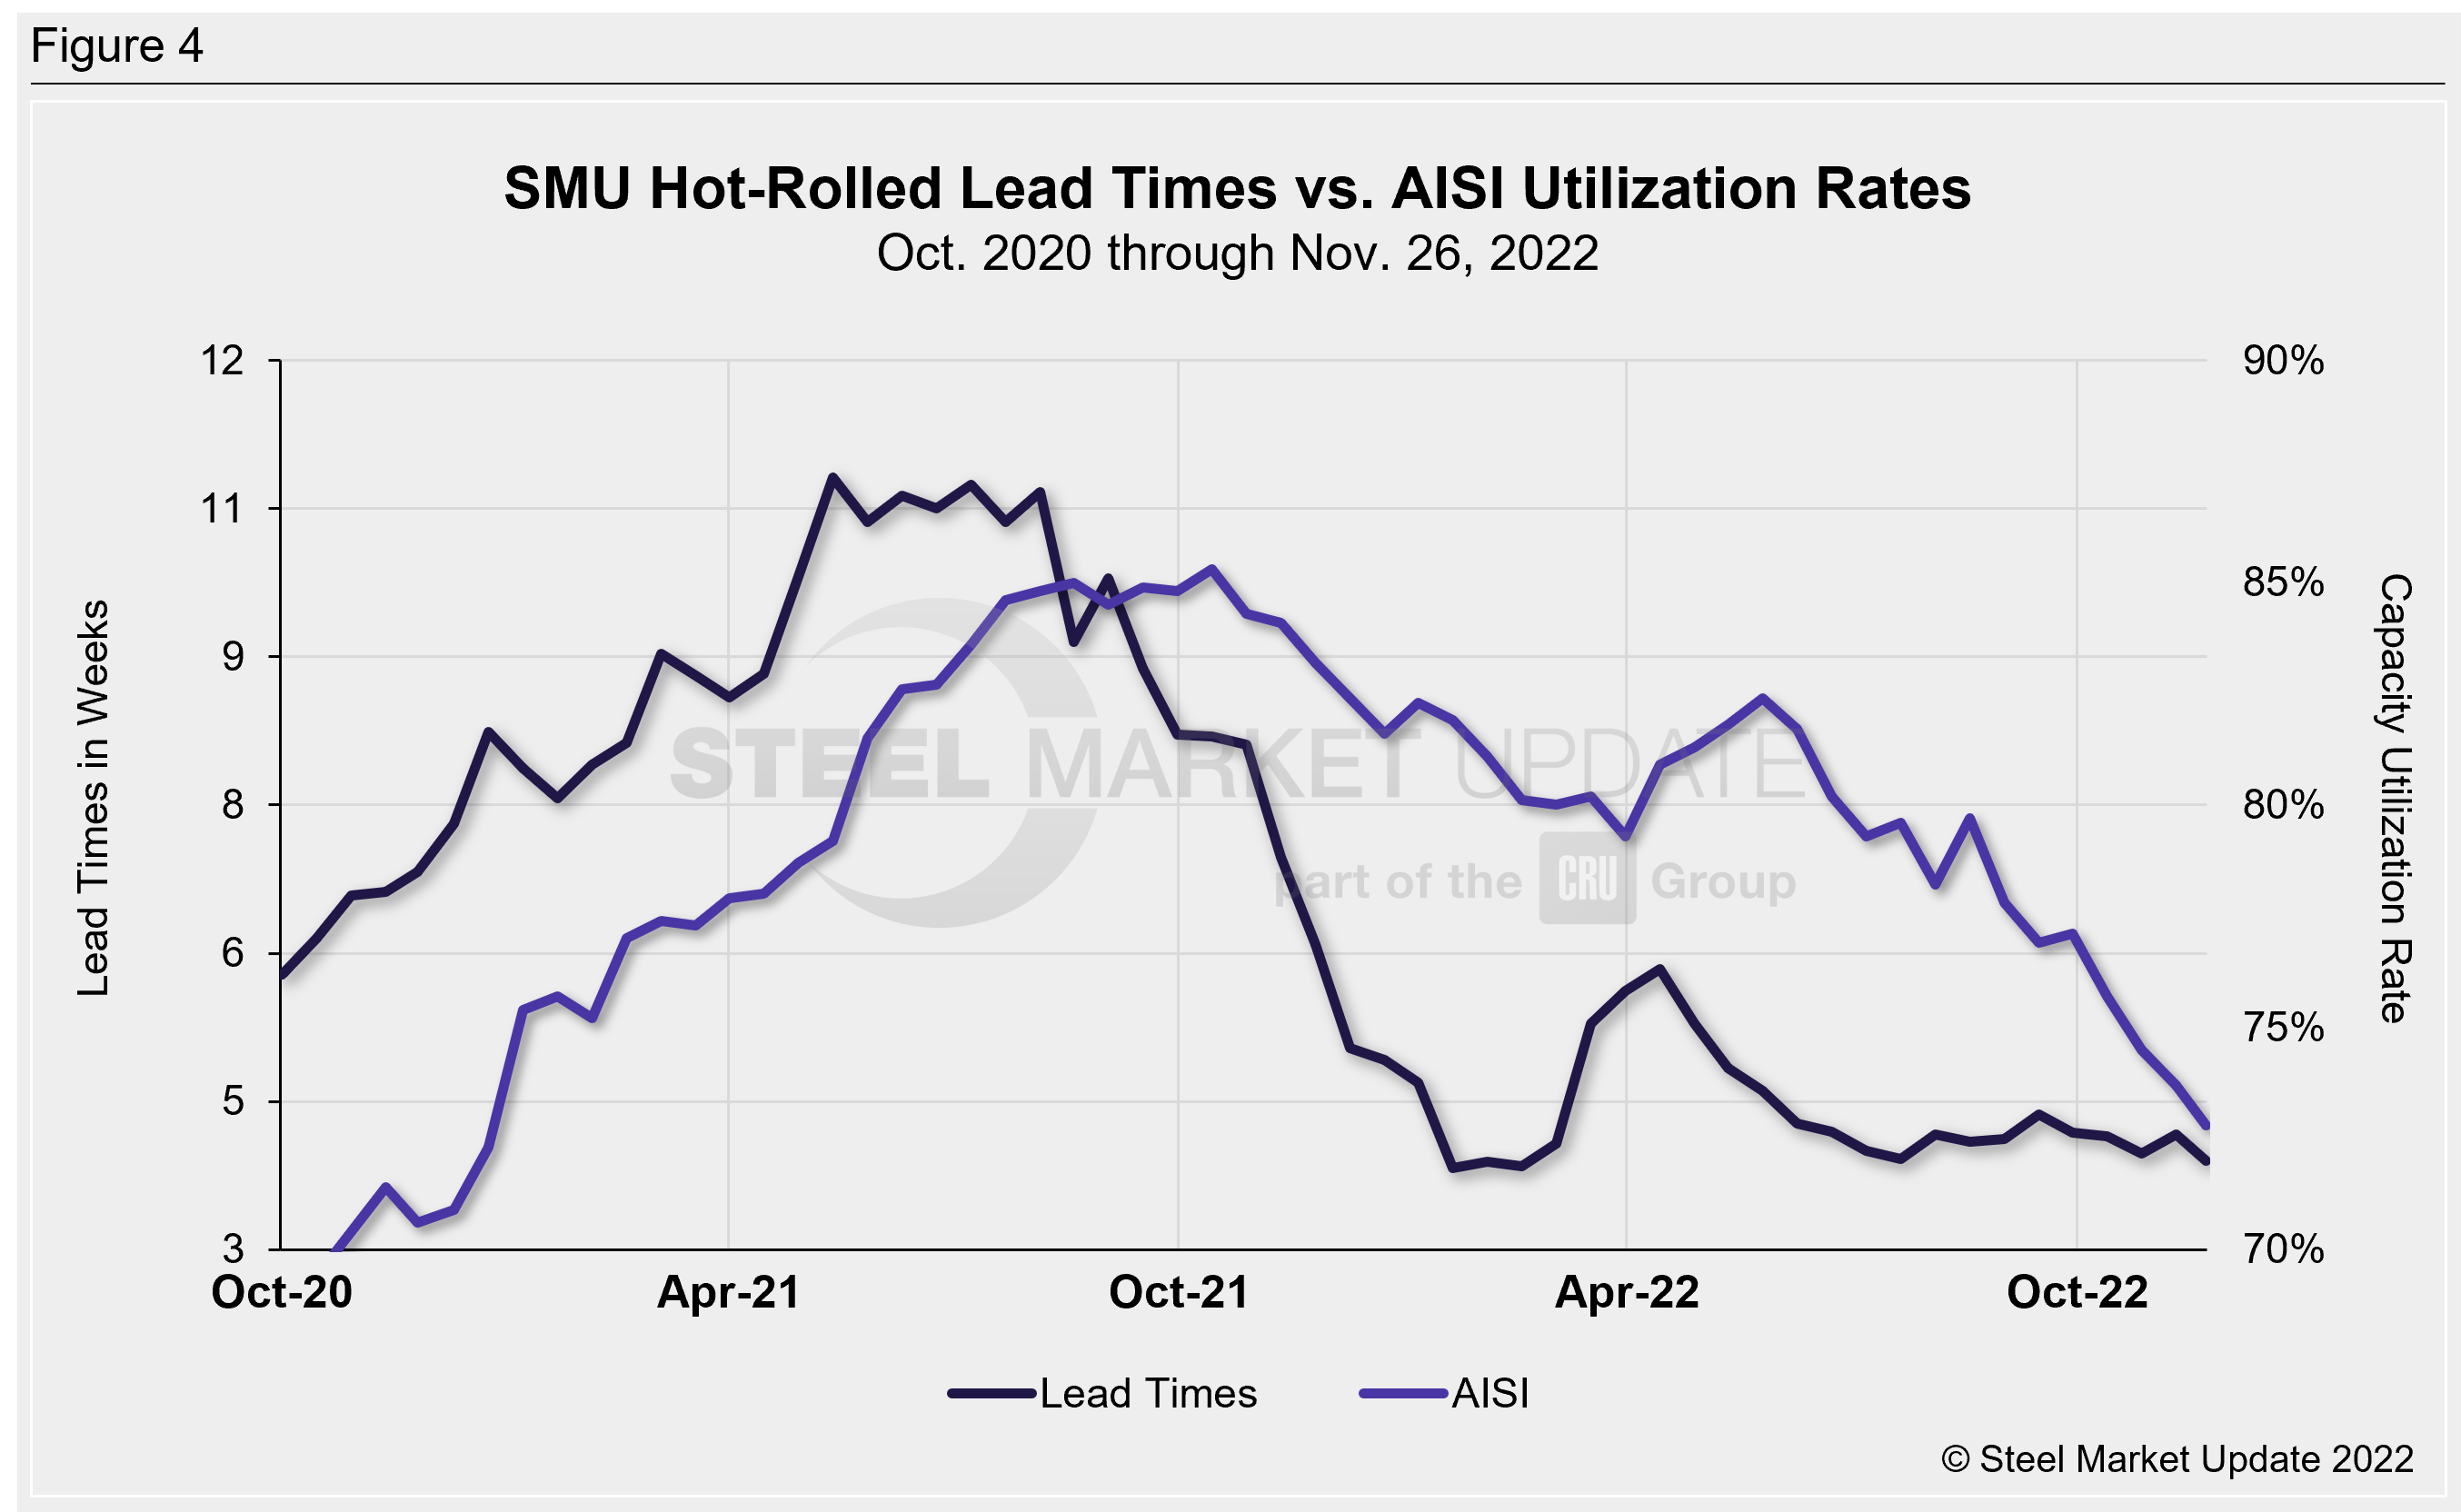
An imperfect measure but one worth looking at is the American Iron and Steel Institute’s (AISI) weekly raw steel capability utilization rates.
Raw steel production by US mills saw its lowest weekly output total all year during the week ended Nov. 26. At 1,625,000 net tons and utilization of 72.8%, both production and utilization are at their lowest levels since the week of Dec. 26, 2020.
And even though AISI’s data only covers roughly 50% of the domestic production capacity, the chart below (Figure 4) illustrates an interesting demand picture. While lead times have been largely stable – hovering right around four weeks on average – mill run rates have been tending down.
What’s to come concerning pricing is anyone’s guess. If mills remain willing to negotiate to book business, or if buyers stay largely on the sidelines, recent price hikes may not find the necessary support as the year comes to a close. But if buyers come back into the market, they might just stick.
The Tampa Steel Conference
We recently announced that US Steel’s chief commercial officer Kenneth Jaycox will be joining us for a fireside chat at Tampa Steel – a conference that SMU does every February together with the Port of Tampa Bay.
We’ll have senior mill executives from across North America as well as leading experts on everything from steel prices and logistics to energy and geopolitics.
Be a part of the conversation and the networking too. You can learn more about Tampa Steel and register here.
By David Schollaert, David@SteelMarketUpdate.com