

Distributors/Service Centers

December 7, 2022
CRU Economics: Our Top 10 Calls for 2023
Written by Alex Tuckett
In this Global Economic Outlook, we look ahead to 2023 and outline our top ten calls for the global economy. These include predictions on inflation, the war in Ukraine, electric vehicles and Covid-19 in China.
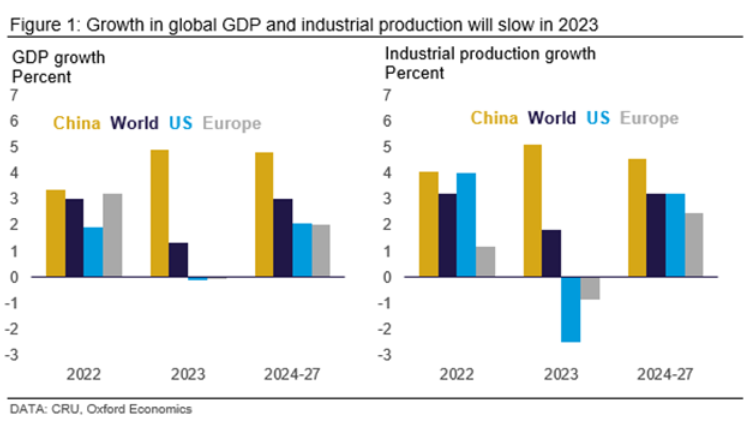
No. 1: Global Growth Will Slow From 2022
We expect both the US and Europe to experience recessions over the next year. Europe is grappling with an energy crisis and inflation remains high on both sides of the Atlantic. This will drive a sharp fall in world growth to 1.3% in 2023, from 3.0% in 2022. We expect growth in industrial production to decelerate to 1.8%, from 3.2% in 2022. However, we expect GDP growth in China to accelerate to 4.9% (from 3.4% in 2022) – although this is still well below average growth rates before the pandemic. Emerging markets will prove resilient, growing at 3.1%.
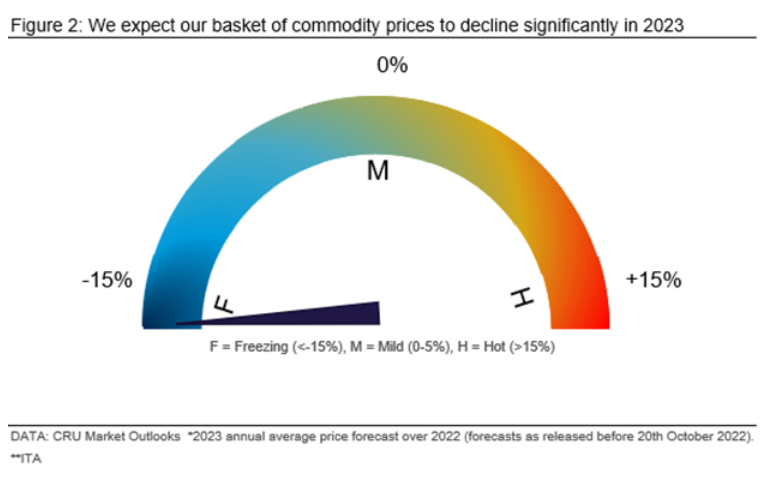
No. 2: CRU’s Basket of Commodity Prices Will Be Lower in 2023
Despite the supply shock created by Russia’s invasion of Ukraine, most commodity prices have declined from their peaks amid concerns of an impending global recession. Looking ahead, this downside trend is set to continue next year, except for energy commodities.
CRU’s basket of 38 mining, metals and fertilizer price forecasts is estimated to decline by 18.1% year-on-year (YoY) in 2023 (Figure 2). We expect demand to weaken globally due to the negative economic outlook, dragging on raw materials, fertilizer and metals prices. With high energy prices and weak demand, margins have already shrunk through 2022 and are likely to remain under pressure, with continued curtailments in fertilizers and energy-intensive metals sectors, particularly in Europe.
Looking further ahead, in the medium-term, demand from the ‘green energy transition’ will provide support for metals and raw material prices.
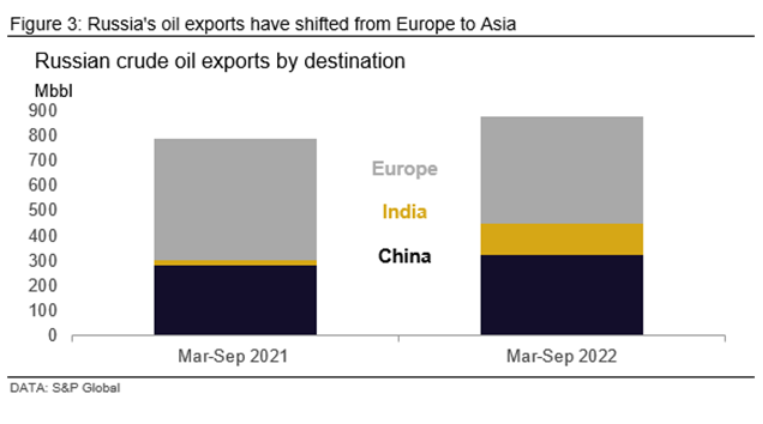
No. 3: There Will Be No Normalization of Trade Between Russia and the West
The war in Ukraine – and the accompanying sanctions – has caused major changes in trading patterns. The loss of Black Sea access has reduced flows of grain, fertilizers and steel. Russian oil exports have diverted from Europe to India and China (Figure 3). Most seriously, in an effort to apply pressure on Europe, Russia has reduced flows of natural gas to a fraction of their pre-war levels.
The path of the war from here is unclear. Our central case is that the conflict drags on for some time. Even if there were to be a quick end to the fighting, most sanctions would probably remain in place to maintain pressure. Some of the risk premia would fall out of energy prices, but Europe’s drive to pivot away from Russia as a supplier – and Russia’s drive to pivot to customers in Asia – would continue.
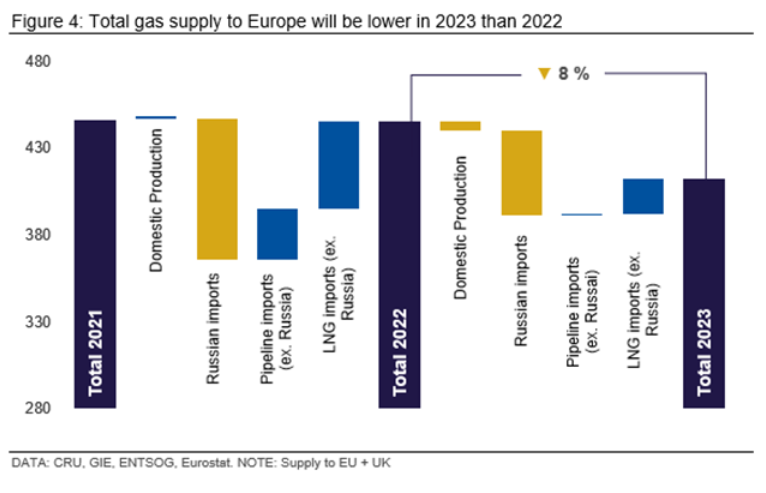
No. 4: European Gas Prices Will Average €150/Mwh, x11 2019 Levels
This autumn the TTF European gas benchmark price slid dramatically from its August peaks, pushed down by robust EU gas storage levels. This has reduced some of the pressure on economies in Europe and led some commentators to argue that the end of the energy crisis is in sight. We think this is premature, however, and believe there is a high chance of prices moving above current levels and remaining volatile.
Inventories will have dropped significantly by March. These inventories will need to be rebuilt ahead of winter 2023/24. Without Russian pipeline gas, this will be very difficult. Figure 4 shows how big the challenge will be (see our recent insight for more detail).
In this environment we expect gas prices to average €150/MWh, much lower than August’s high of €338/MWh, but around 11 times higher than the average 2019 price. Volatility is also likely to be much higher than in the pre-war environment.
More of Europe’s gas supplies will come from LNG, which is more likely to be sold in the spot market instead of through long-term contracts. Although the European Commission is proposing to cap the wholesale price at €275/MWh, this would only have an effect in the most extreme circumstances and has anyway still not been agreed upon by all member states.
European industry has cut its consumption of gas considerably, with widespread curtailments of capacity in energy- or gas-intensive sectors such as fertilizers or aluminum. If high and volatile prices persist, many of these curtailments are likely to become permanent.
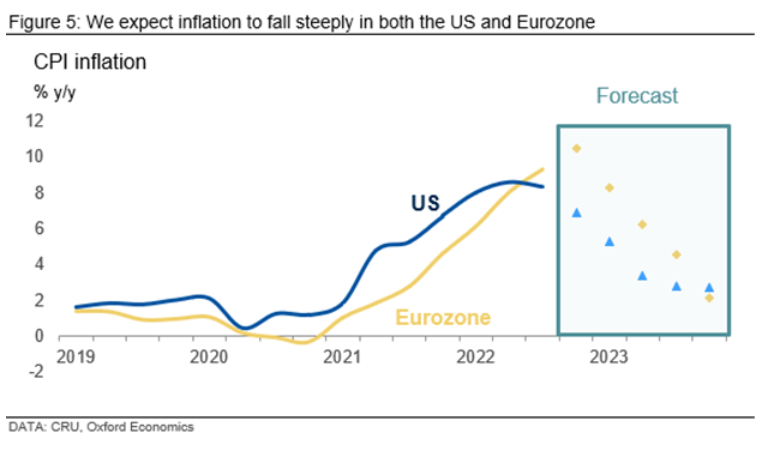
No. 5: Inflation Will Fall Quickly in Both the US and Europe
The energy crisis, supply chain problems and tight labor markets have led to inflation levels unprecedented in recent US and Eurozone history (Figure 5). In October 2022, CPI inflation was at 10.6% YoY in the Eurozone and 7.7% in the US. High inflation will remain a pressing concern in 2023. However, as central banks continue to tighten monetary policy in their fight against inflation and pressure from high energy prices eases, especially in Europe, we forecast inflation to fall sharply.
We expect inflation in the Eurozone to remain higher than in the US during most of 2023, undershooting it in the final quarter of 2023. Major risks remain, including a renewed European energy crisis in winter 23/24, a wage-price spiral in either the US or Europe, and further global supply-chain disruptions (for example from the rapidly deteriorating Covid situation in China) that could all trigger a new round of inflation. For now, however, recent data releases for producer and consumer prices, as well as evidence from business surveys, points to inflation reaching a turning point.
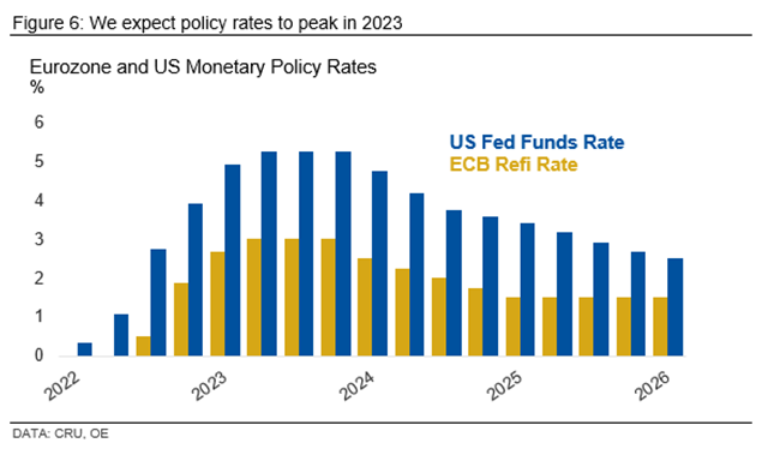
No. 6: Monetary Policy Will Remain Tight in Western Economies
2022 has seen sharp increases in interest rates as central banks respond to high inflation. The Fed has increased rates by 375 bp since March. The ECB, initially slow to react, has also increased rates by 200 bp this year. So far, this has had limited impact on inflation; partly because monetary policy can do nothing to solve supply-side factors like high energy prices, but also because it takes time for the demand side of the economy to be affected by higher interest rates. However, the effect of higher rates is now becoming visible in the US, particularly in the housing market.
Both central banks have signaled their commitment to tackling inflation, even if this means pushing the economy into recession, and so we expect further rate increases over the next few months, bringing policy rates to 5.25% in the US and 3% in the Eurozone (Figure 6).
Despite recessions in both economies next year, we expect policy to remain tight until inflation has fallen closer to target. In our central case, this will happen, helped by stabilizing energy prices and loosening labor markets. However, if upside risks to inflation emerge, policy rates could go even higher, putting more pressure on interest-sensitive expenditures such as construction and auto purchases.
No. 7: China Will Move Away from Zero-Covid Policy, But Only Gradually and Non-Linearly
China’s zero-Covid policy will last well into 2023 and potentially beyond. We expect the loosening of pandemic controls will be gradual, depending on whether Chinese authorities consider current and future variants to be less lethal. Even then, local authorities will only slowly relax many existing containment measures in a ‘two steps forward, one step back’ manner (left-hand side of Figure 7).
This non-linear easing will be required to prevent rising caseloads from overwhelming the medical system, particularly in localities with limited access to medical resources. Despite easing quarantine regulations, short-term and compound-specific lockdowns will remain a common occurrence, with millions of people often under restrictions at any given time (right-hand side of Figure 7).
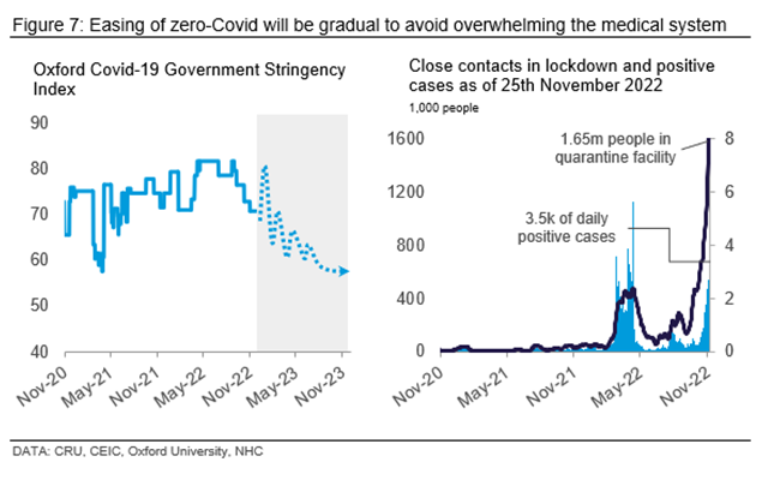
Meanwhile, the government will need to stockpile antiviral therapeutics and expand ICU capacity. In addition, the central government will need to prioritize medical resources for vulnerable groups and severe cases.
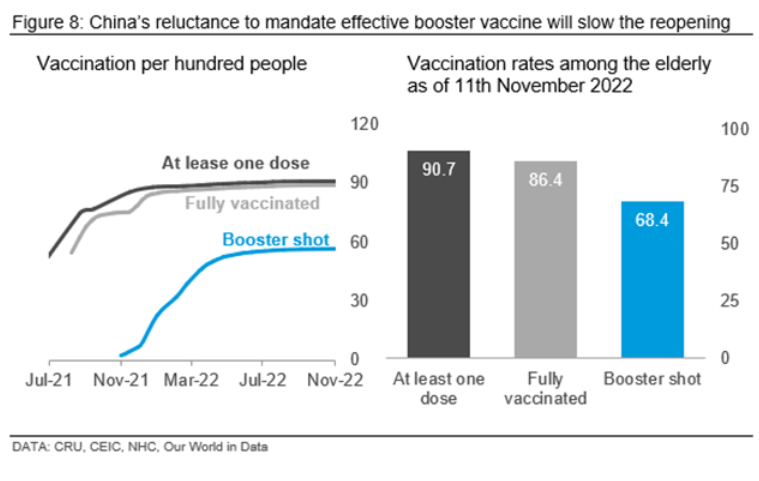
One of the milestones in reopening is to roll out Covid-19 booster shots, particularly to vulnerable people. As of mid-November, 68% of Chinese older than 60 have received a booster shot (Figure 8). Key policy shifts could be revealed at a forthcoming Politburo meeting or at the Central Economic Work Conference in December, but meaningful change may not materialize until 2023 and local coordination on a unified reopening will take longer.
The recent chaos with local authorities struggling to interpret guidance from the central government will only add to the emphasis on caution. However, the political protests indicate the pressure for there to be a policy shift in the long term.
No. 8: The Chinese Property Sector Will Have a Soft Landing, But Will Not Return to Rapid Growth
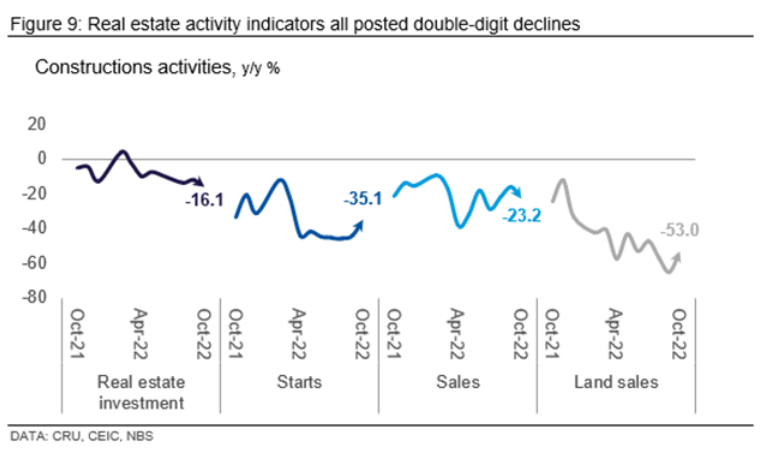
Prices for existing residential property in China fell by more than 10% year-to-date, while activity indicators including real estate investment, new starts, property sales, and land sales all posted double‑digit declines (Figure 9).
Tightened regulations have deprived China’s highly leveraged developers of financing, leading to defaults, restructurings and widespread project suspensions. The plight was exacerbated by an escalation of Covid‑19 outbreaks, which further suppressed transactions and construction.
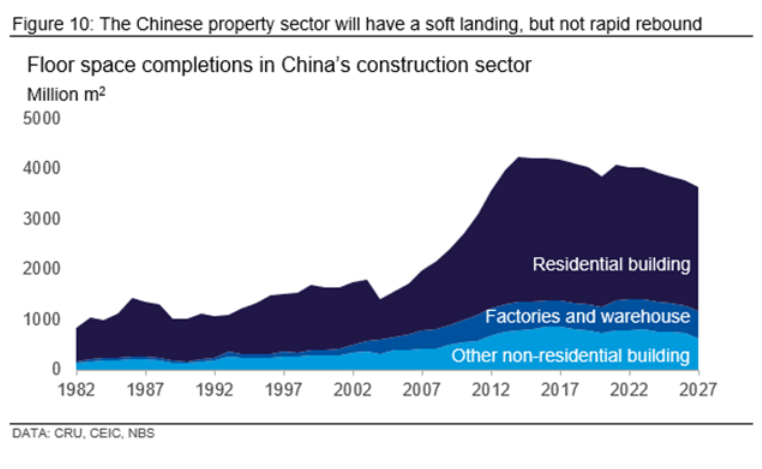
We expect the sector to stabilize in 2023, but a substantial recovery – in terms of both floor-space and price – will be difficult. The authorities will stick to a supportive approach in 2023 through monetary loosening and relaxing transaction restrictions.
A solid level of household savings may also work in favor of the housing market once sentiment improves. Prices could even rise in some large cities, where depressed construction leads to supply tightness. However, a major impediment will be the persistence of “zero-Covid” measures, which we forecast will still prevail in H1 2023. The reaffirmed determination to restrict speculation will minimize the possibility of another nationwide boom in the housing market in the long term (Figure 10).
No. 9: NEVs Will Increase Their Market Share to 18%, Led by China
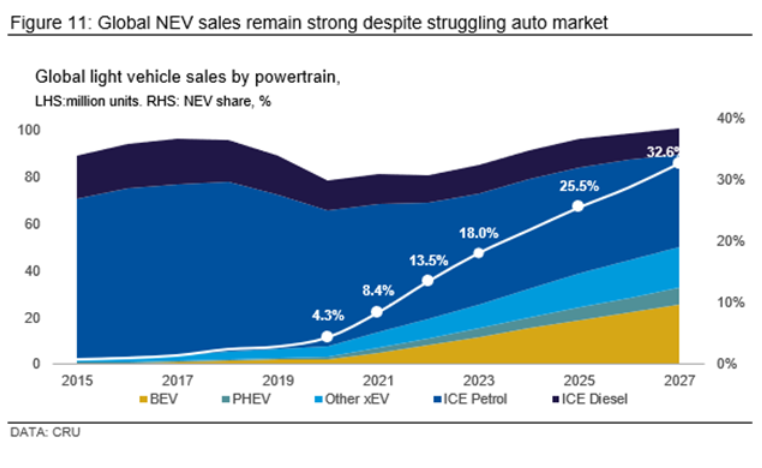
Global sales of New Energy Vehicles (NEV – comprising full battery (BEV) and plug-in hybrid (PHEV) vehicles) doubled in 2021 to represent over 8% of the car market. This year, we expect NEV sales to reach another all-time high, accounting for nearly 14% of total light vehicle sales globally.
Despite the looming dark clouds ahead of the global auto market amid the Ukraine war, inflation and deteriorating macroeconomic conditions, we have already seen strong NEV sales across key markets. Considering the performance in NEV sales across China, Europe, and the US so far this year, and given new policy support in the US and China, we are confident NEV sales are on course to hit the projected share (14%) globally this year and will reach another high in 2023 (18%).
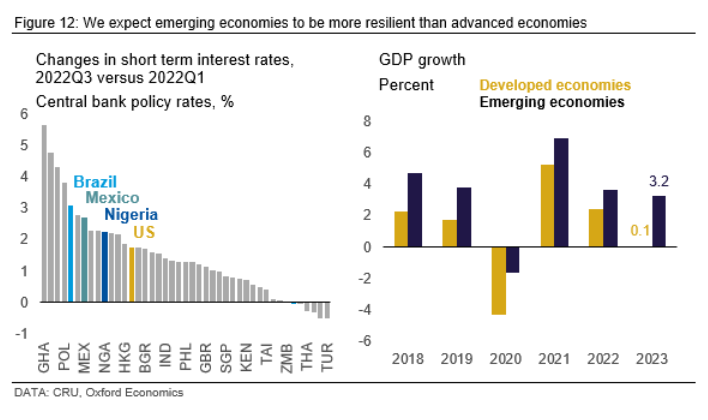
No. 10: Emerging Markets Will Slow, But Still Outpace Advanced Economies
The environment of 2022 has been tough for emerging markets. Higher interest rates, a surging US dollar, and rising energy and food prices would normally be a dangerous cocktail. However, emerging markets have proved to be impressively resilient.
Emerging markets entered this crisis with much stronger balance sheets than in the past, with high levels of foreign exchange reserves, particularly in South East Asia. Monetary policy has responded quickly to higher inflation – in many cases faster than in advanced economies (Figure 12, left-hand side).
A tighter policy will come at some cost. We expect growth to slow to 3.1% next year, below the ten-year average of 4.2%. However, this will be a much more gradual slowdown than for developed economies, which we expect to barely grow in 2023 (Figure 12, right-hand side).
This article was originally published on Nov. 30 by CRU, SMU’s parent company.
By CRU Principal Economist Alex Tuckett, Senior China Economist Henry Hao, End Use Economist Arthur Wang, and Economist Veronika Akhmadieva from CRU’s Global Economic Outlook
Request more information about this topic.
Learn more about CRU’s services at www.crugroup.com


