Mexico

December 14, 2022
US Light Vehicle Sales Decelerate in November
Written by David Schollaert
US light-vehicle (LV) sales decelerated in November, coming in at an unadjusted figure of 1.12 million units, the US Bureau of Economic Analysis (BEA) reported. Despite the month-on-month (MoM) decline, last month’s total was still 10.4% higher year-on-year (YoY), and the fourth consecutive month to see YoY increases in sales. Prior to August, YoY sales gains had not been seen since July 2021.
LV sales were down 6.5% MoM in November, slipping to an annualized 14.1 million units. This was well below the consensus forecast, which called for a more modest pullback to 14.6 million.
After rising to a nine-month high in October, vehicle sales recorded their largest monthly decline since May. Last month’s pullback, however, wasn’t totally unexpected, as October’s gain was said to be boosted by increased deliveries that were delayed over the summer due to supply-chain issues, and the need to replace vehicles damaged because of Hurricane Ian.
Declines were primarily concentrated in the light-truck segment (-7.6% MoM), while passenger vehicles (-1.9% MoM) saw a more modest decline. Light trucks accounted for 79% of last month’s sales, down 0.8 percentage points from November 2021.
Other factors likely to weigh on sales are elevated prices and higher financing costs that will price out potential buyers.
Even after accounting for the pullback in November sales, fourth-quarter consumer spending is still tracking around 3% annualized, according to the latest data. Latest forecasts indicated that this above-trend pace of spending is unlikely to be sustained. A meaningful deceleration in spending activity is expected over the coming quarters as the cumulative effect of higher interest rates starts to ripple through the economy.
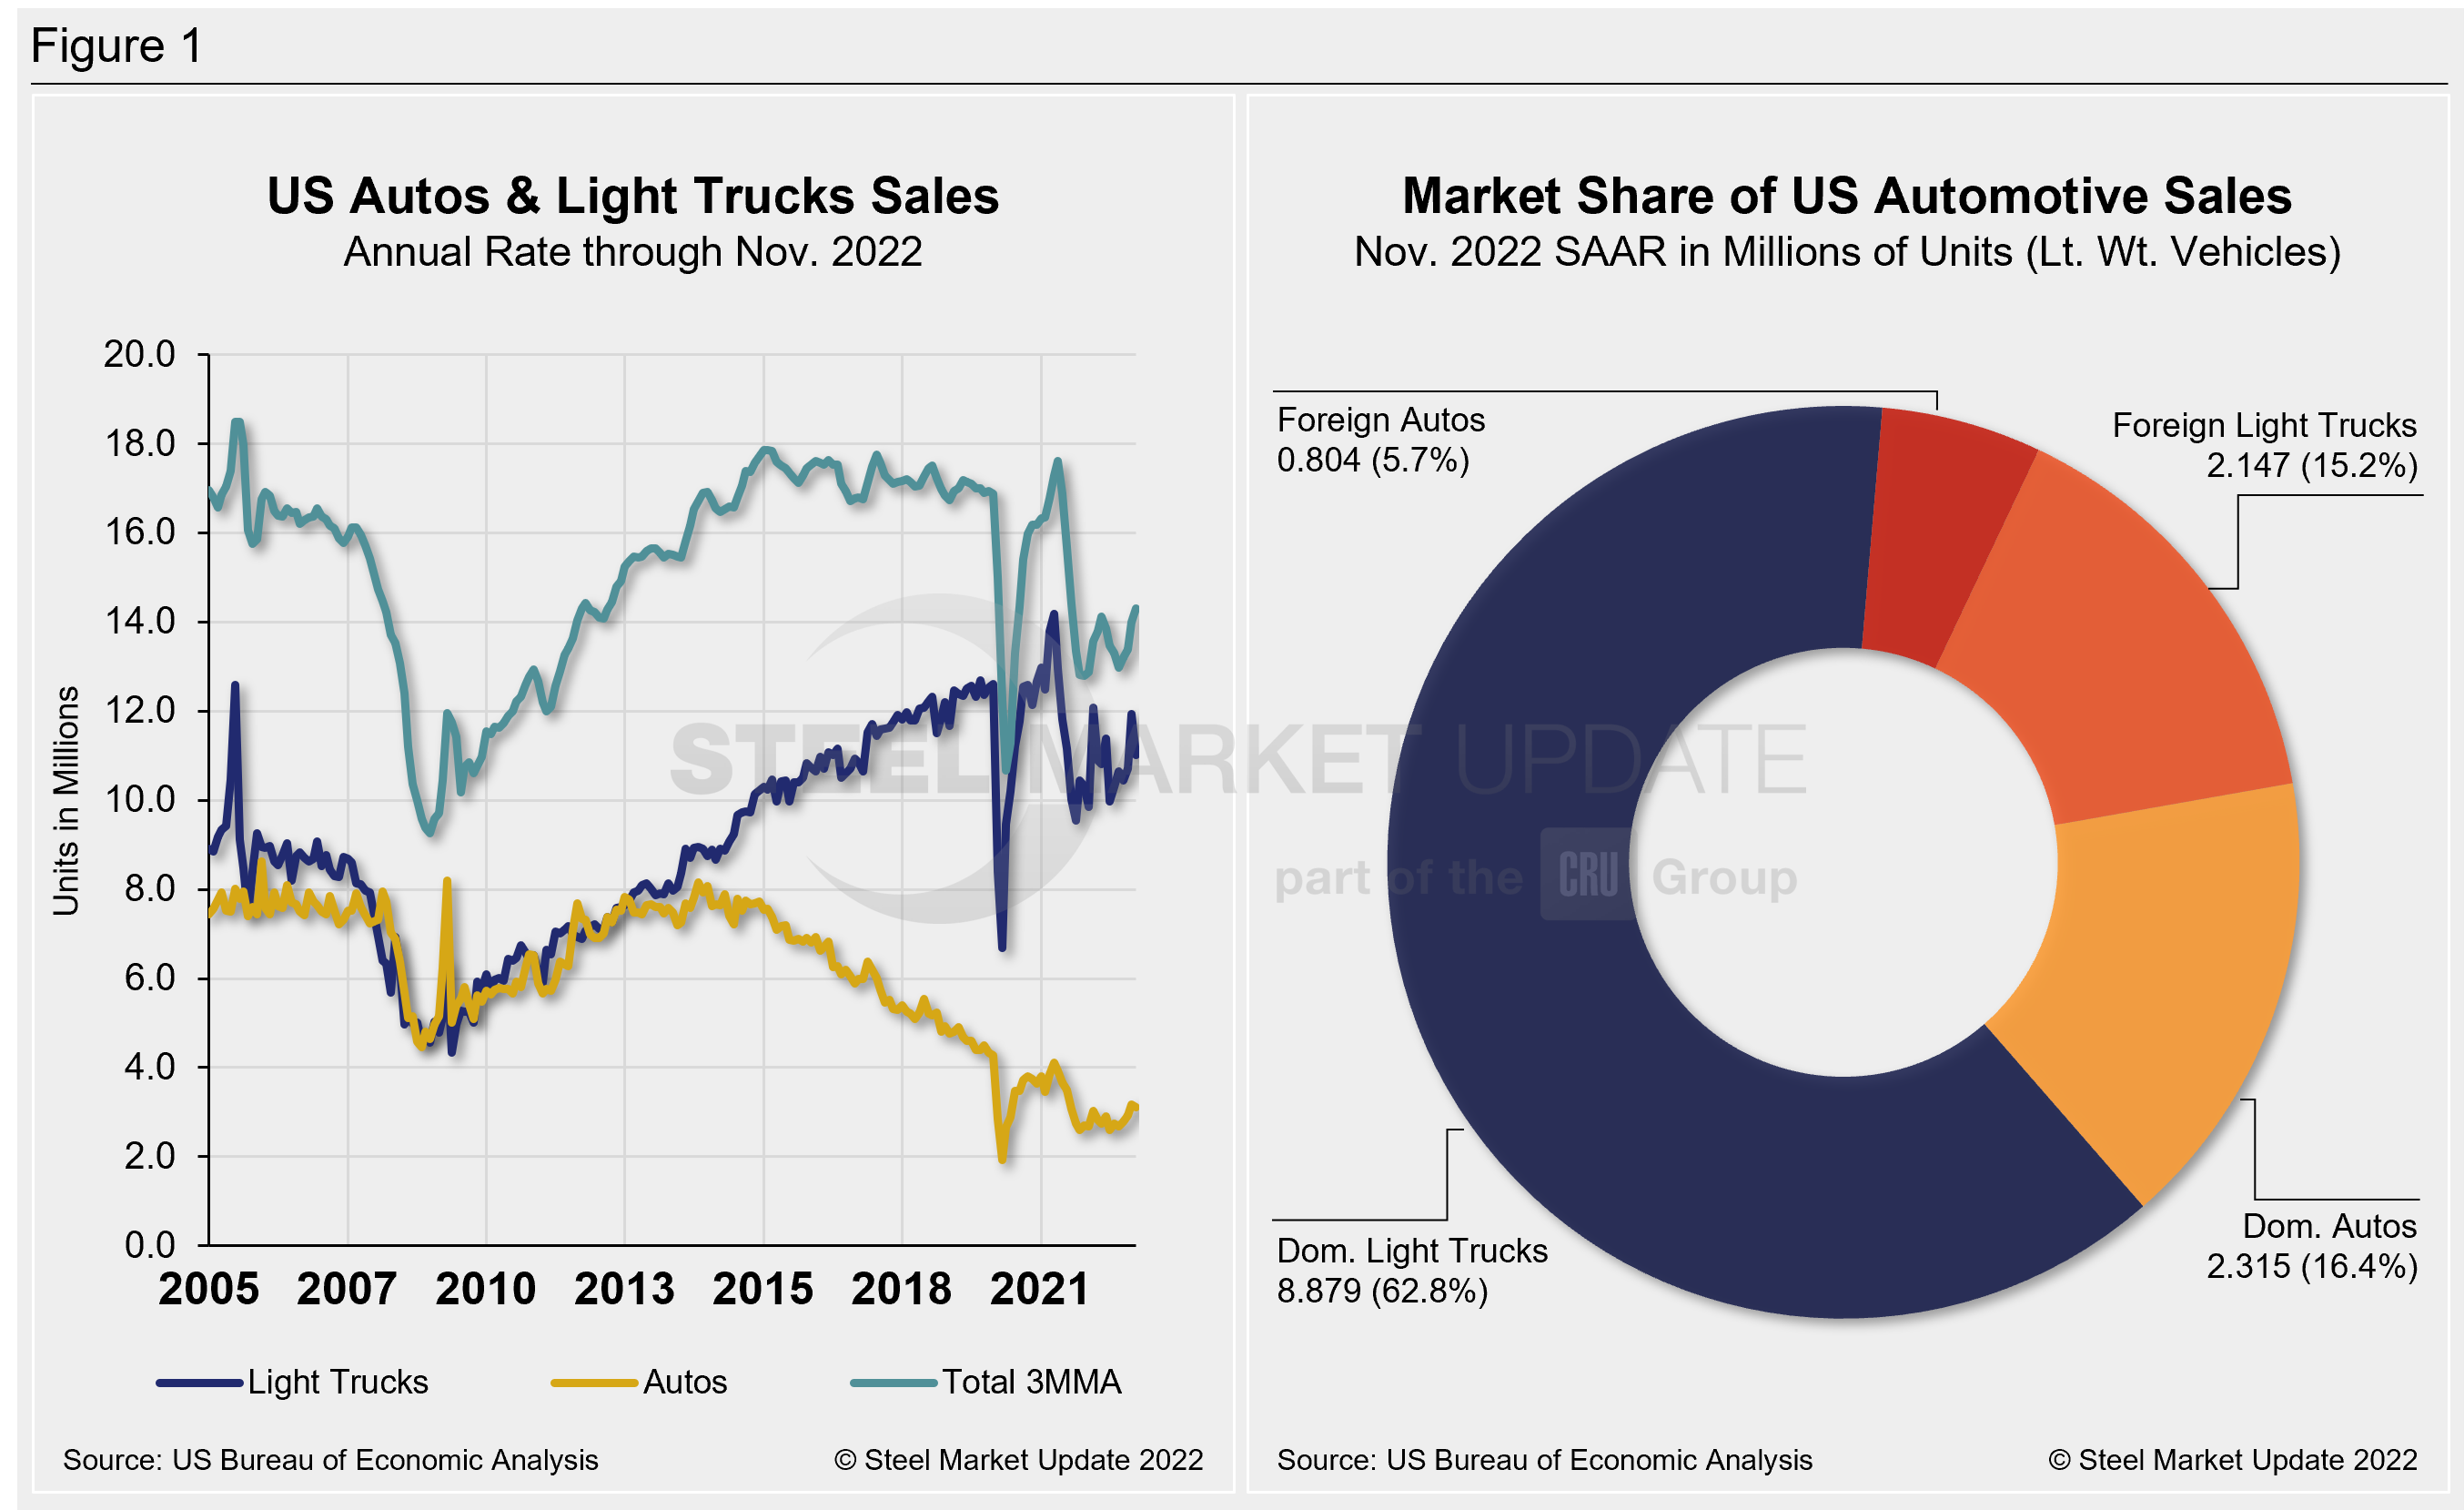
Below in Figure 1 is the long-term picture of sales of autos and lightweight trucks in the US from 2005 through October 2022, as well as the market share sales breakdown of October’s 14.9 million vehicles at a seasonally adjusted annual rate.
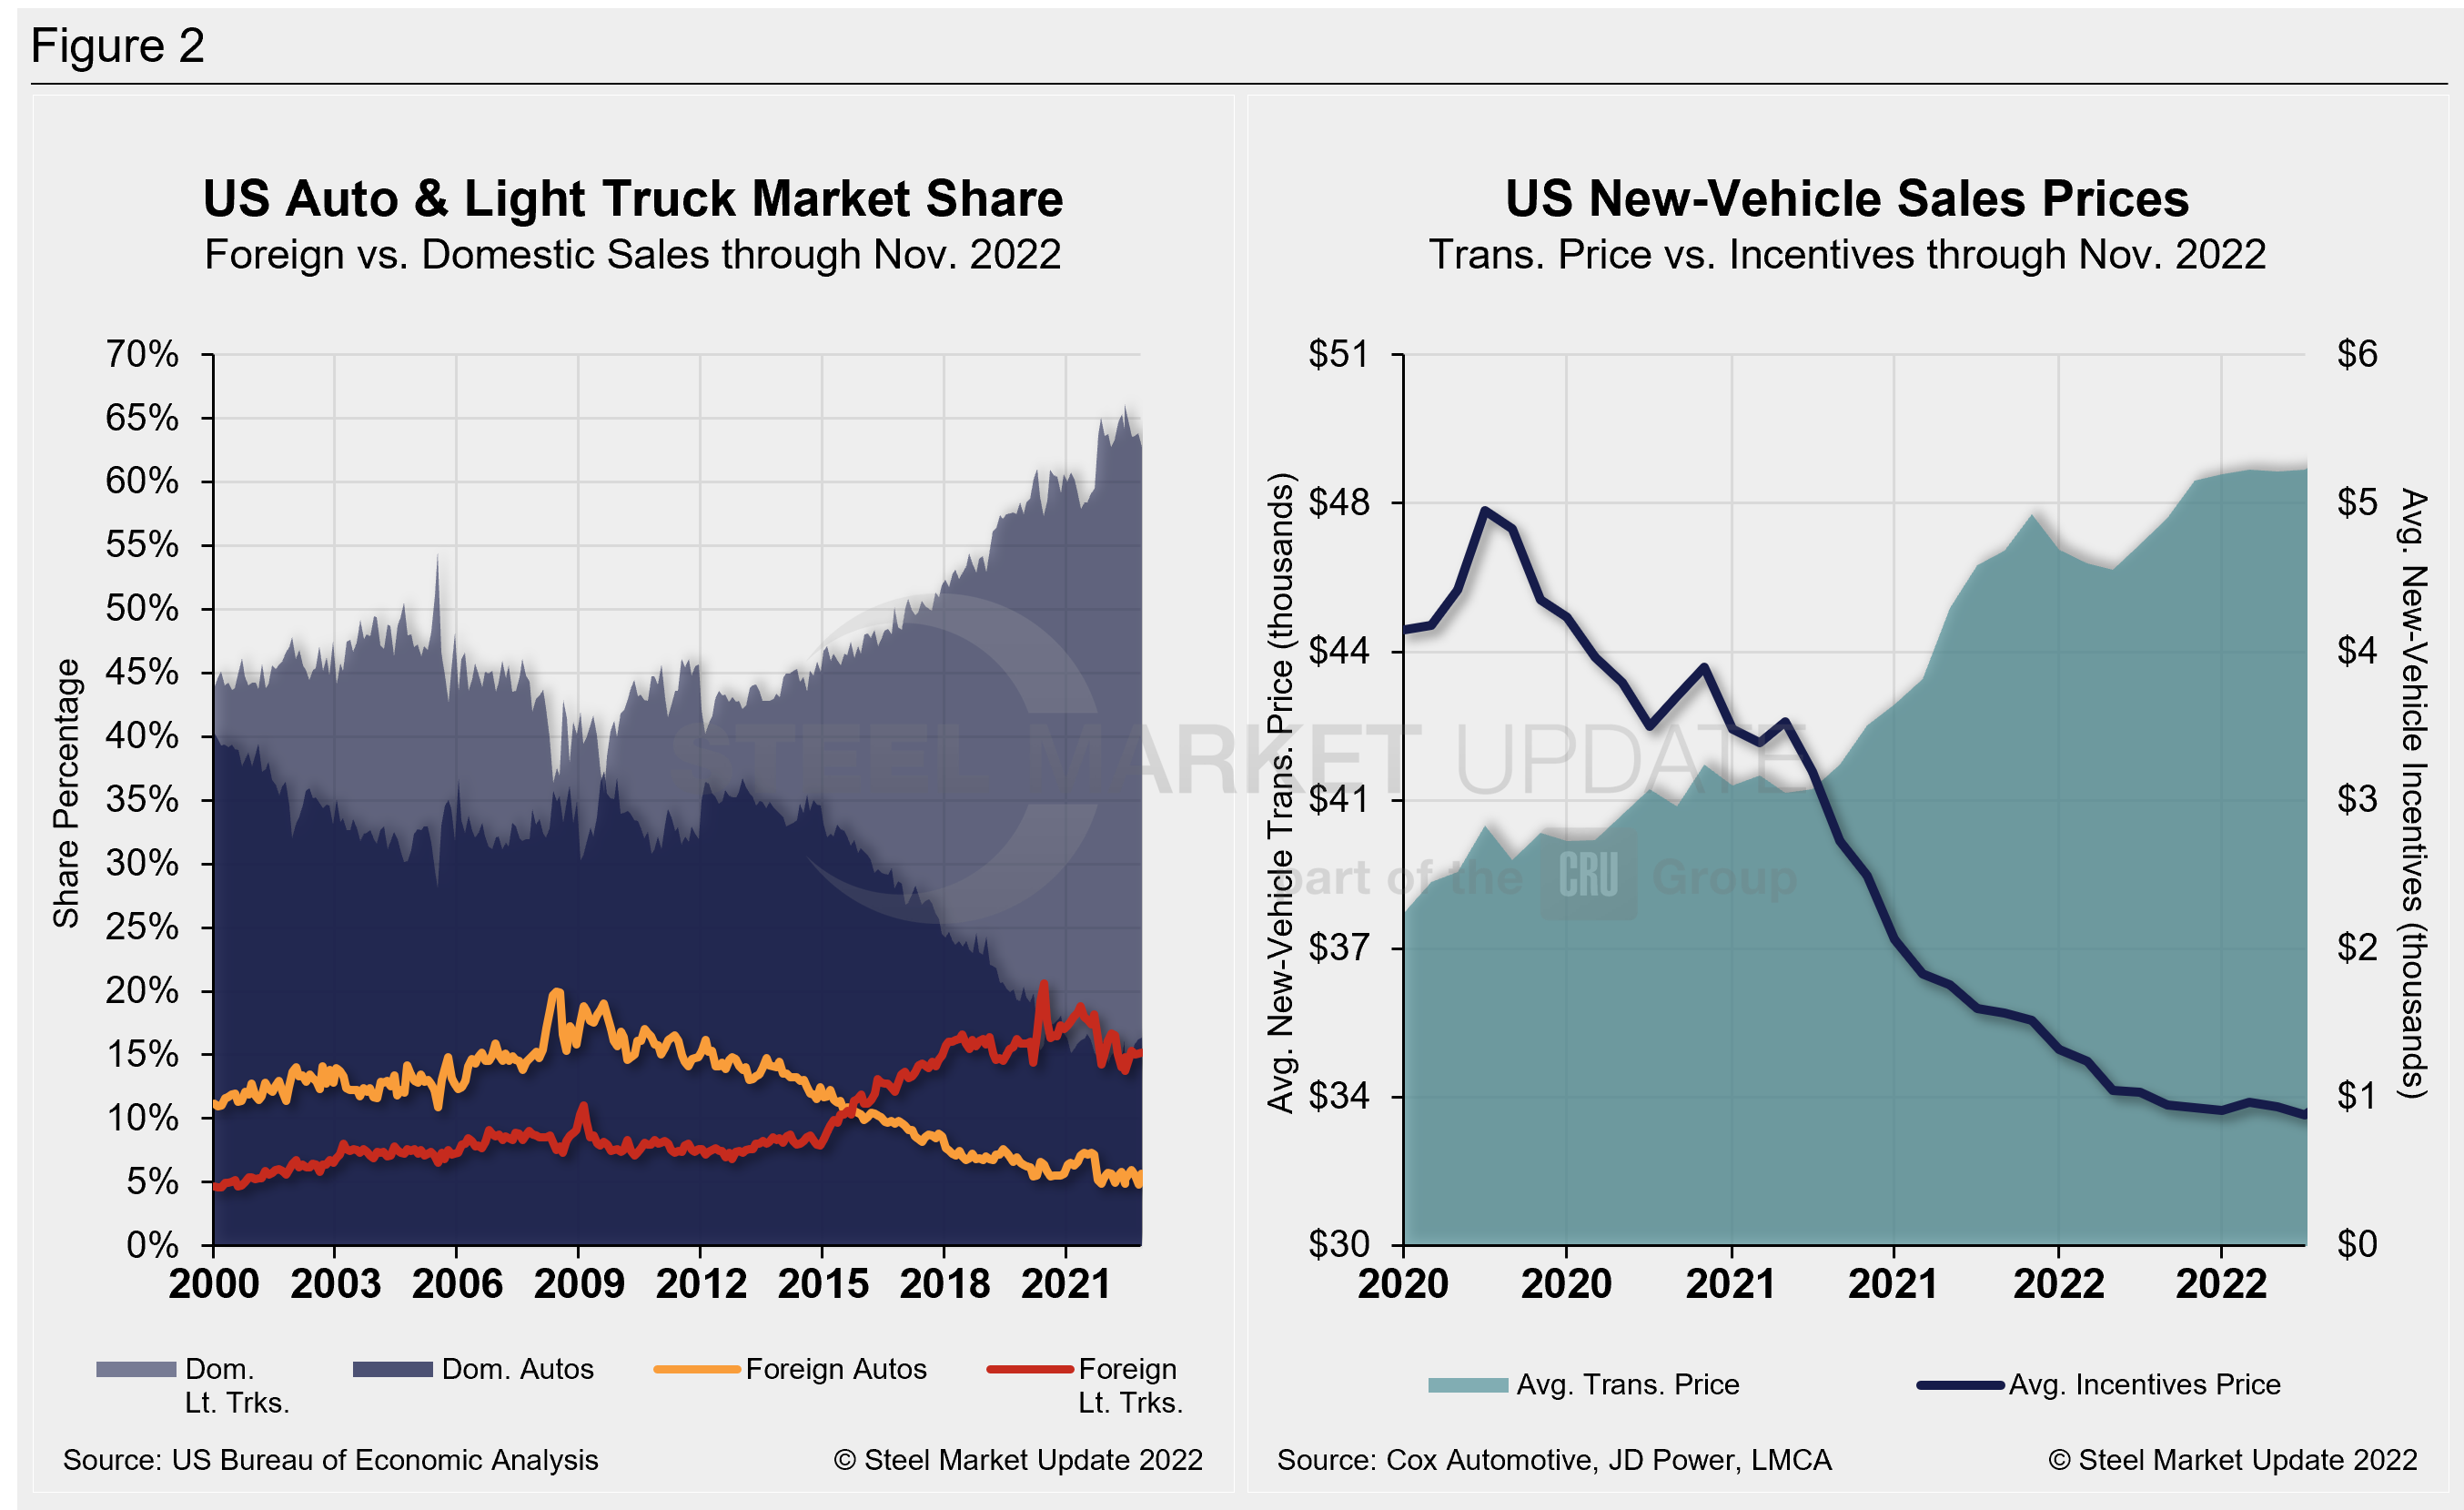
The new-vehicle average transaction price (ATP) was $48,681 in November, up from $48,281 in October and setting a new all-time high. ATPs were 0.8% higher (+$41) in November vs. the prior month and 4.9% (+$2,292) above the year-ago period, according to Cox Automotive data.
Incentives increased slightly to $1,009 in November, rebounding from $882 in October, the lowest total on record. With the MoM recovery, incentives were back above the $1,000 mark for the first time in seven months and roughly 2% of the average transaction price. Incentives are down 35.5%, or $555 YoY.
In November, the annualized selling rate of light trucks was 11.026 million units, down 7.7% vs. the prior month but still 6.7% better YoY. Auto annualized selling rates saw similar dynamics over the same periods: down 1.8% but up 15.3%, respectively.
Figure 2 details the US auto and light-truck market share since 2010 and the divergence between average transaction prices and incentives in the US market since 2020.
Editor’s Note: This report is based on data from the US Bureau of Economic Analysis (BEA), LMC Automotive, JD Power, and Cox Automotive for automotive sales in the US, Canada, and Mexico. Specifically, the report describes light vehicle sales in the US.
By David Schollaert, David@SteelMarketUpdate.com