Market Segment
February 22, 2023
North American Auto Assemblies Recover in January
Written by David Schollaert
North American auto assemblies rose 16.1% in January, recovering for the first time in three months. Last month’s assembly output was among one of the highest in nearly two years and 13.8% higher year on year (YoY), according to LMC Automotive data.
On the supply side, inventory levels are expected to gradually improve this year as easing supply constraints alleviate production bottlenecks. This should help to satiate some of the pent-up demand in the market. However, higher interest rates, a slowing labor market, and an existing inventory mix that skews towards higher price models will prevent a full return to pre-pandemic sales levels this year.
January topped the 1.2-million-unit mark for the first time since October. And while inventories have improved, the market remains supply-constrained, working itself out of the deficit levied by parts and supply shortages.
Inventory levels are expected to gradually improve this year as easing supply constraints alleviate production bottlenecks. This should help to satiate some of the pent-up demand, yet higher interest rates, a slowing labor market, and an existing inventory mix that skews towards higher price models will remain a barrier to the recovery.
The impact of the global semiconductor crisis on the North American automotive market was extensive, at times crippling. The onset of the pandemic certainly slowed auto assemblies, but the chip shortage levied debilitating blows.
Though at times slow, the recovery has been notable, especially since the second half of 2022. However, the production slowdown throughout the fourth quarter of 2022 emphasizes there is still ground to be made up. When compared to the last “normal” year in 2019, production is still 12.1% behind.
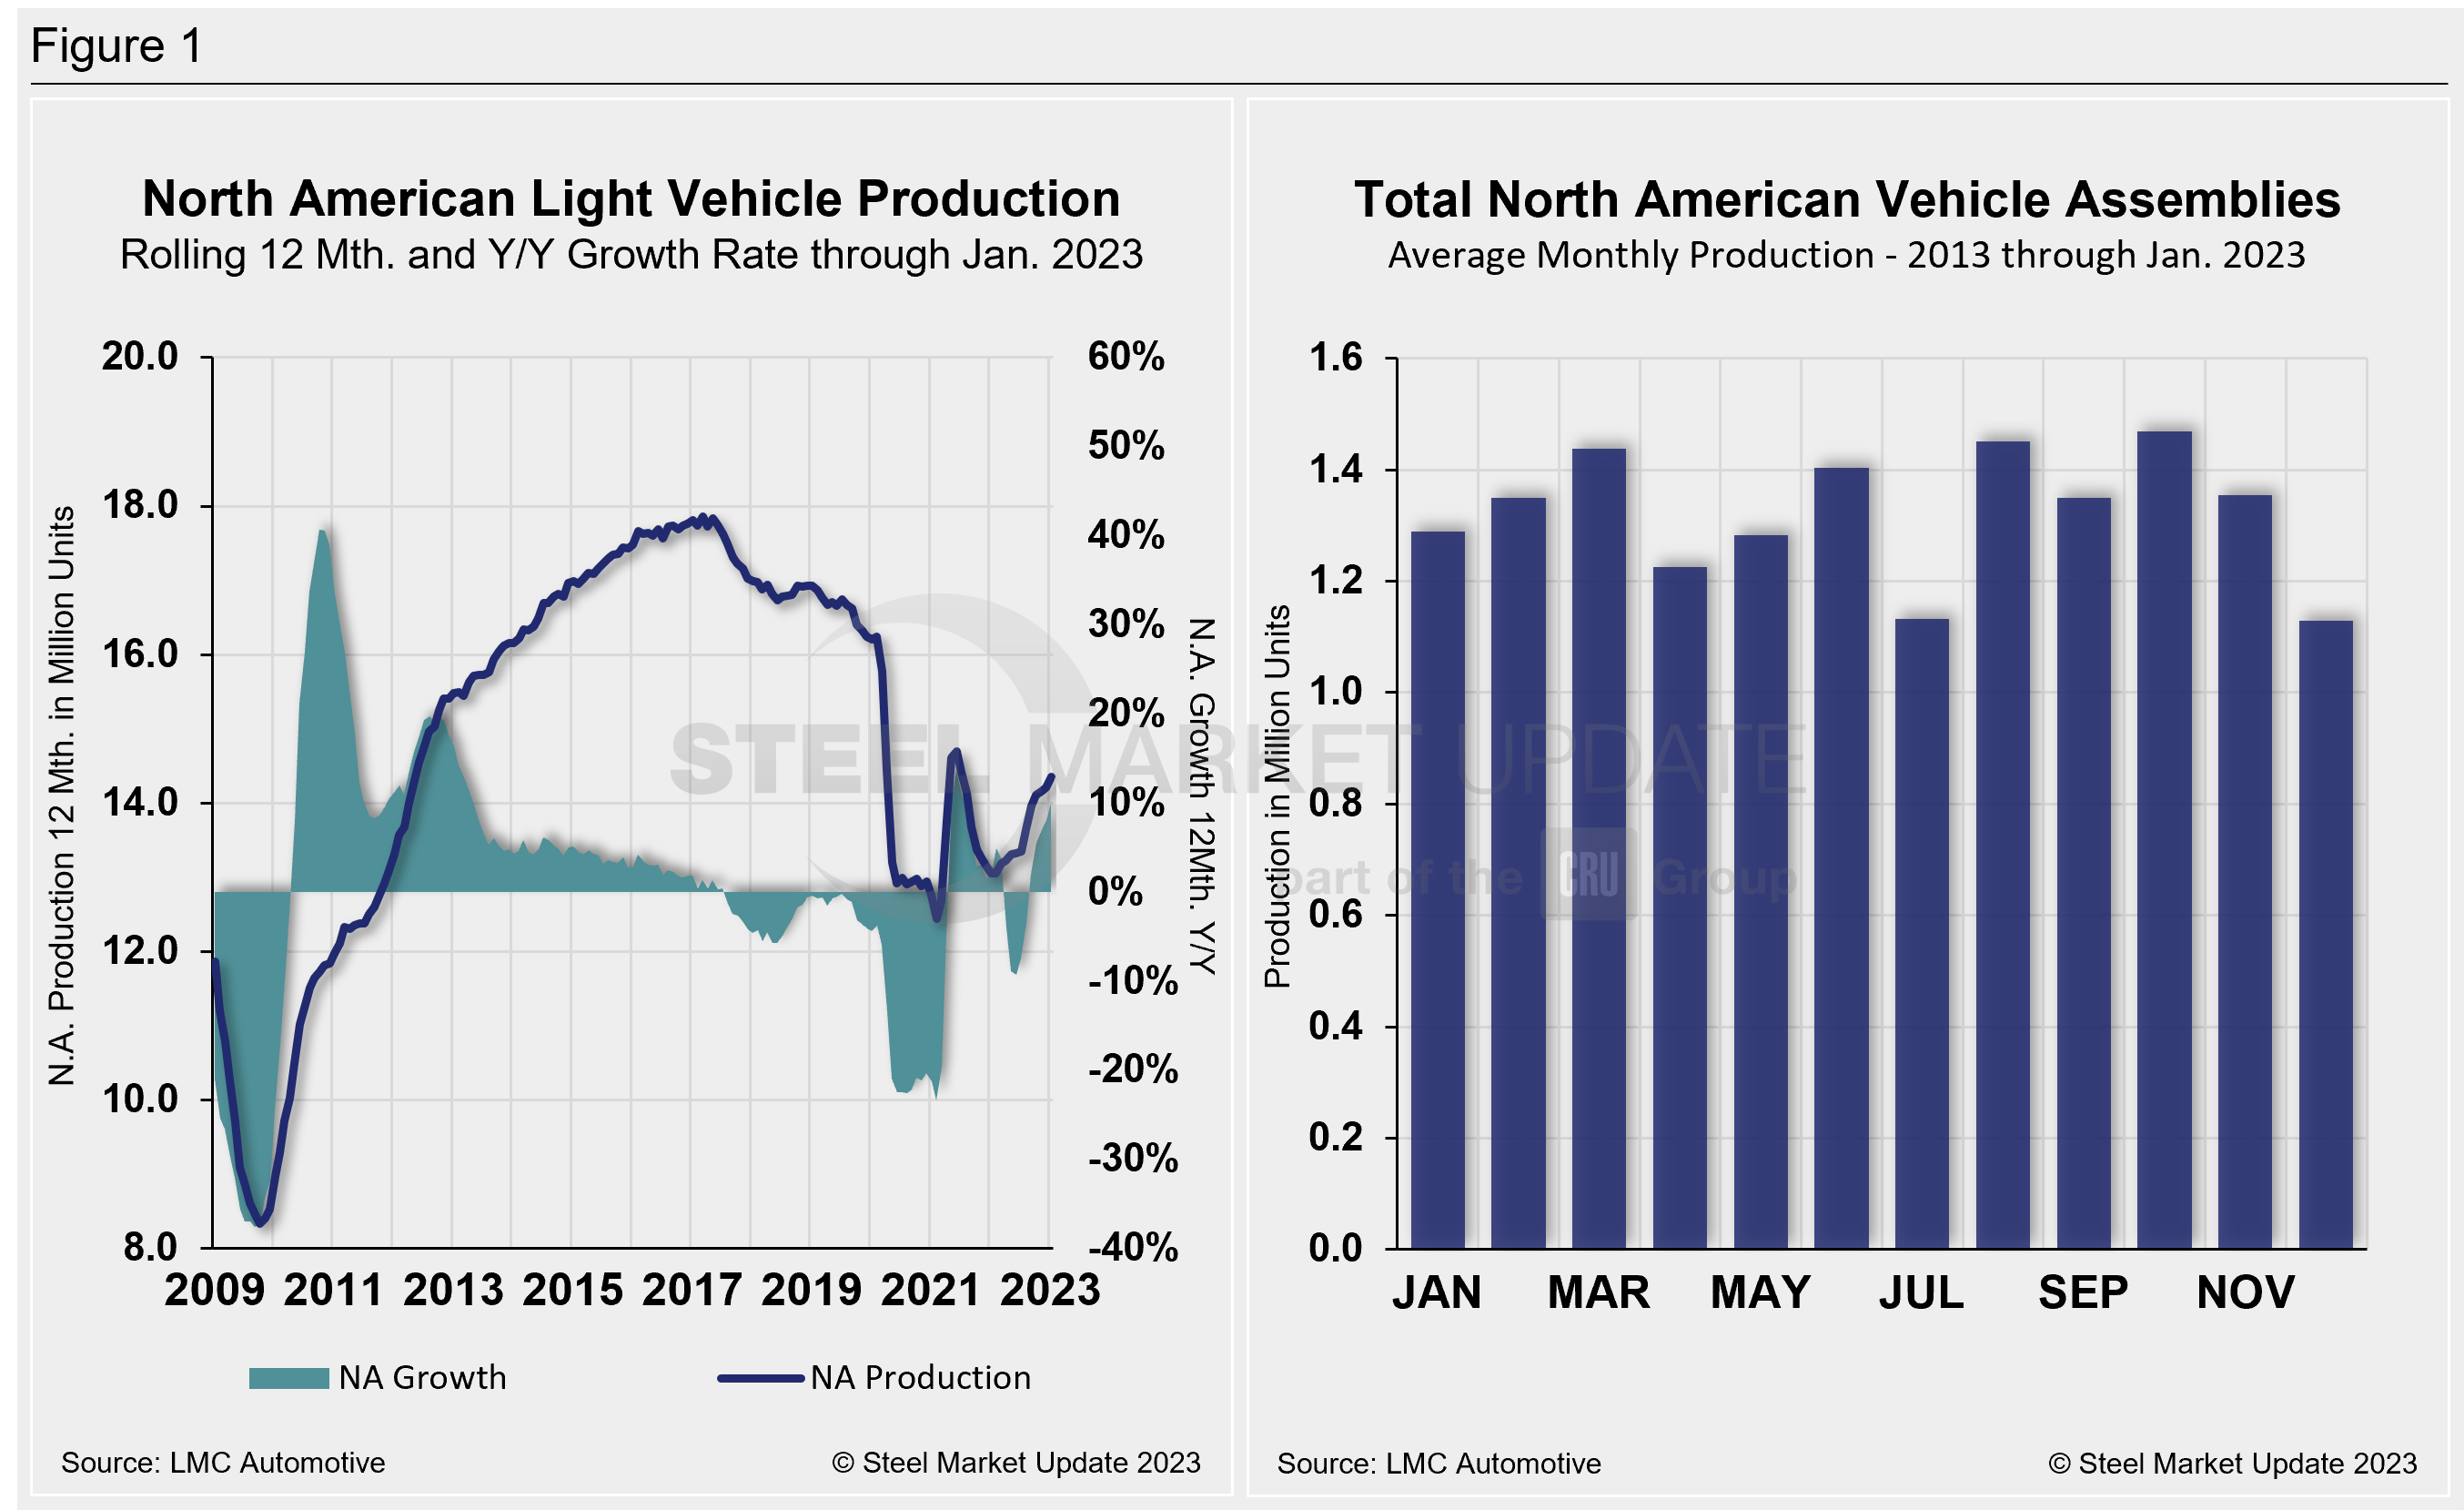
North American vehicle production, including personal and commercial vehicles, totaled 1.21 million units in January, up from 1.04 million units in December, and similarly ahead of the 1.06 million produced one year ago.
Below in Figure 1 is North American light-vehicle production since 2009 on a rolling 12-month basis with a YoY growth rate. Also included is the average monthly production, which includes seasonality since 2013.
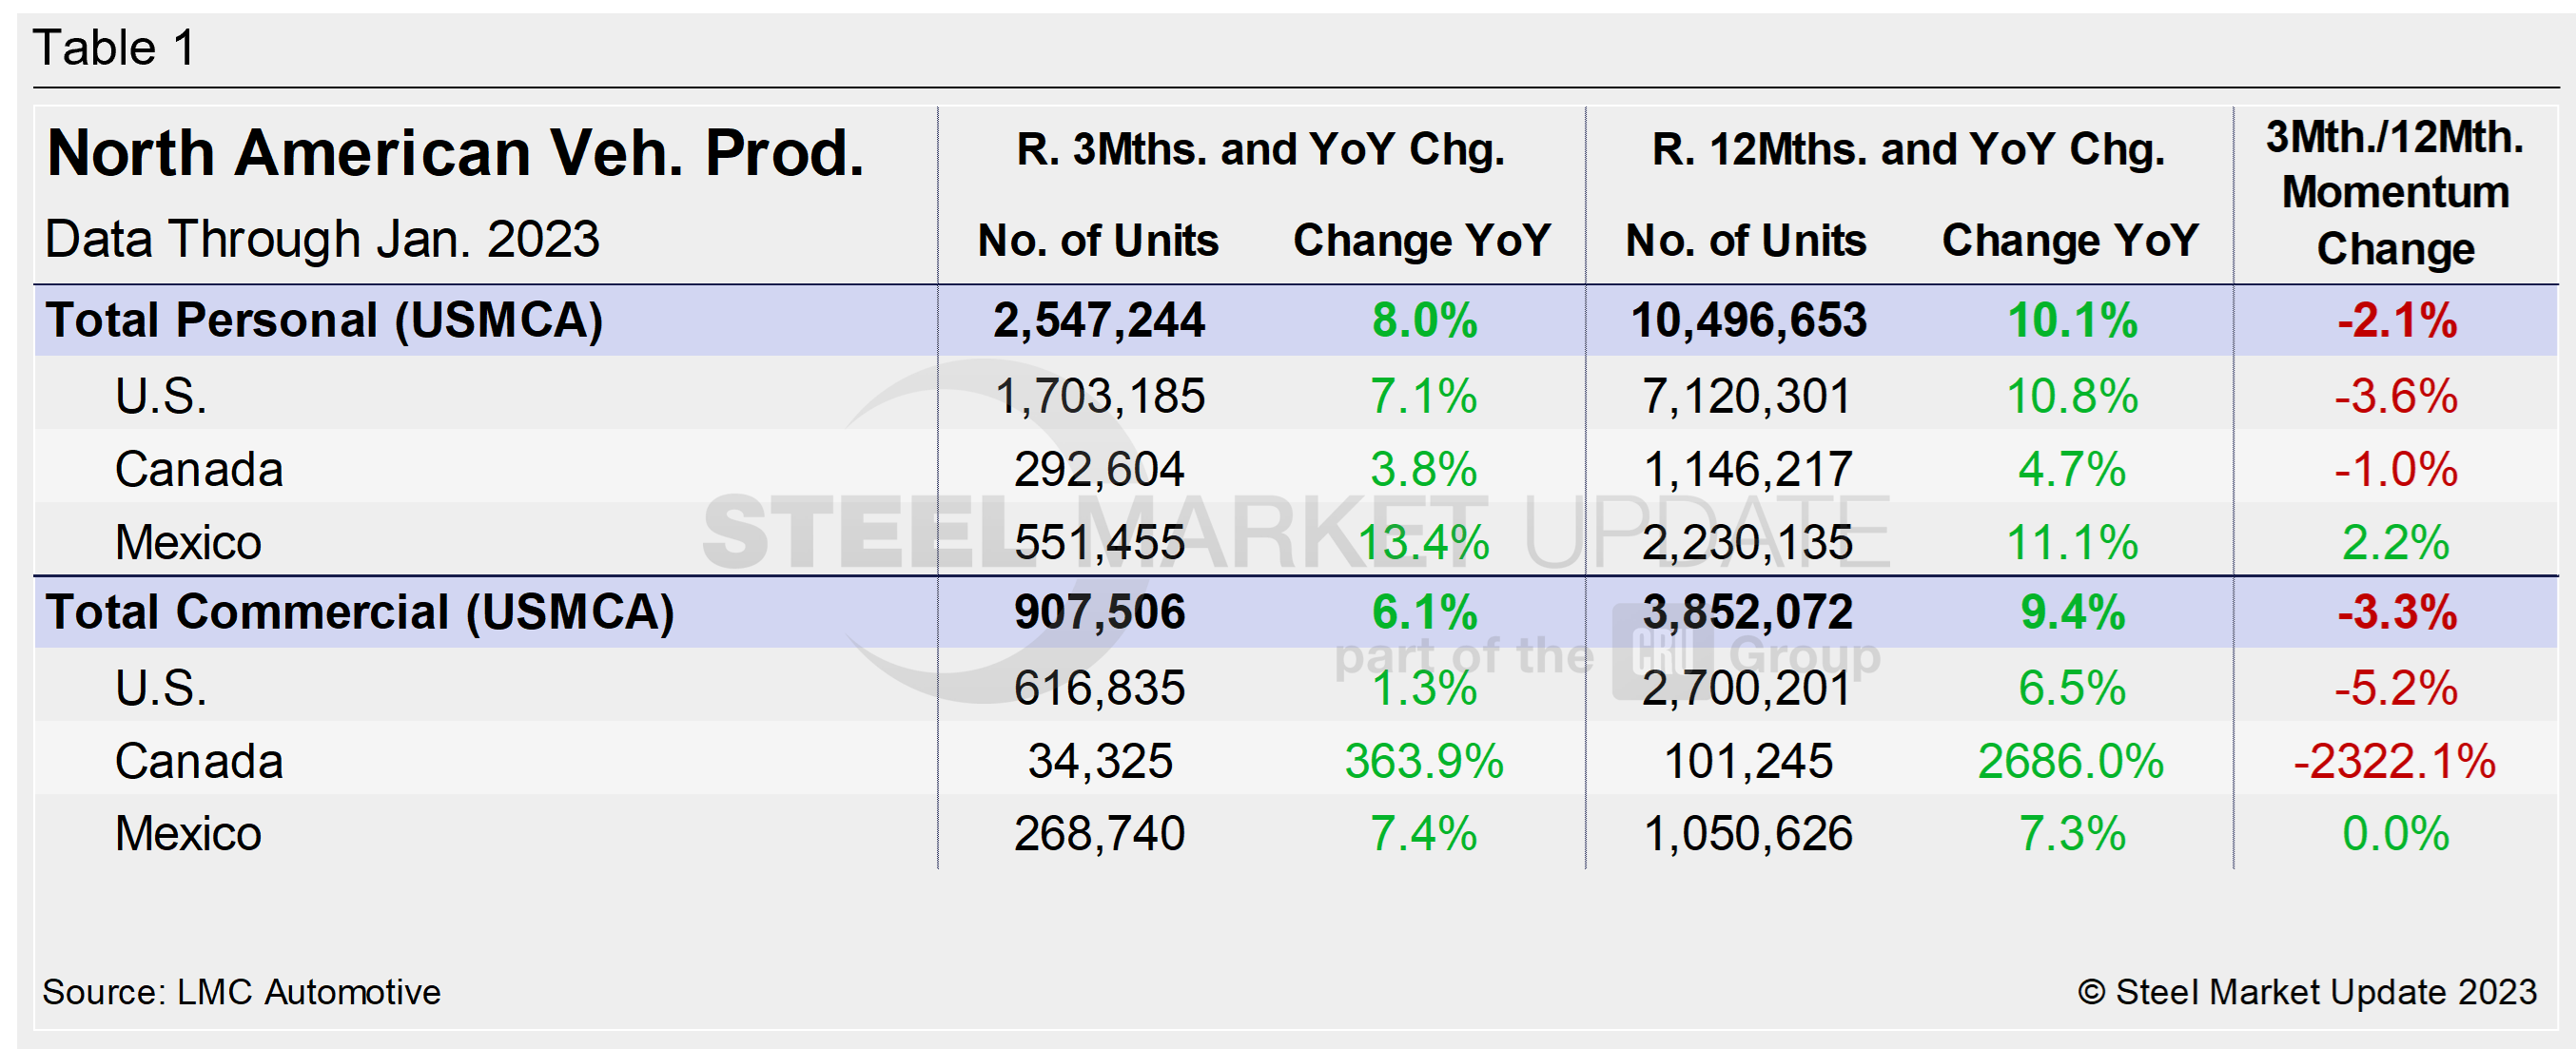
A short-term snapshot of assembly by nation and vehicle type is shown in the table below. It breaks down total North American personal and commercial vehicle production into US, Canadian, and Mexican components. It also includes the three- and 12-month growth rates for each and their momentum change.
The initial recovery from Covid’s early spread was significant, but the effect of the chip and parts shortage has been more extensive and prolonged. Through last September, growth rates for personal and commercial light vehicles were -25.8% and -8.4%, respectively. They have since recovered nicely, both posting steady gains.
For the three months through January, the growth rate for total personal and commercial vehicle assemblies in the USMCA region is up, but behind the 12-month basis totals. Noticeable is the momentum change posting a negative for the third straight month.
Personal Vehicle Production
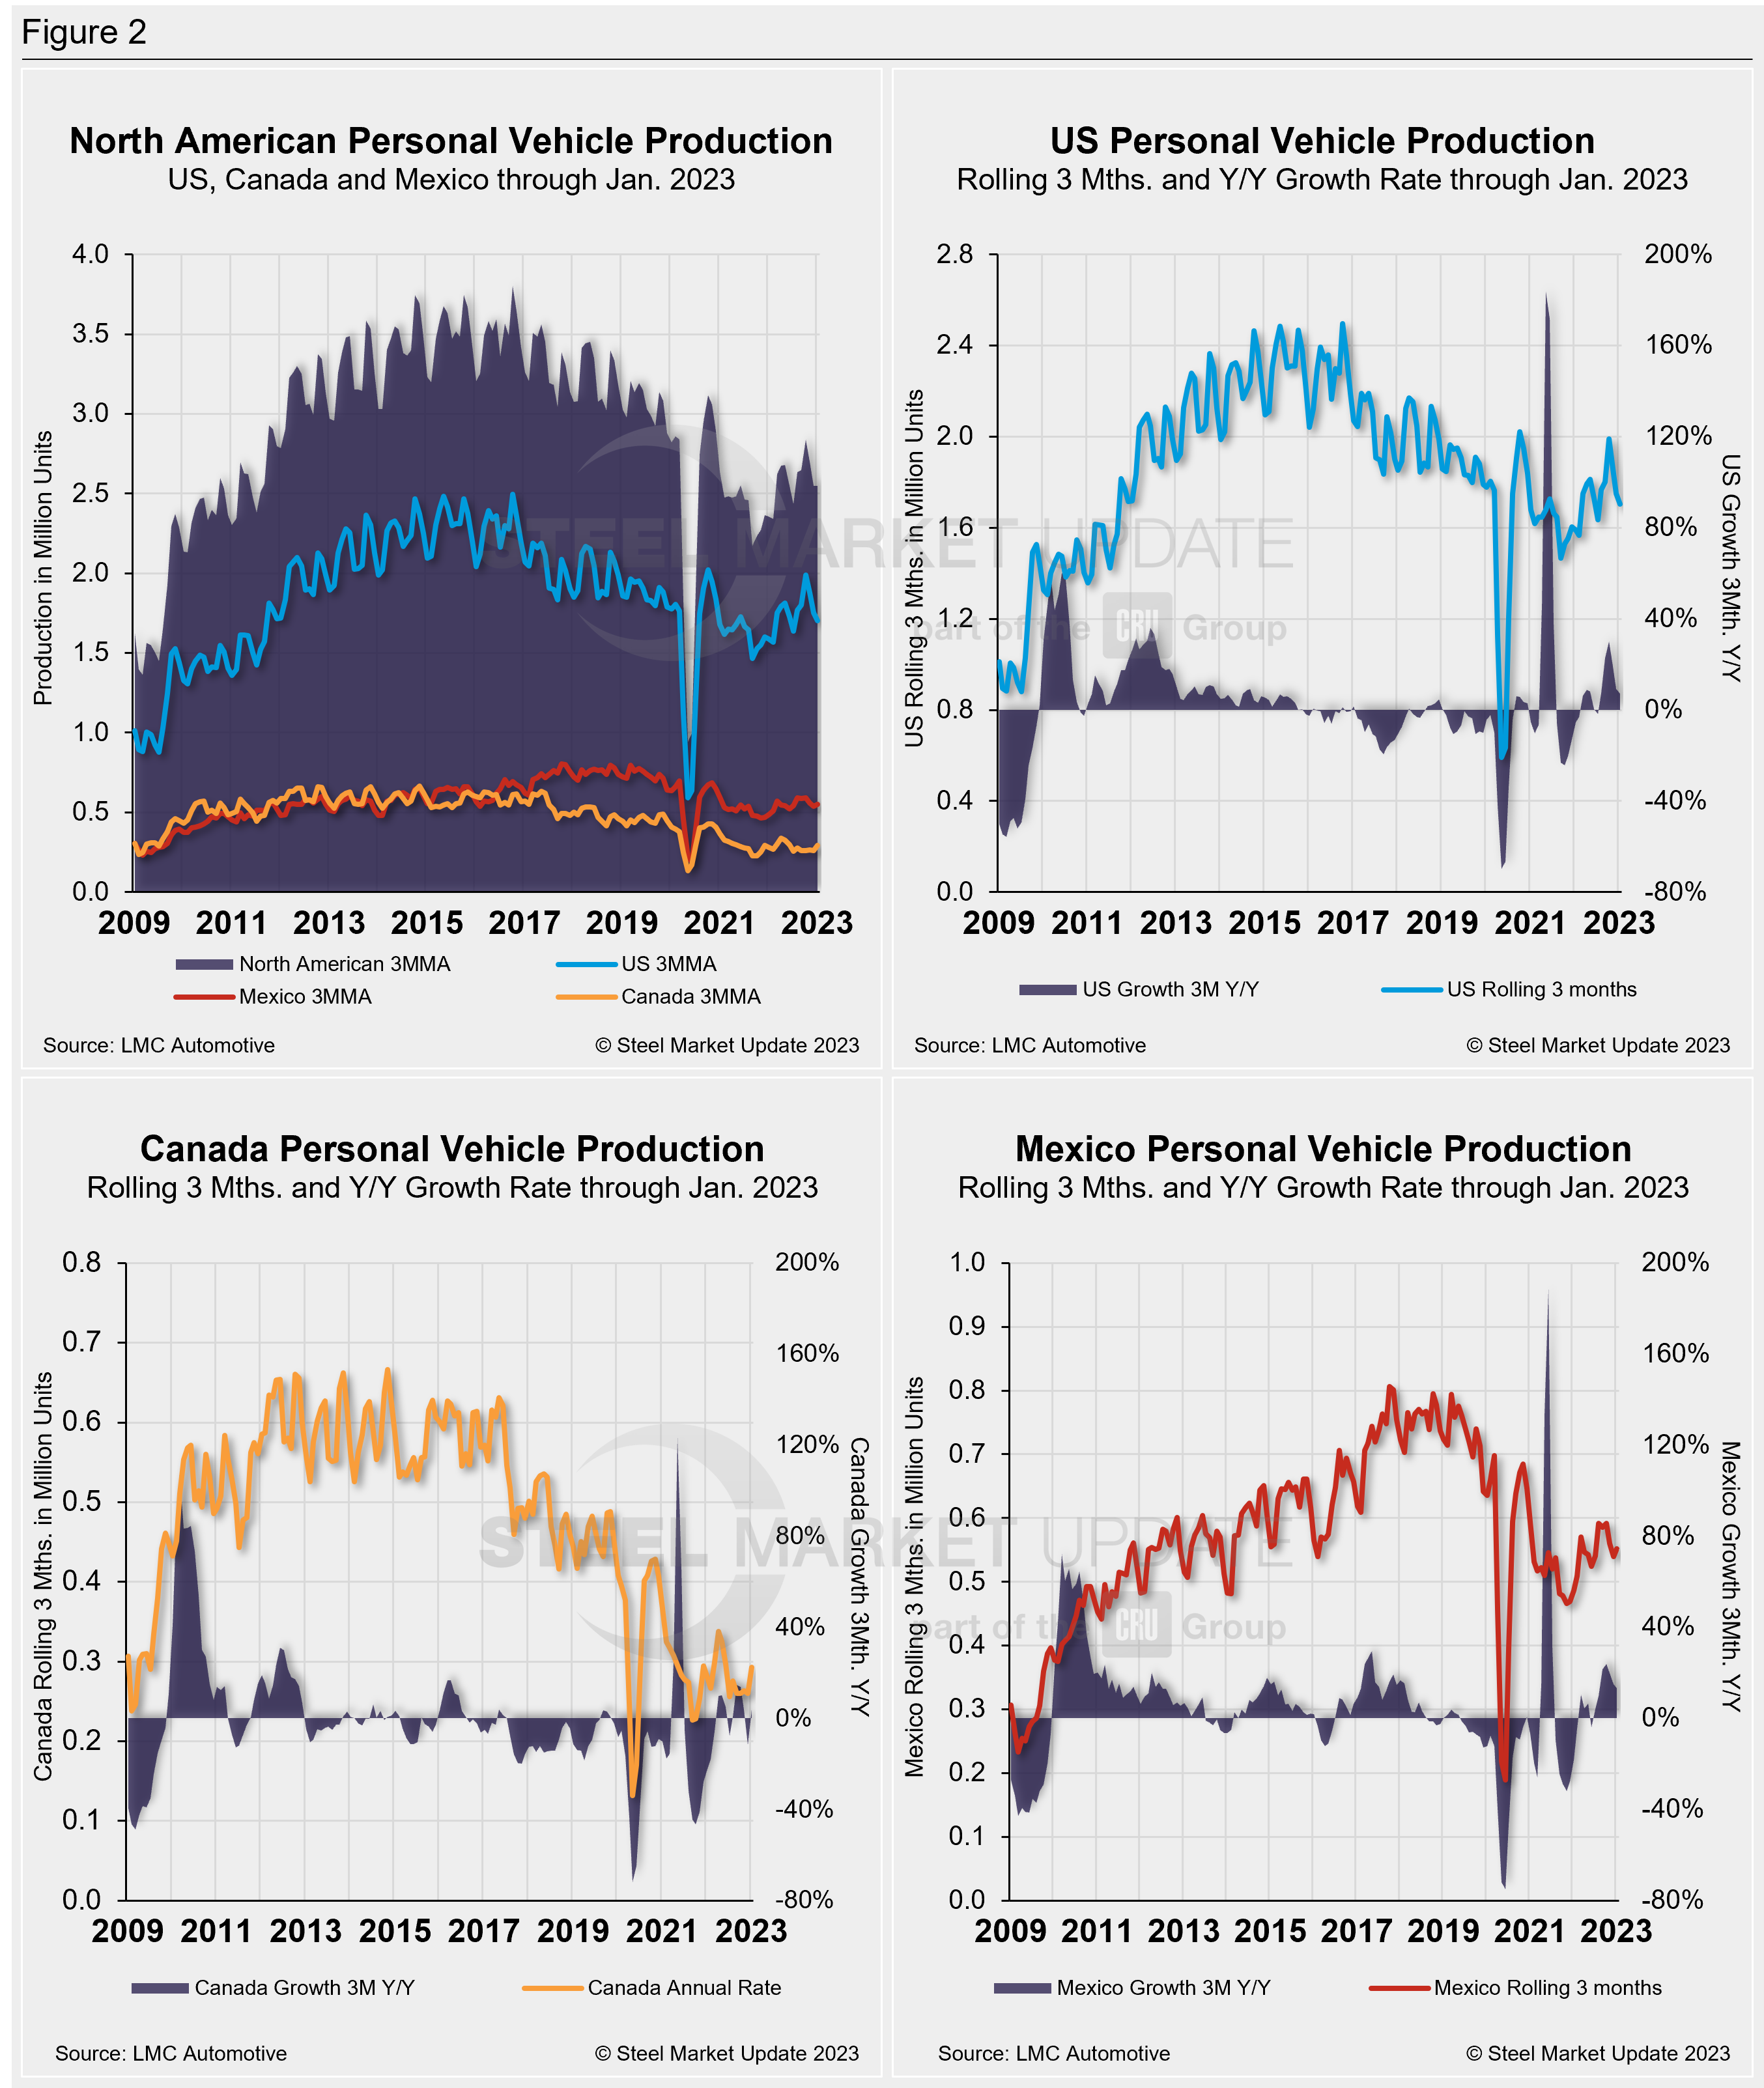
The longer-term picture of personal vehicle production across North America is shown below. The charts in Figure 2 show the total personal vehicle production for North America and the total for the US, Canada, and Mexico. Personal vehicle production in these three countries and their YoY growth rate are also displayed.
In terms of personal vehicle production, the region saw a month-over-month (MoM) boost in January.
The US saw the largest increase in units produced in January vs. December, up 99,181 units (+19.4%). It was followed by Mexico, up 31,378 units (+19.1%), and Canada, up 18,644 units (+22.3%) MoM.
The positive gains last month for the region pushed the annual growth rate to 8%, up 2.8 percentage points MoM. Canada’s growth rate rebounded by 15.4 percentage points to a positive 3.8% gain. The US and Mexico both saw their growth rates decline slightly but remained positive at 7.1% and 13.4%, respectively.
Production share across the region was largely unchanged. The US saw its personal vehicle production share of the North American market edge down by 1.8 percentage points to 66.9%. Mexico was up just 0.5 percentage points to a regional market share of 21.6%, and Canada was up 1.3 percentage points to 11.5%, respectively.
Commercial Vehicle Production
Total commercial vehicle production for North America and the total for each nation within the region are shown in the first chart in Figure 3 on a rolling three-month basis. Commercial vehicle production in the US and Mexico and their YoY growth rates, as well as the production share for each nation in North America, are also shown.
Of note for the Canadian automotive sector: January marked the 15th month since Canada resumed commercial vehicle production after a 20-month production halt. Canada produced 15,349 light commercial vehicles in January, an 85.2% surge from December, and the highest total since August 2028.
North American commercial vehicle production was up 6.8% in January with a total of 303,395 units produced during the month, an increase of 19,201 units MoM. The gain was limited by a 4.6% decline, or 9,240 fewer units produced in the US last month. Mexico saw a 29.3% boost in commercial vehicle production in January, to complement Canada’s increase. Mexico’s assemblies were up 7,063 units to a total of 15,349 units for the month.
The overall increase put the commercial production growth rate at 6.1% for the region last month, down slightly from 6.3% in December.
The market share across the region shifted slightly. The US held more than two-thirds of the market, with a total share of 68%, followed by Mexico with a 31.1% share, and Canada with at 3.8% share in January.
Presently, Mexico exports just under 80% of its light-vehicle production. The US and Canada are the highest-volume destinations for Mexican exports.

Editor’s Note: This report is based on data from LMC Automotive for automotive assemblies in the US, Canada, and Mexico. The breakdown of assemblies is “Personal” (cars for personal use) and “Commercial” (light vehicles less than 6.0 metric tons gross vehicle weight rating; heavy trucks and buses are not included).
By David Schollaert, david@steelmarketupdate.com