Analysis
March 22, 2023
US Light Vehicle Sales Edge Down Again in February
Written by David Schollaert
US light-vehicle (LV) sales declined to an unadjusted 1.14 million units in February, the US Bureau of Economic Analysis (BEA) reported. Despite the month-on-month (MoM) decline, February’s total was still 8.7% higher year-on-year (YoY), and the seventh consecutive month to see a YoY increase in sales.
On an annualized basis, LV sales were down 6.2% MoM in February, declining to 14.9 million units, just slightly ahead of the consensus forecast of 14.7 million.
The decline in auto sales last month is somewhat deceiving, as some seasonality distortions related to the pandemic partially inflated the reading for January, leading the February level to look a bit weak.
Sales grew by 8.7%, on an unadjusted basis, even while strong demand headwinds, like high financing costs and high transaction prices, remain.
Passenger vehicle sales increased 52.2% YoY last month while sales of light-trucks ticked up by 9.6%. Light-trucks accounted for more than 73% of February’s sales, down from its share of nearly 80% in February 2022.
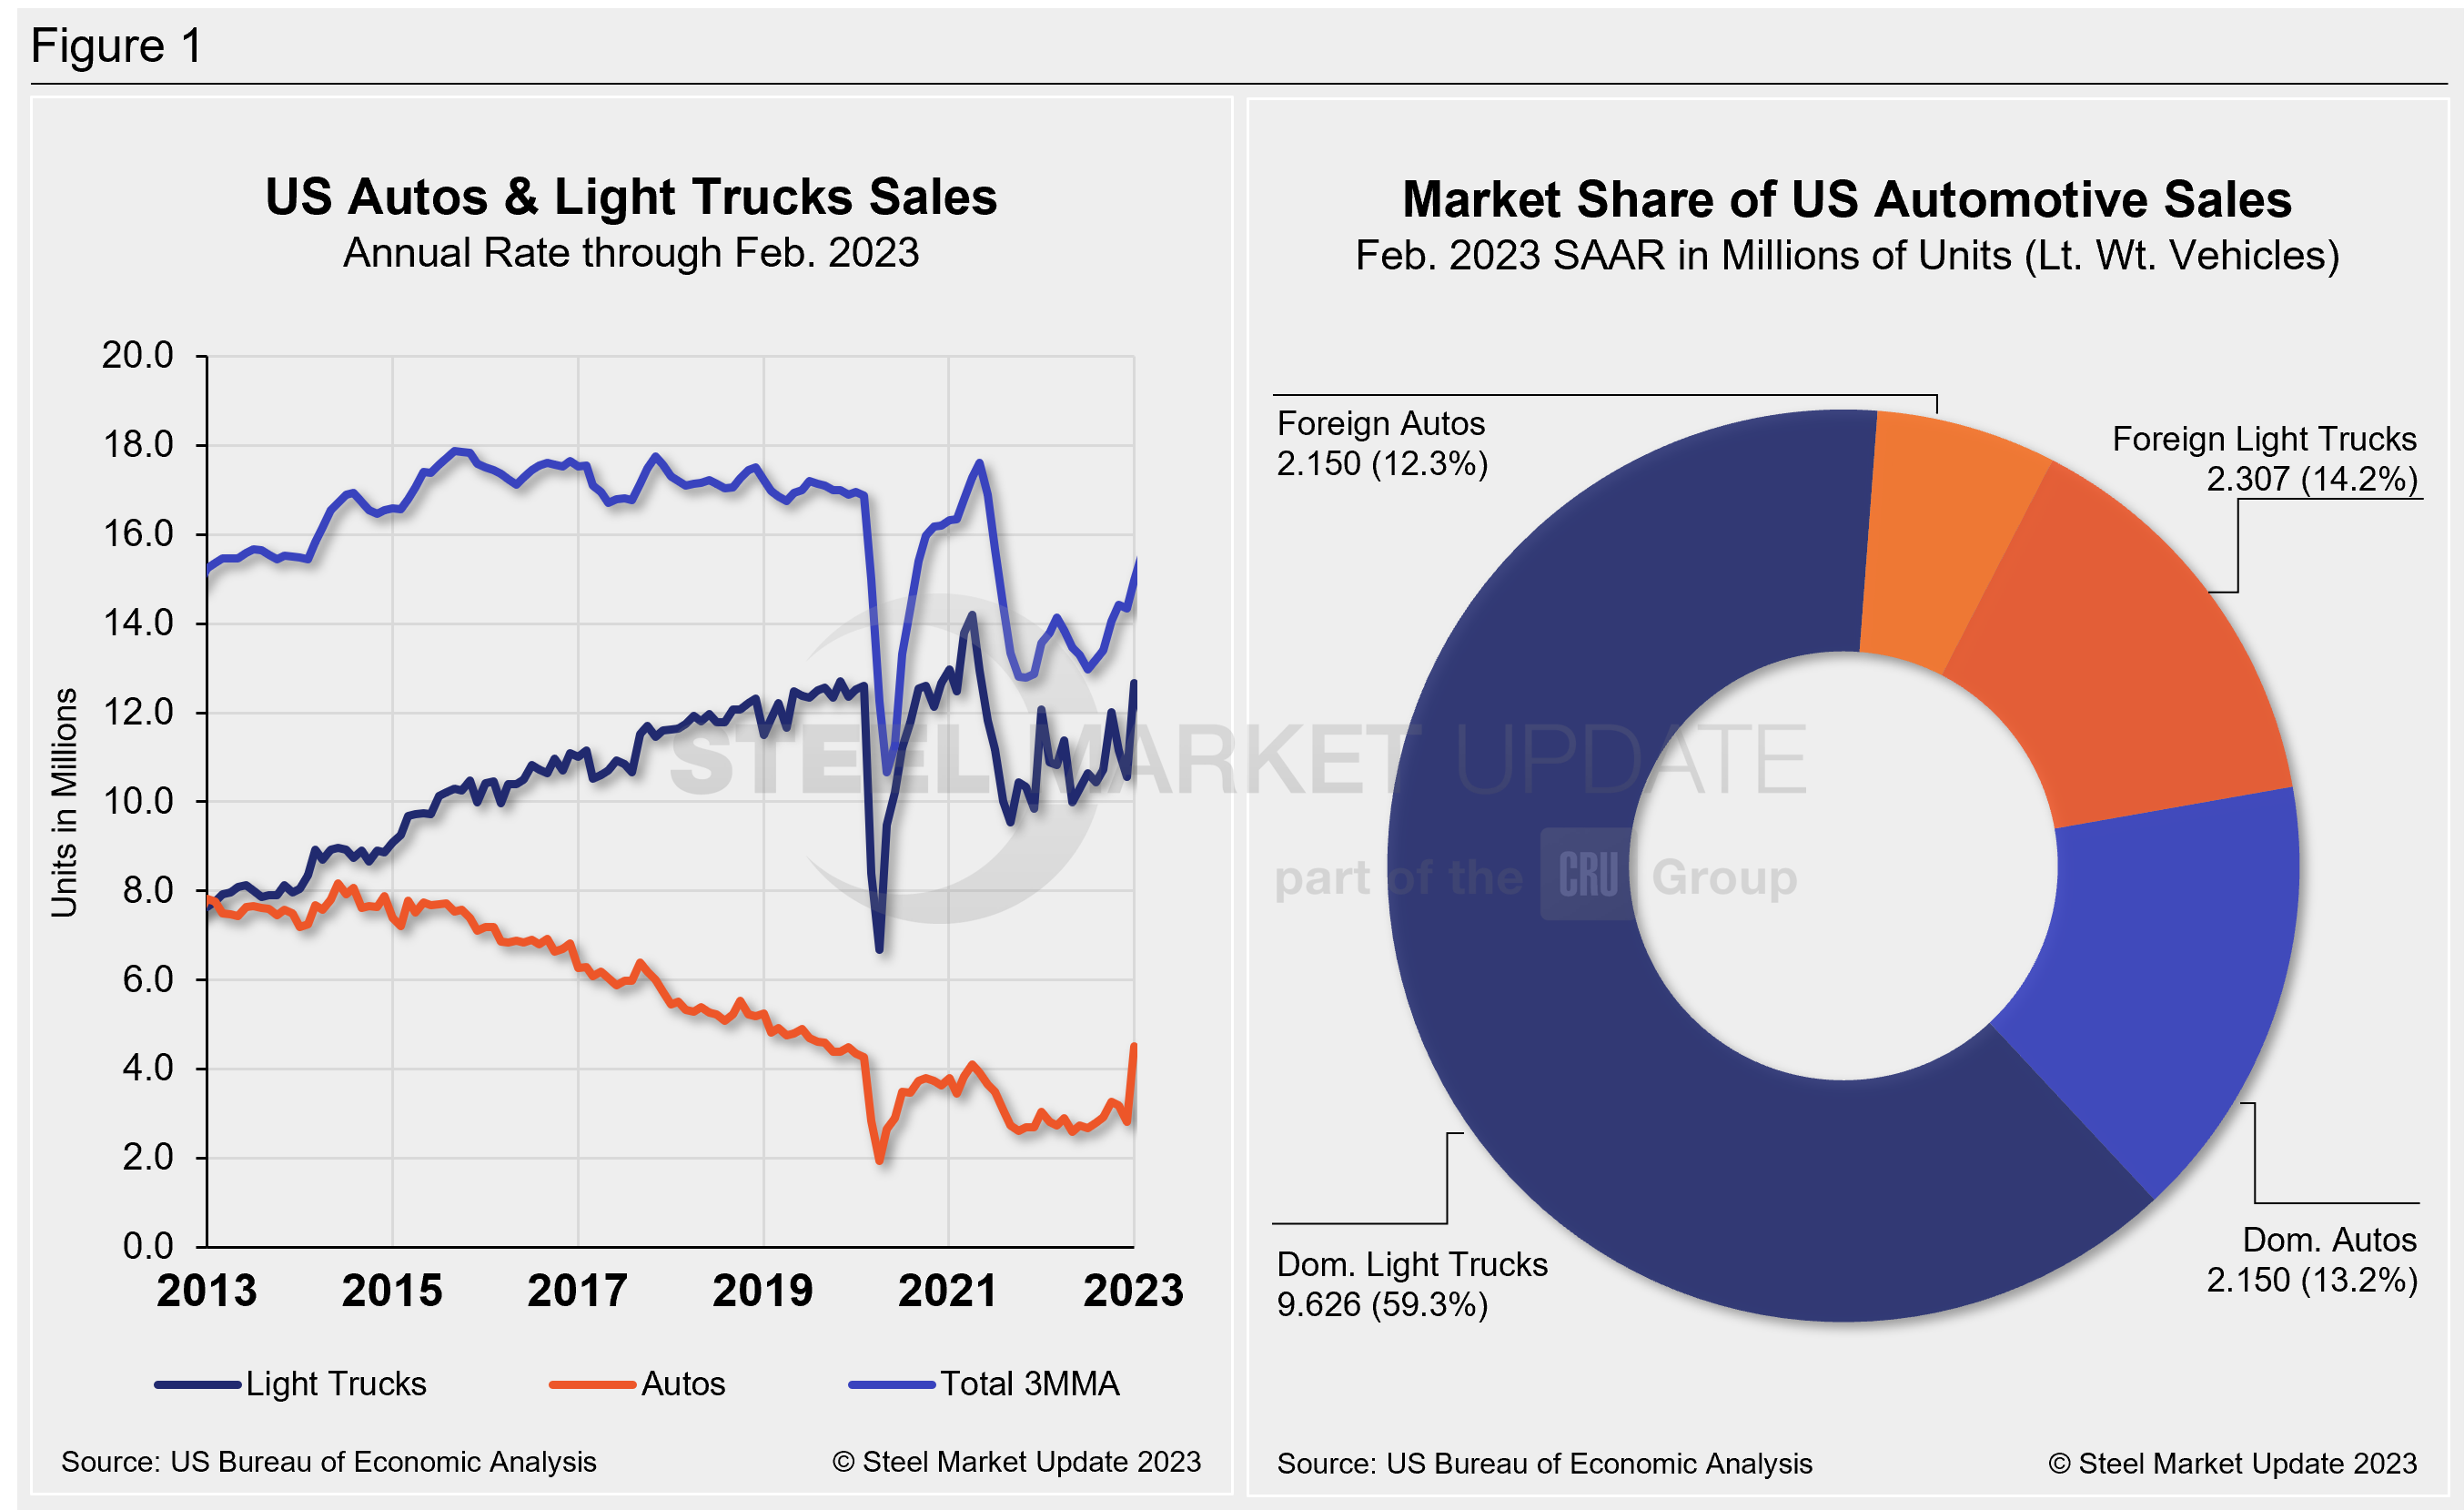
Below in Figure 1 is the long-term picture of sales of autos and lightweight trucks in the US from 2013 through January 2023. Additionally, it includes the market share sales breakdown of last month’s 14.9 million vehicles at a seasonally adjusted annual rate.
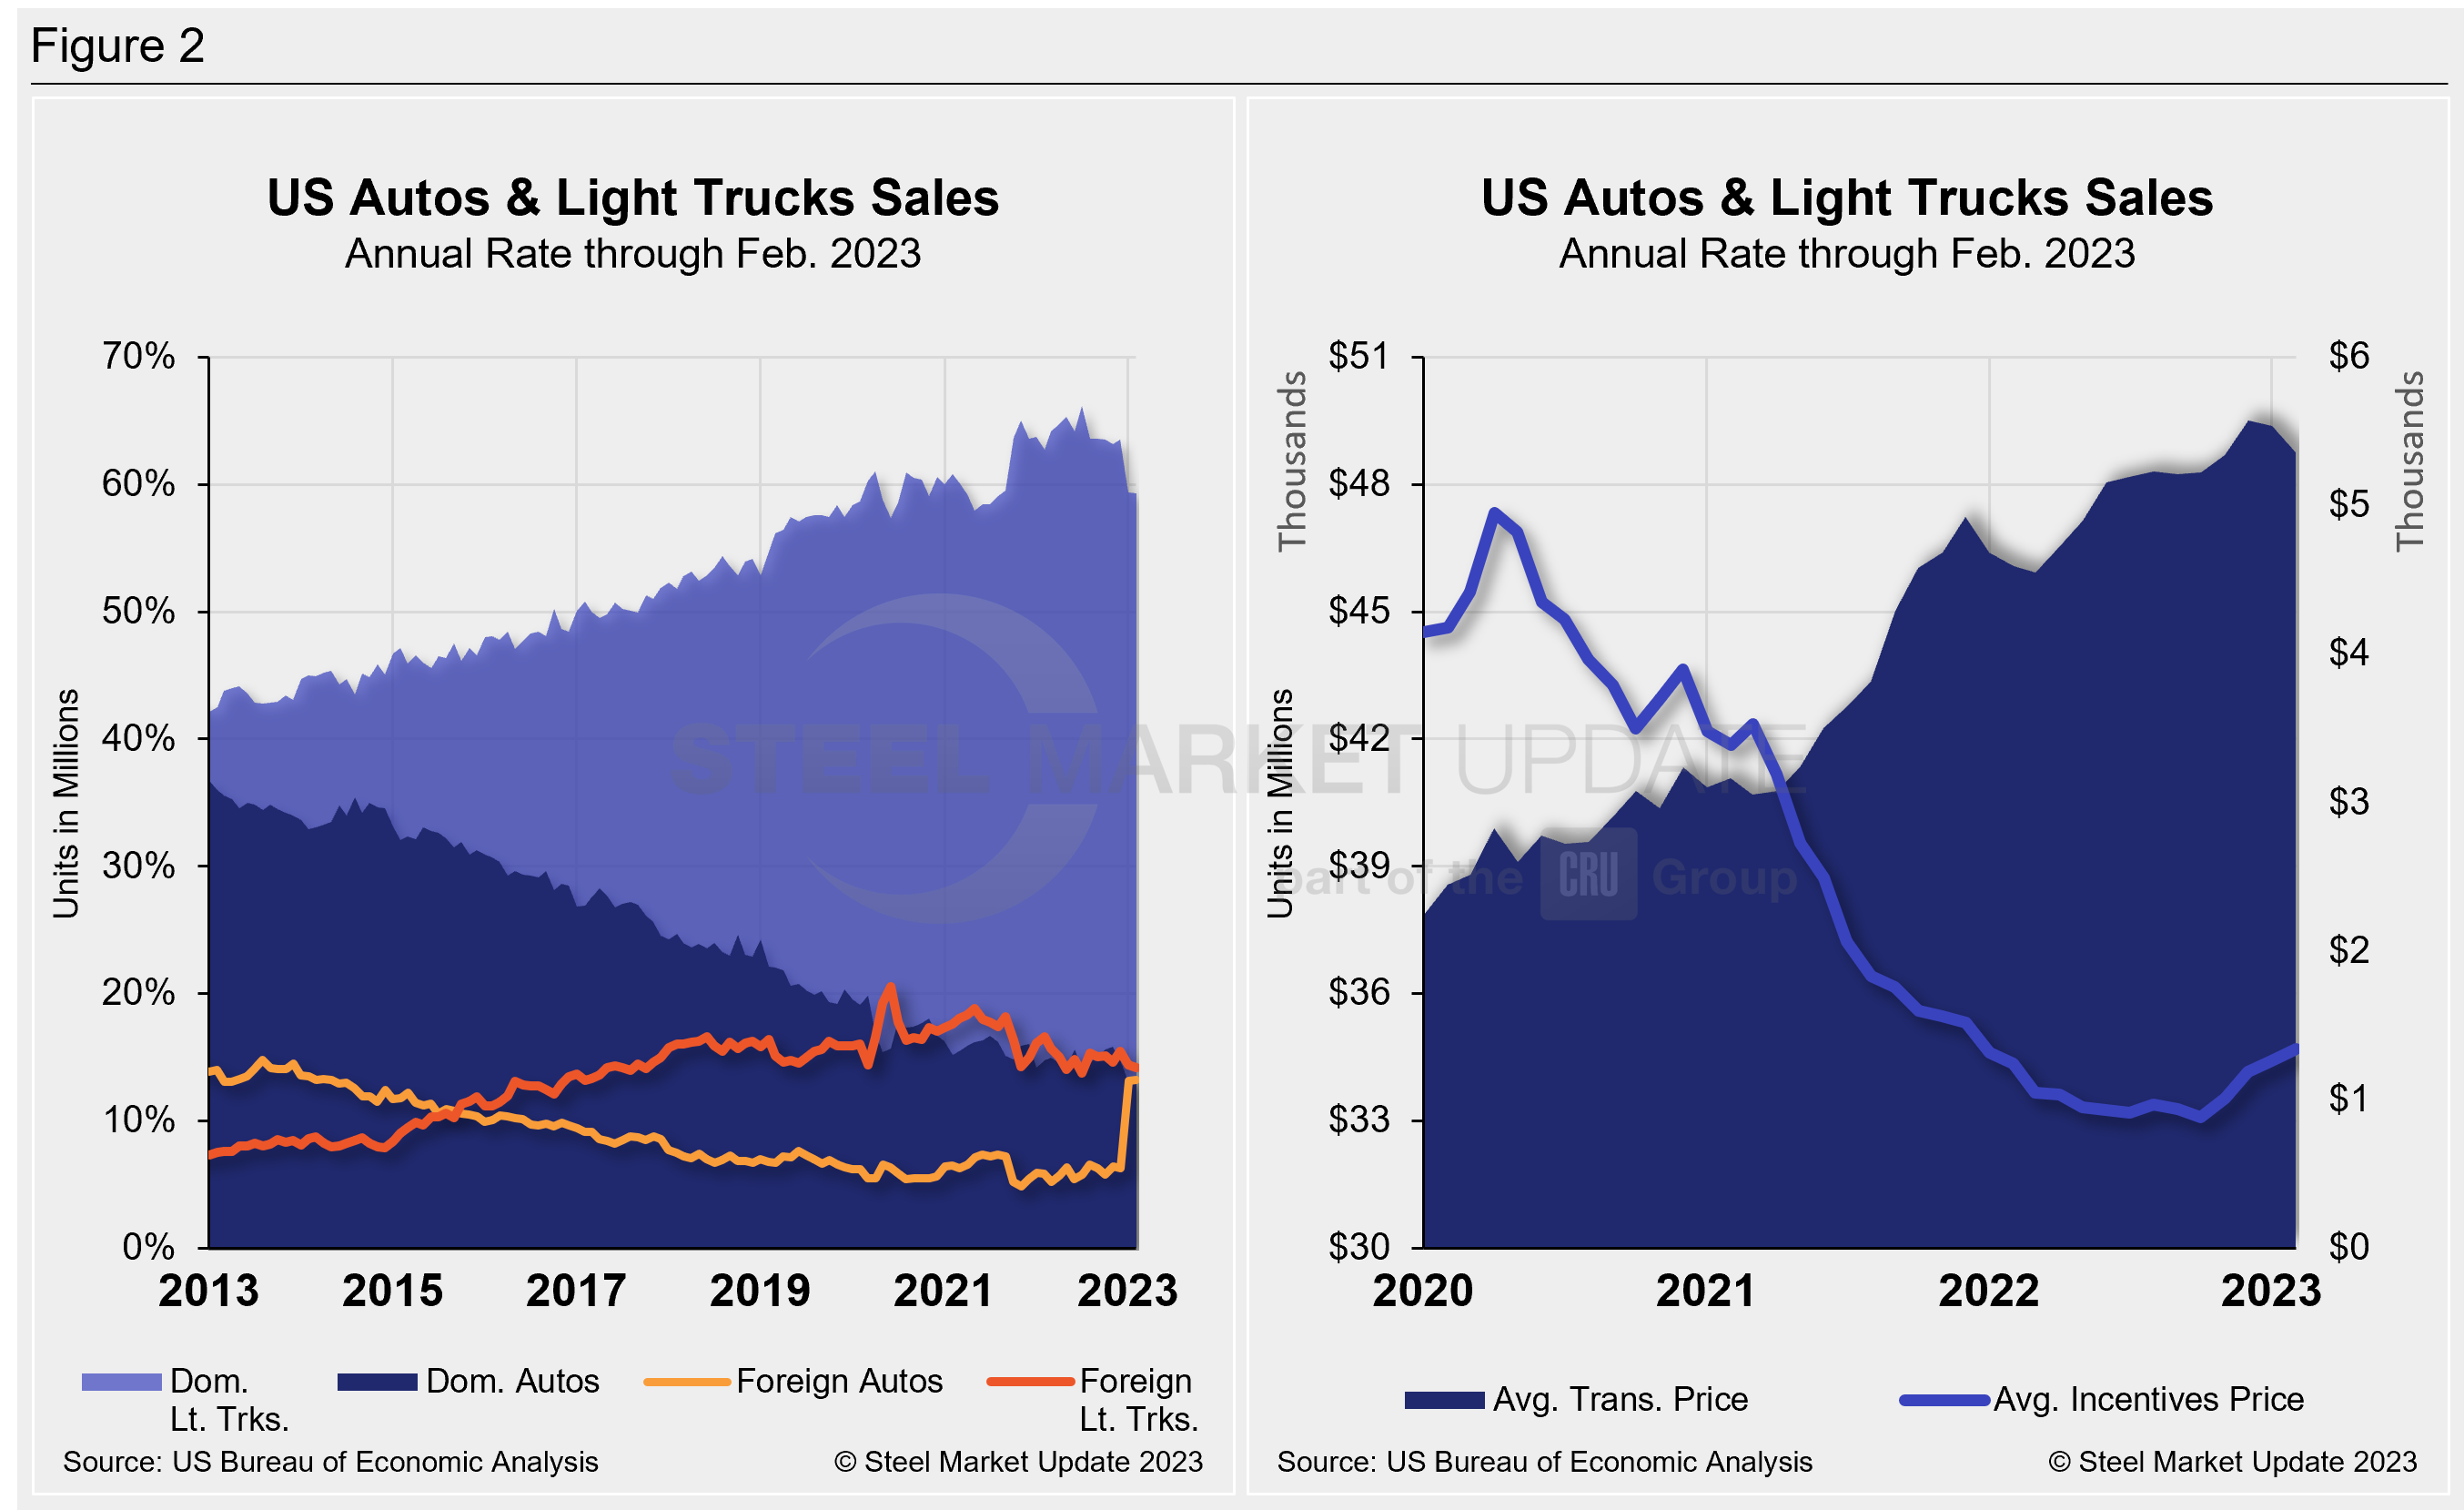
The new-vehicle average transaction price (ATP) was $48,763 in February, down for the second straight month after reaching an all-time high $49,507 in December. ATPs were just 0.2% lower (-$625) in February vs. the prior month but 5.8% (+$2,681) above the year-ago period, according to Cox Automotive data.
Incentives increased again for the fourth straight month. Last month’s incentives were $1,339, up from $1,260 in January. With the MoM increase, incentives remained above the $1,000 mark for the fourth time in ten months and roughly 2.7% of the average transaction price. Incentives are up 7.6%, or $94 YoY.
In February, the annualized selling rate of light trucks was 11.933 million units, down 5.8% vs. the prior month but still 49.6% better YoY. Auto annualized selling rates saw similar dynamics, down 4.7% but up 52.2%, respectively, in the same comparisons.
Figure 2 details the US auto and light-truck market share since 2013 and the divergence between average transaction prices and incentives in the US market since 2020.
Editor’s Note: This report is based on data from the US Bureau of Economic Analysis (BEA), LMC Automotive, JD Power, and Cox Automotive for automotive sales in the US, Canada, and Mexico. Specifically, the report describes light vehicle sales in the US.
By David Schollaert, david@steelmarketupdate.com