

Analysis

May 31, 2023
US Light-Vehicle Sales Up 9% in April
Written by David Schollaert
US light-vehicle (LV) sales rose to an unadjusted 1.35 million units in April, the US Bureau of Economic Analysis (BEA) reported. The month-on-month (MoM) boost pushed April’s total 9% higher year-on-year (YoY), and is the eighth consecutive month to see a YoY increase in sales.
On an annualized basis, LV sales were up 7.2% MoM in April, reaching 15.9 million units, and well ahead of consensus forecast of 15.1 million.
The boost in auto sales came as the market benefited from a strong end to April – the start of the spring buying season – and increased vehicle availability. To boot, sales on the month were only 2.6% below April 2019 levels. But pent-up demand has meant a MoM decline in inventory stock by 46k units.
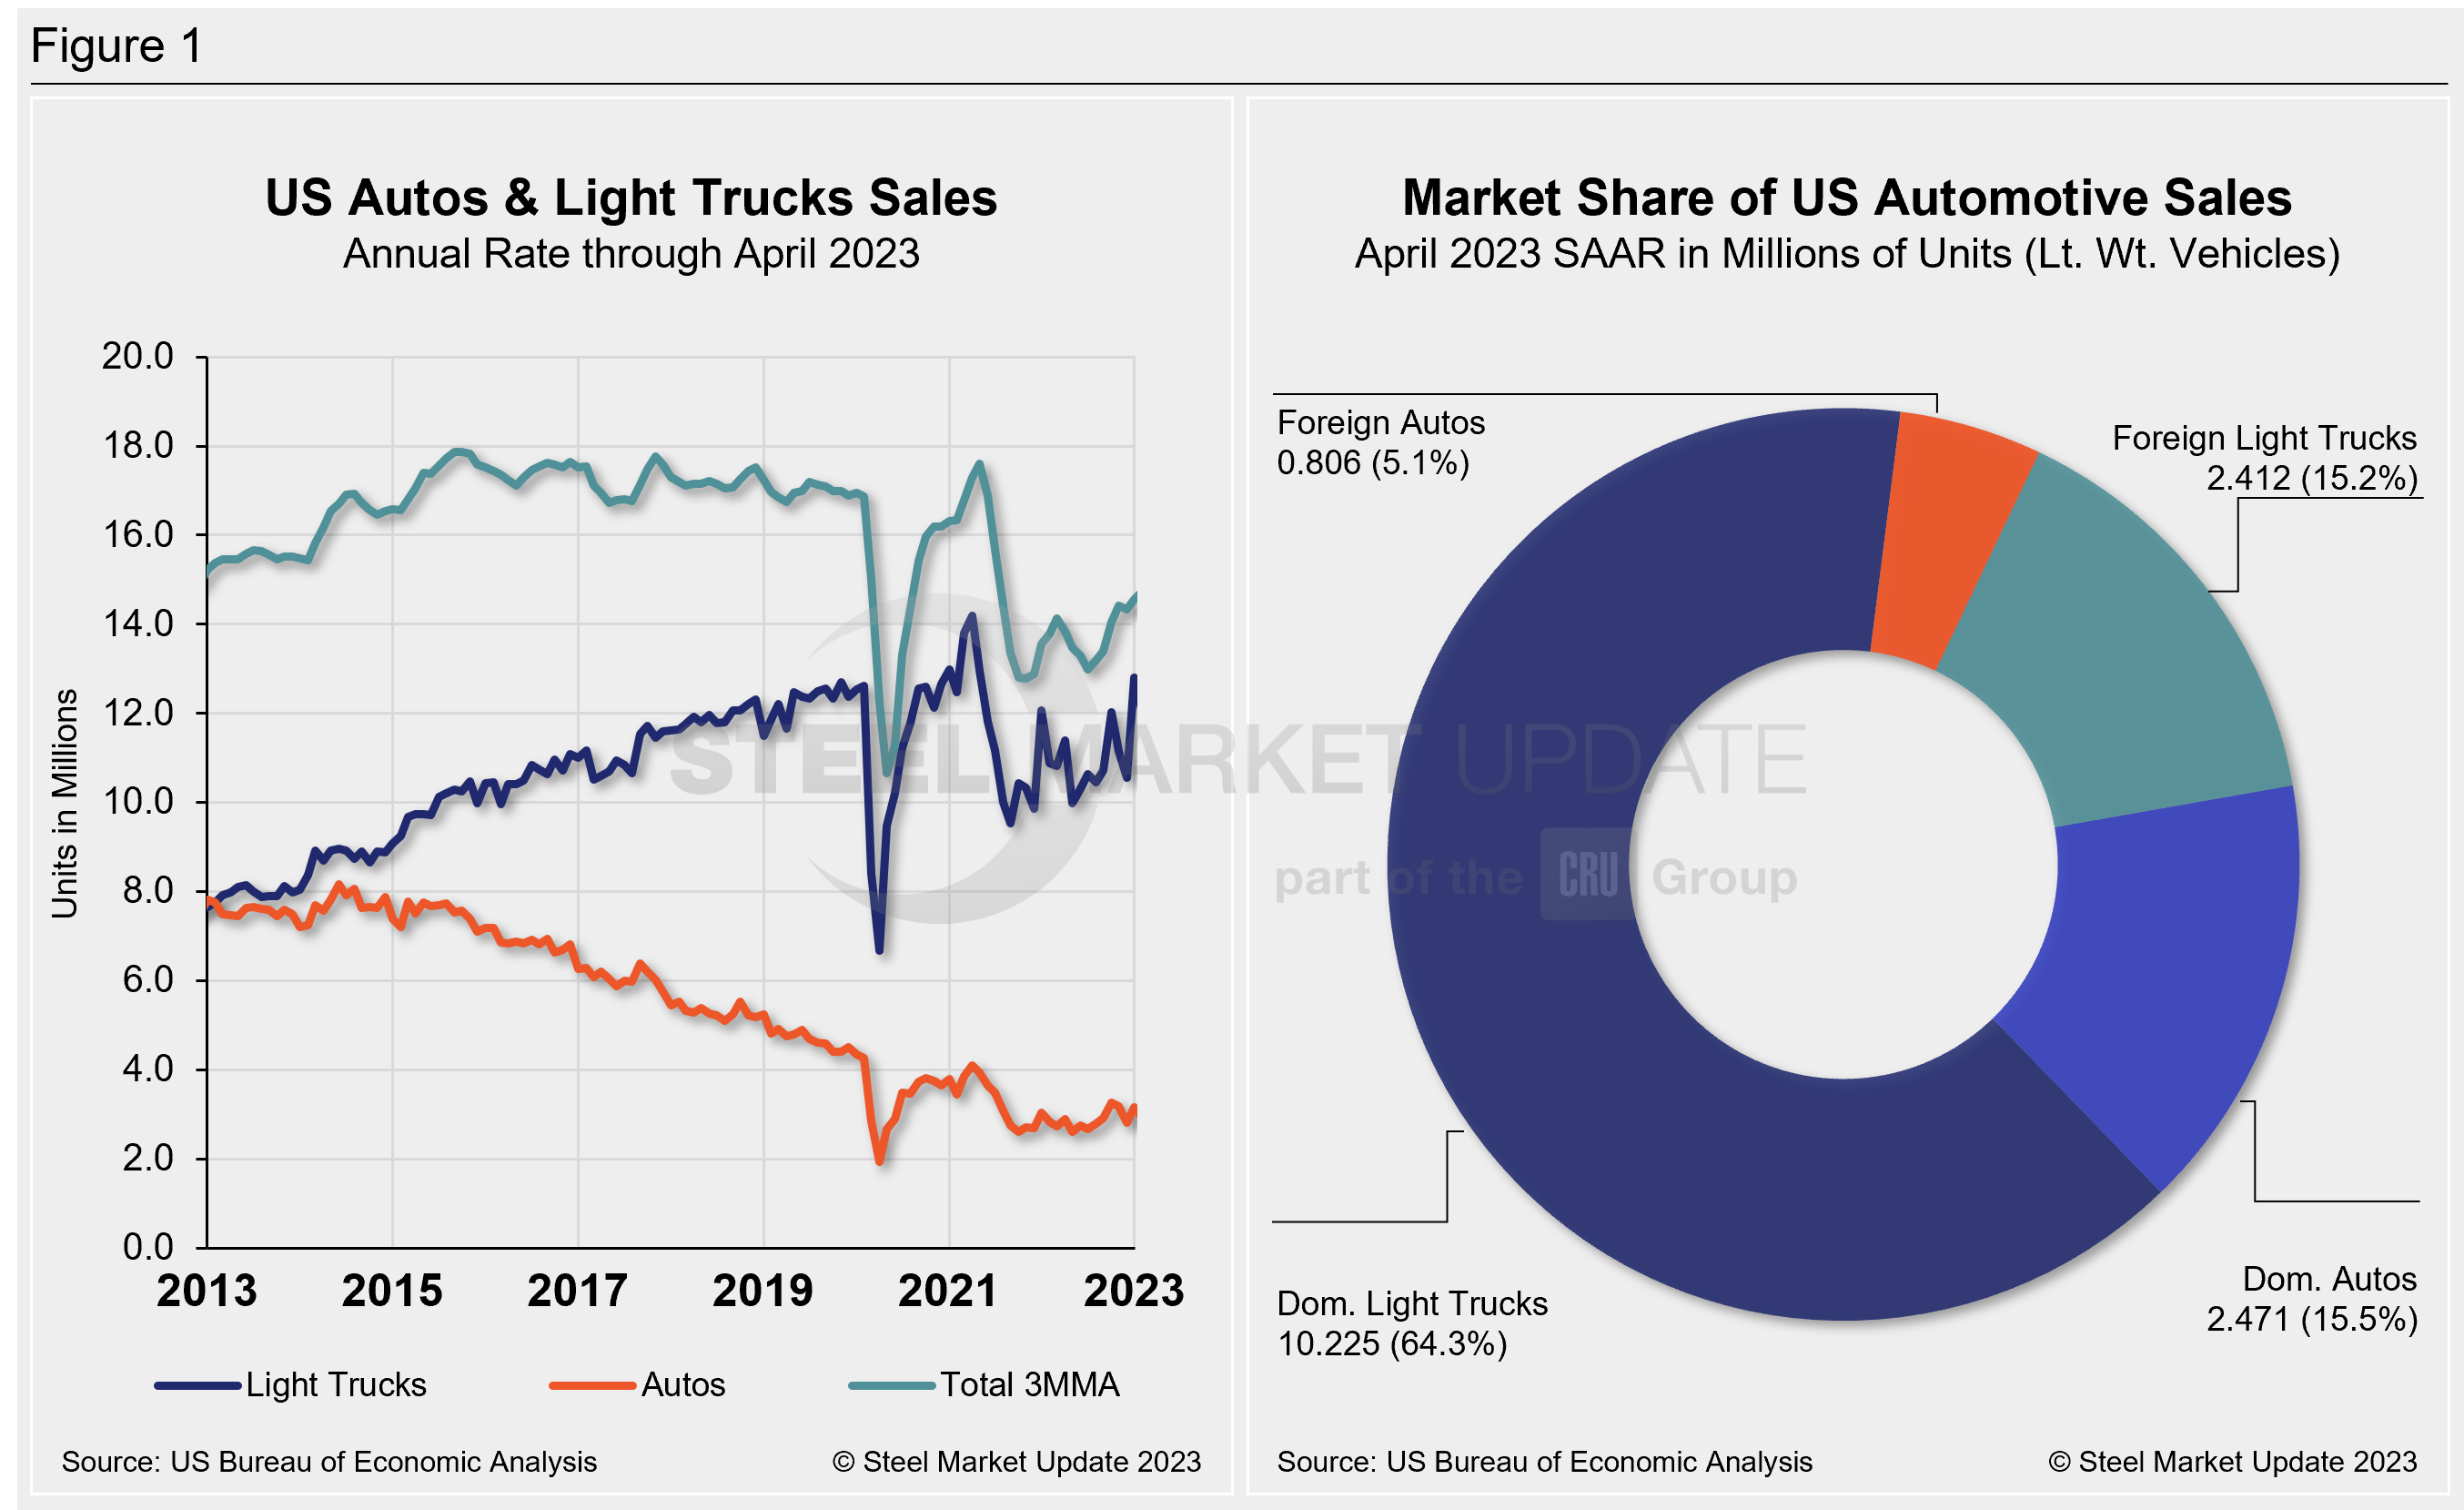
Passenger vehicle sales increased 13.2% YoY last month, while sales of light-trucks ticked up by 11%. Light-trucks accounted for more than 79.4% of April’s sales, down from its share of just over 79.7% in April 2022.
Below in Figure 1 is the long-term picture of sales of autos and lightweight trucks in the US from 2013 through April 2023. Additionally, it includes the market share sales breakdown of last month’s 15.9 million vehicles at a seasonally adjusted annual rate.
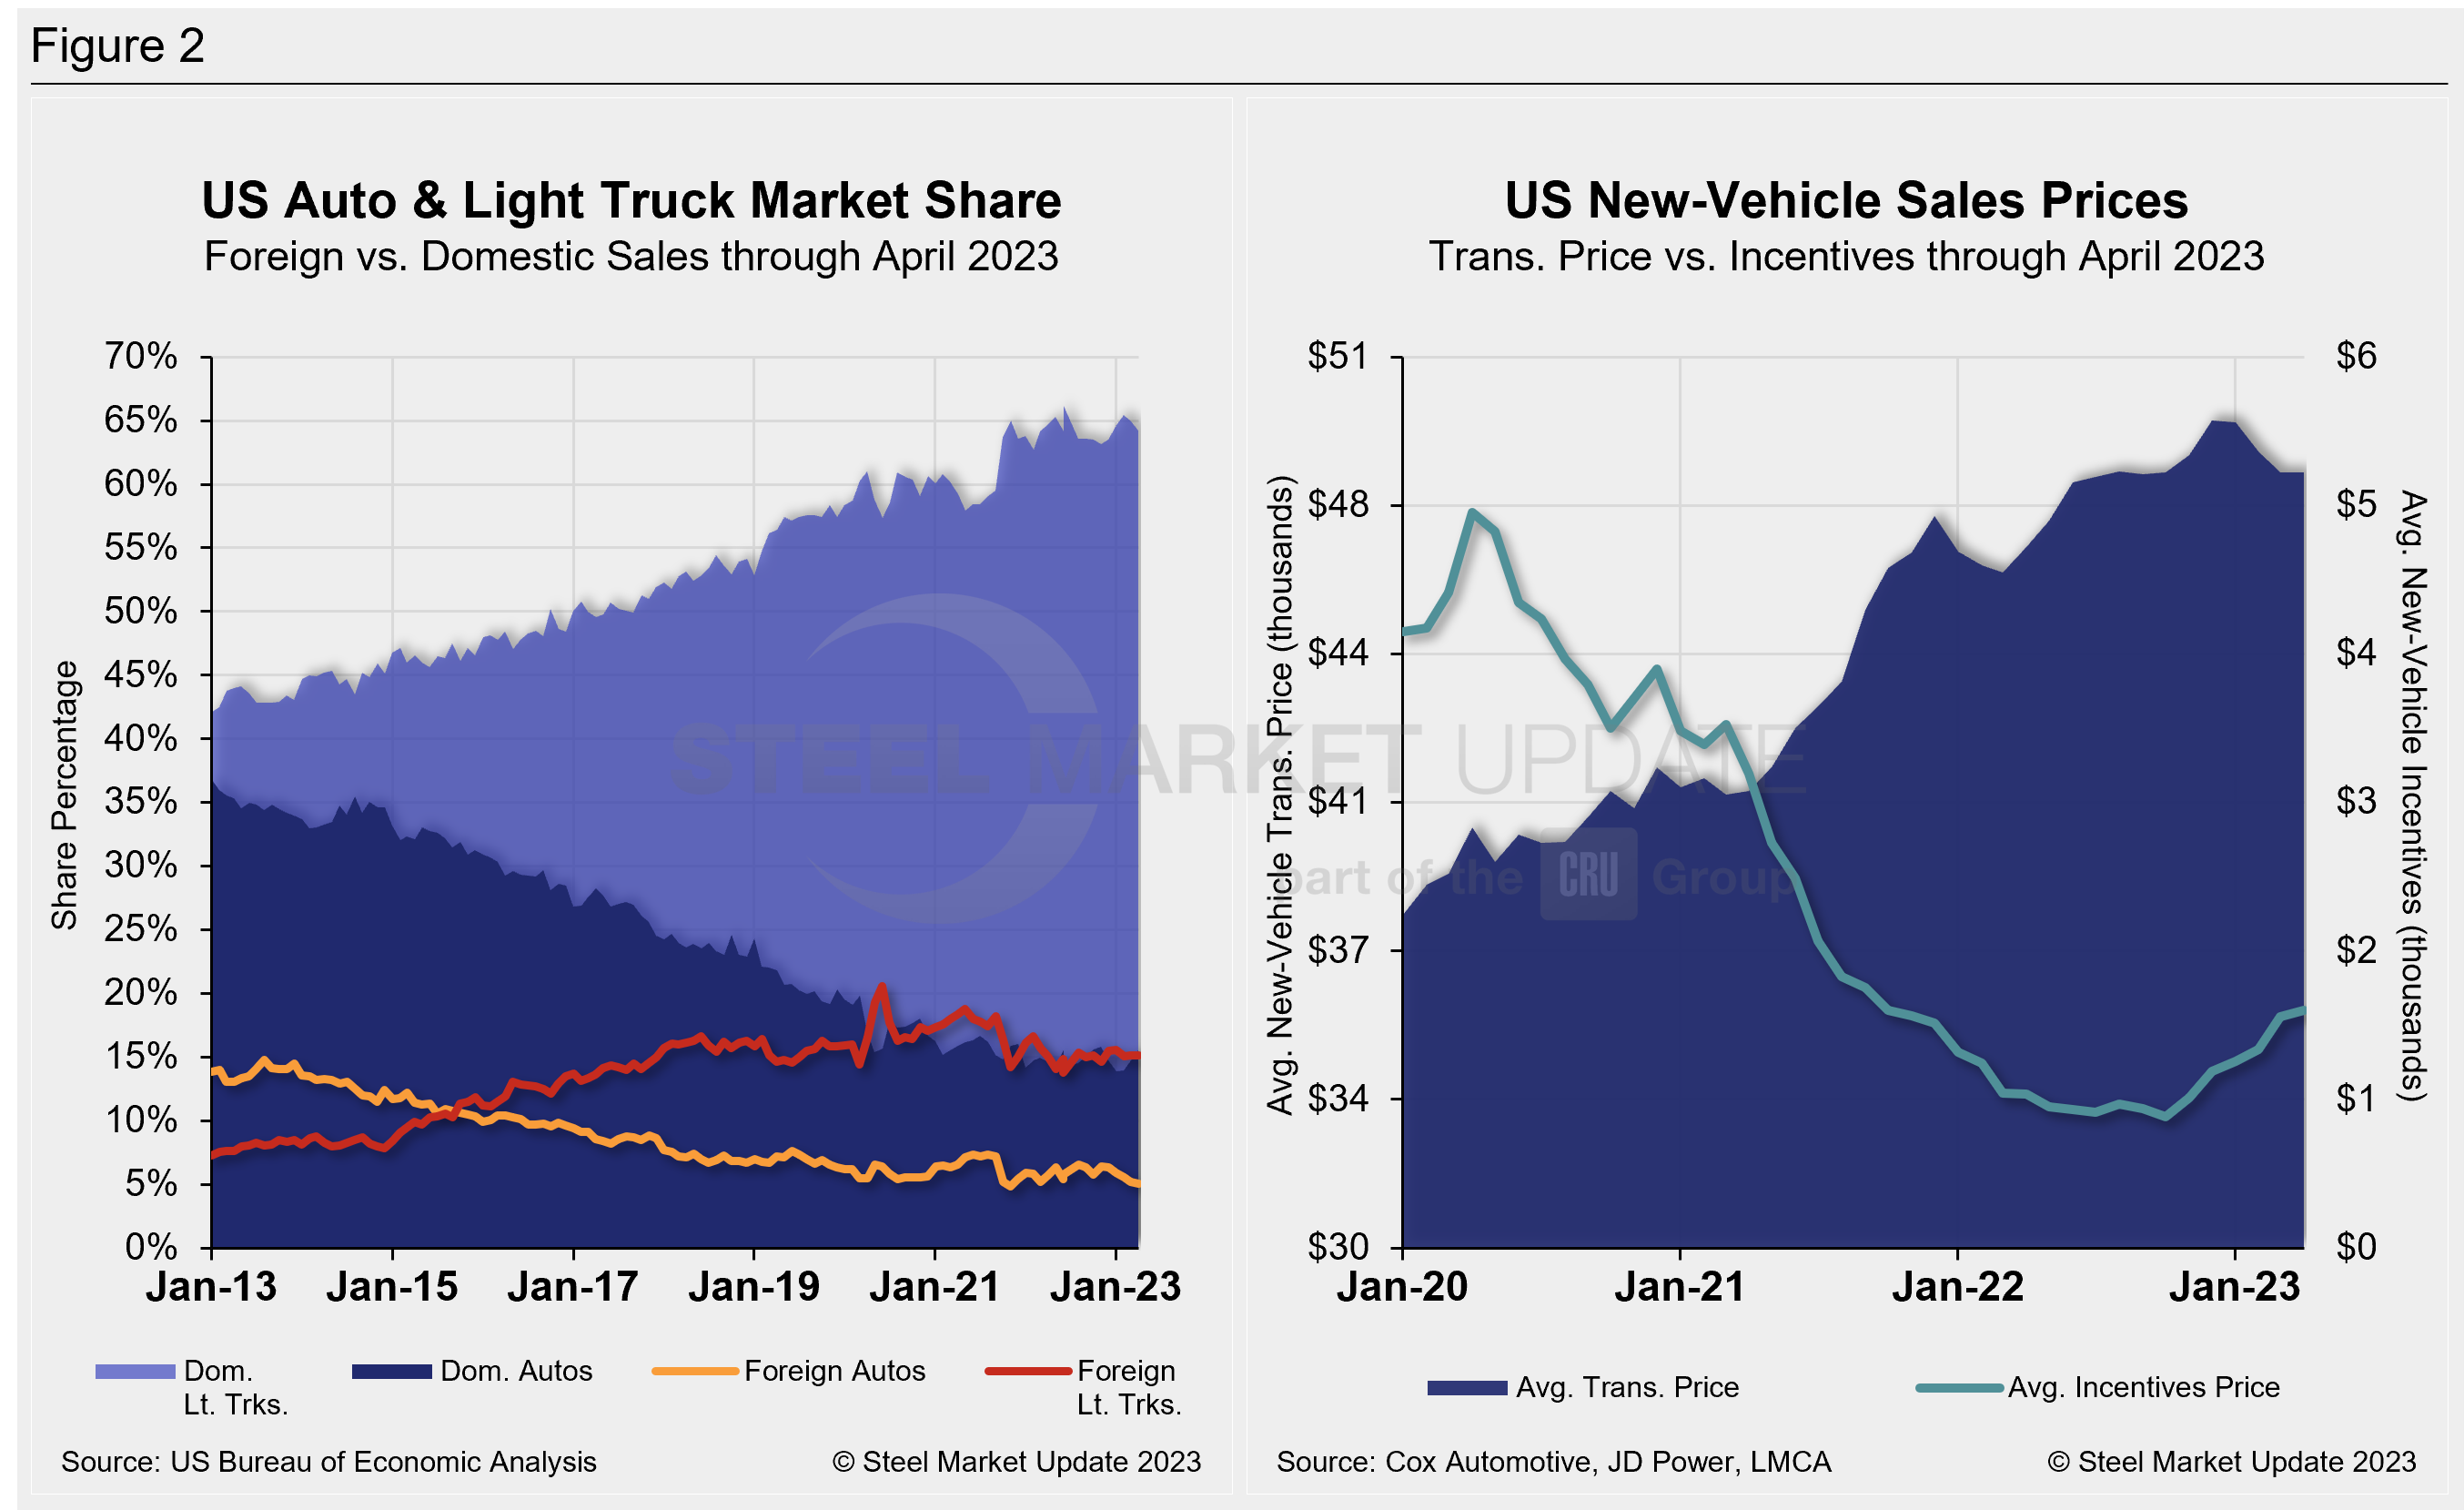
The new-vehicle average transaction price (ATP) was $48,275 in April, down for the fourth straight month after reaching an all-time high of $49,507 in December. ATPs were just 0.03% lower (-$14) in April vs. the prior month but 5.8% (+$1,749) above the year-ago period, according to Cox Automotive data.
Incentives increased again for the sixth straight month. Last month’s incentives were $1,599, up from $1,558 in March, and the highest total since October 2021. With the MoM increase, incentives remained above the $1,000 mark for the sixth time in 10 months and roughly 3.3% of the average transaction price. Incentives are up 54.6%, or $565 YoY.
In April, the annualized selling rate of light trucks was 12.637 million units, up 6.4% vs. the prior month and still 11% better YoY. Auto annualized selling rates saw similar dynamics, up 10.7% and 52.2%, respectively, in the same comparisons.
Figure 2 details the US auto and light-truck market share since 2013 and the divergence between average transaction prices and incentives in the US market since 2020.
Canadian light-vehicle sales fell in April by 5.2% to 141,000 units YoY. They were also down 9,000 units MoM. This decline could be associated with the current economic uncertainty, according to said LMC Automotive (LMCA). The selling rate fell to 1.39 million units on an annualized basis in April vs. 1.6 million units in March.
In Mexico, light-vehicle sales increased by 17.2% YoY to 97,200 units in April, while the selling rate for 2023 rose slightly to just under 1.4 million units annualized vs. 1.3 million units in March.
Editor’s Note: This report is based on data from the US Bureau of Economic Analysis (BEA), LMC Automotive, JD Power, and Cox Automotive for automotive sales in the US, Canada, and Mexico. Specifically, the report describes light vehicle sales in the US.
By David Schollaert, david@steelmarketupdate.com


