

Market Data
June 2, 2023
US Job Creation Outpaces Expectations in May
Written by David Schollaert
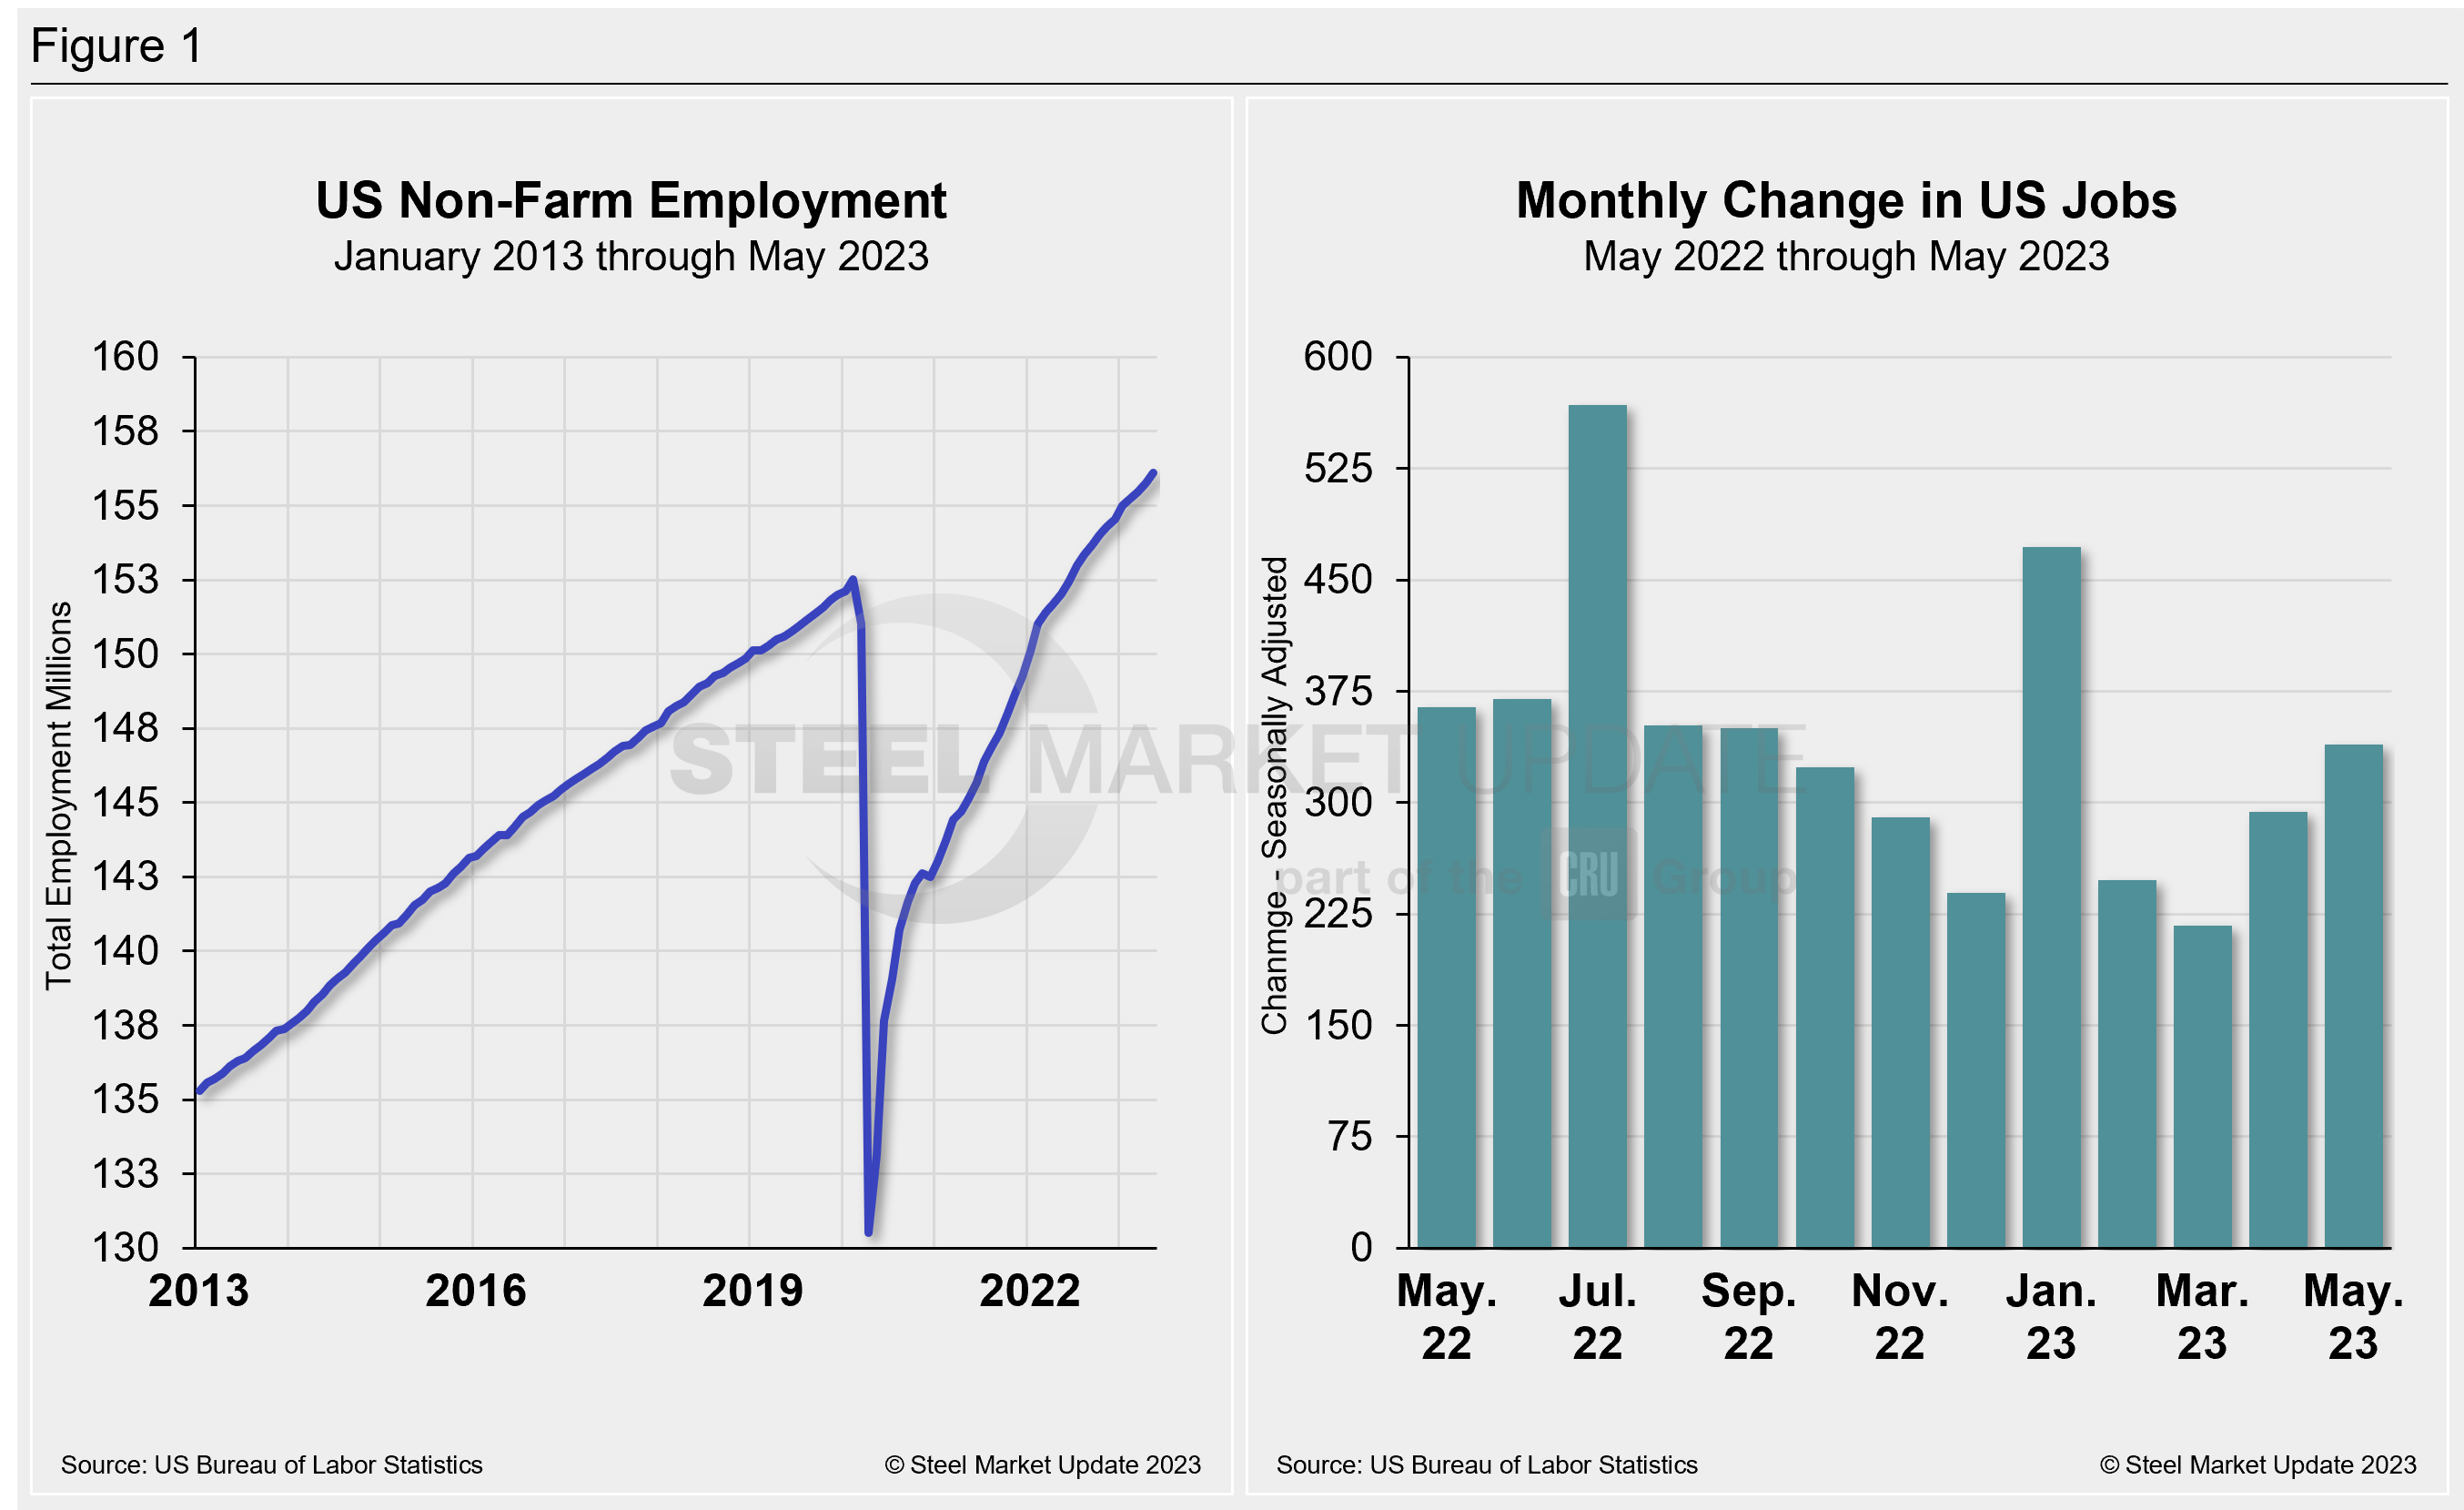
The US economy added 339,000 new jobs in May, according to data from the US Department of Labor. The labor market again outperformed economists’ consensus expectations with another show of resilience, and beating April’s total of 253,000.
May’s job growth came despite the Federal Reserve’s aggressive efforts to cool the economy to slow the labor market and tackle inflation through rate hikes. The jobless rate rose to 3.7% in May against the estimate of 3.5%, according to Labor data, even though the labor force participation rate was unchanged. The rate increase was due in large part to a decline of 369,000 in self-employment.
Despite surprisingly strong job growth across the economy last month, the gains have been narrower in recent months, with goods-producing industries slowing and services on a rapid rise.
Professional and business services drove the gains last month, followed government and leisure and hospitality – which continues to recover from the pandemic era. Construction, heavy and civil engineering, private education, and health services were also winners. The information sector continued its contraction, however, dropping 9,000 jobs.
Side-by-side in Figure 1 below is a snapshot of the pace of hiring since last May and the total number of non-farm workers employed in the US since 2013.
The number of long-term unemployed (out of work for at least 27 consecutive weeks) was little changed in November, totaling 1.2 million. That figure accounted for 19.8% of the total unemployed in the month.
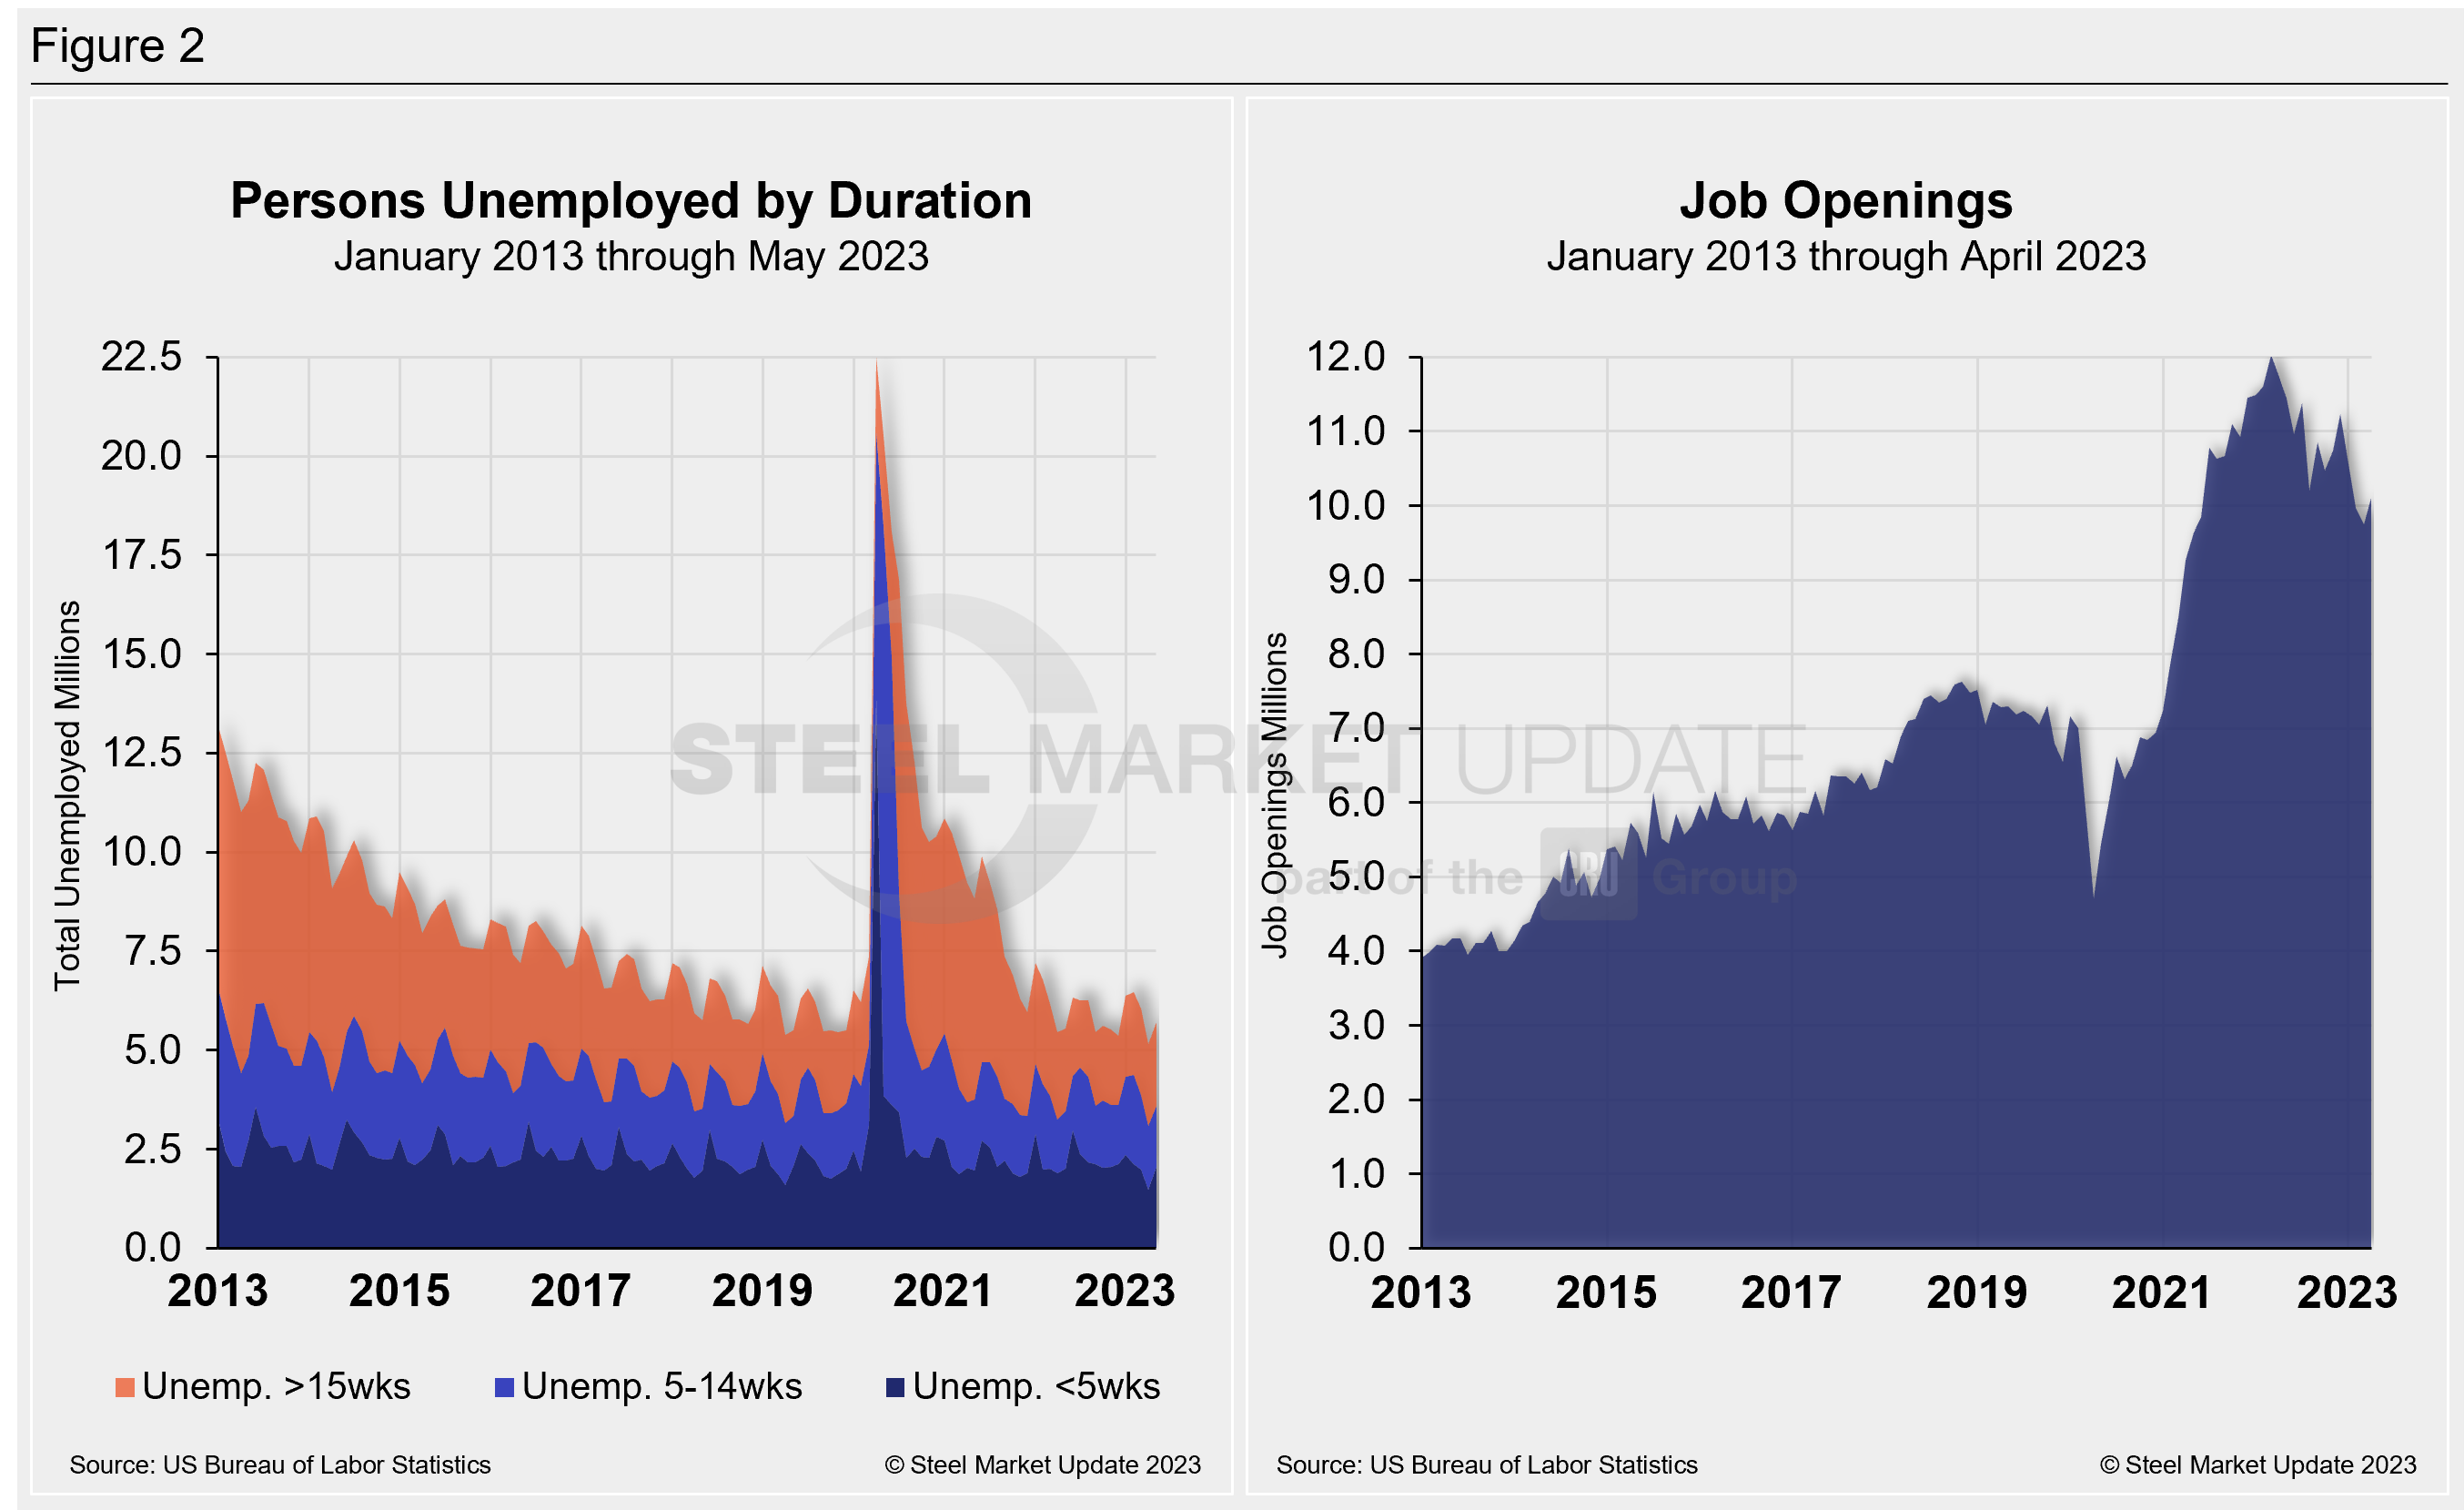
The historic picture for the duration of unemployment since January 2013 is broken down into <5 weeks, 5–14 weeks, and >15 weeks in Figure 2. The total number of jobless jumped to 5.7 million at the end of May, and a boost of 554,000 to the unemployment line.
Despite the loss, May’s results show that nearly 16.8 million more people now have jobs compared to the 22.5 million thrown out of work during the worst of the pandemic in April 2020. As of June 2, 37% had been unemployed for more than 15 weeks, 27% for 5 to 14 weeks, and 36% for less than five weeks.
As part of May’s employment report, the Labor Department released its monthly report on job openings, layoffs, and quitting through the last day of April. Also known as the “JOLTS” report, the data indicates how much demand there is for workers in the US economy and the extent to which employers are still struggling with labor shortages more than two years removed from the worst of the pandemic.
April’s job openings rose month-on-month (MoM) after edging lower the month before. The report suggests that workers remain in high demand and are still quitting more often. There were about 10.1 million job openings in April — 358,000 more openings than in March but nearly 2 million fewer than the record of 12.03 million set last March.
The charts below (Figure 2) detail the total persons unemployed by duration from 2013 through April 2023 and the total job openings over the same period.
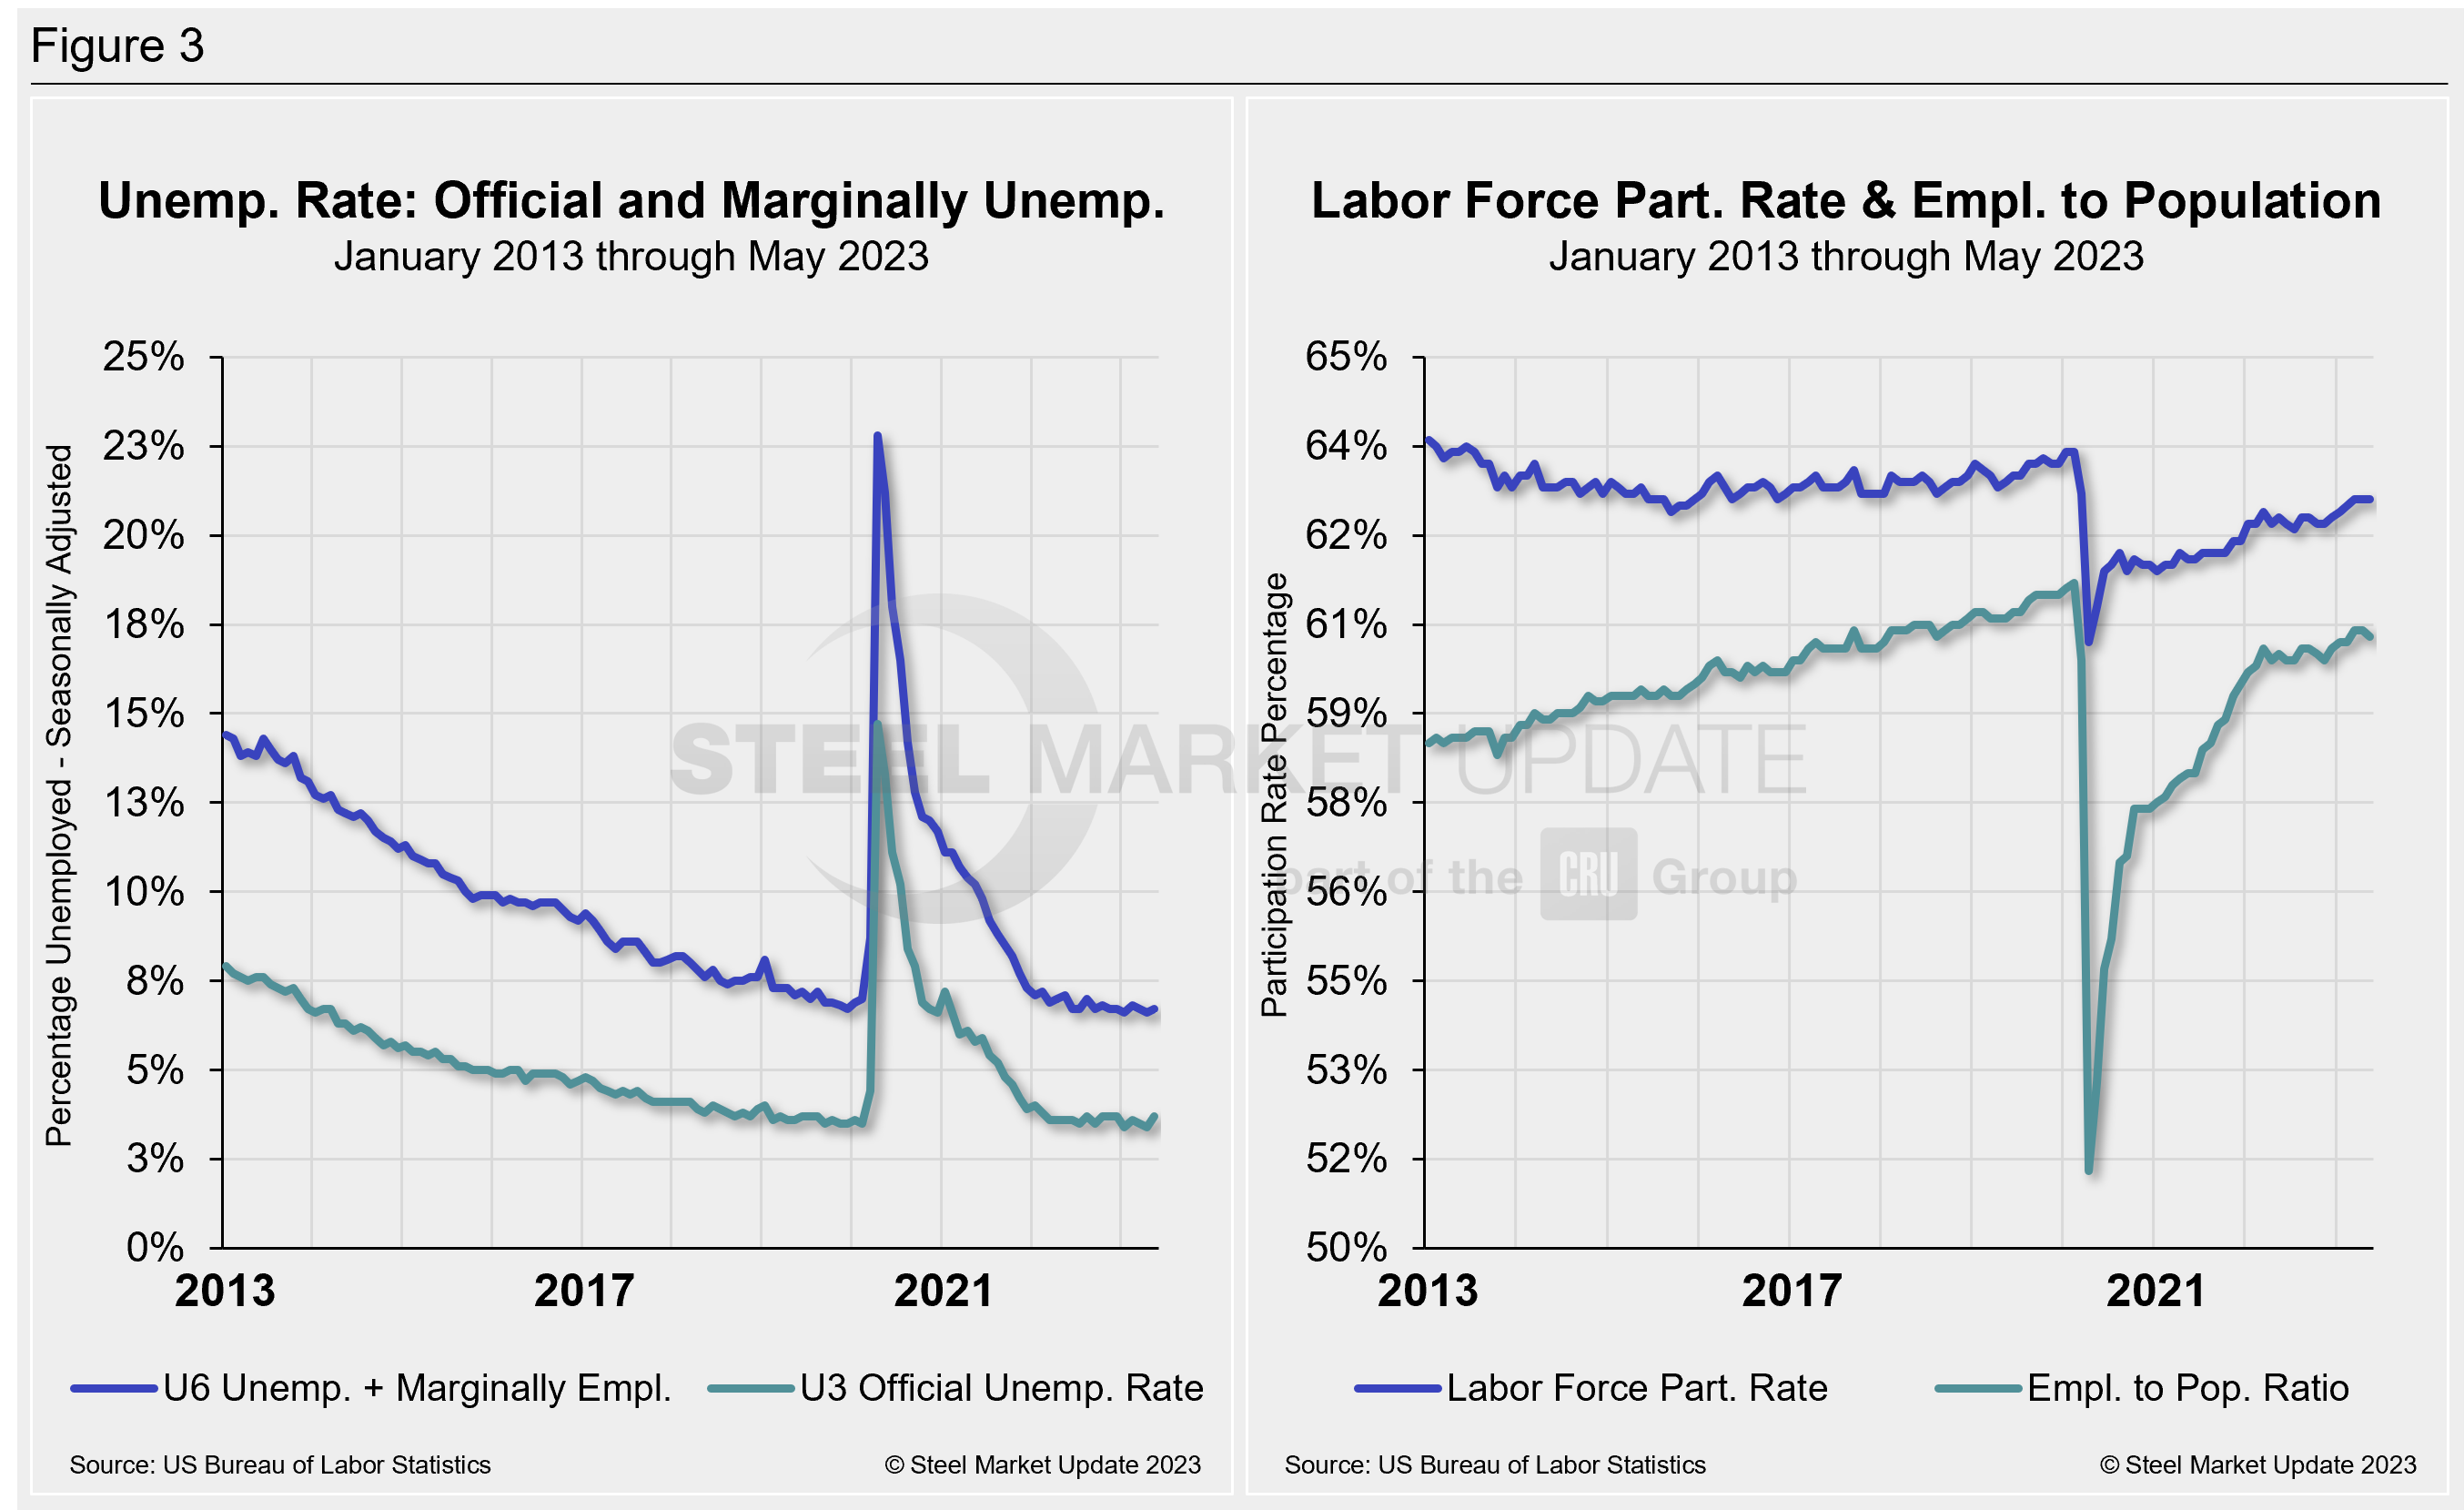
The official unemployment rate, known as U3, reported in the Bureau of Labor Statistics Household survey (see explanation below), increased from 3.5% in February 2020 to 14.7% in April 2020 as the pandemic brought the economy to a halt. A steady decrease followed, with the measure fluctuating in the mid-3% over the past year. May’s results came in at 3.7%, up 0.3% MoM.
A more encompassing view of unemployment (U6) that includes those holding part-time jobs for economic reasons, as well as discouraged workers not looking for jobs, was 6.7% in May, up marginally from 6.6% in April.
Another gauge, and a more definitive view, are the number employed as a percentage of the population. Last month, the employment-to-population ratio was 60.3%, down 0.1 percentage point vs. April.
Figure 3 details side-by-side parallels of the unemployment rate (both the U3 and U6 rates) since 2013 as well as the labor force participation rate and employment-to-population ratio over the same period.
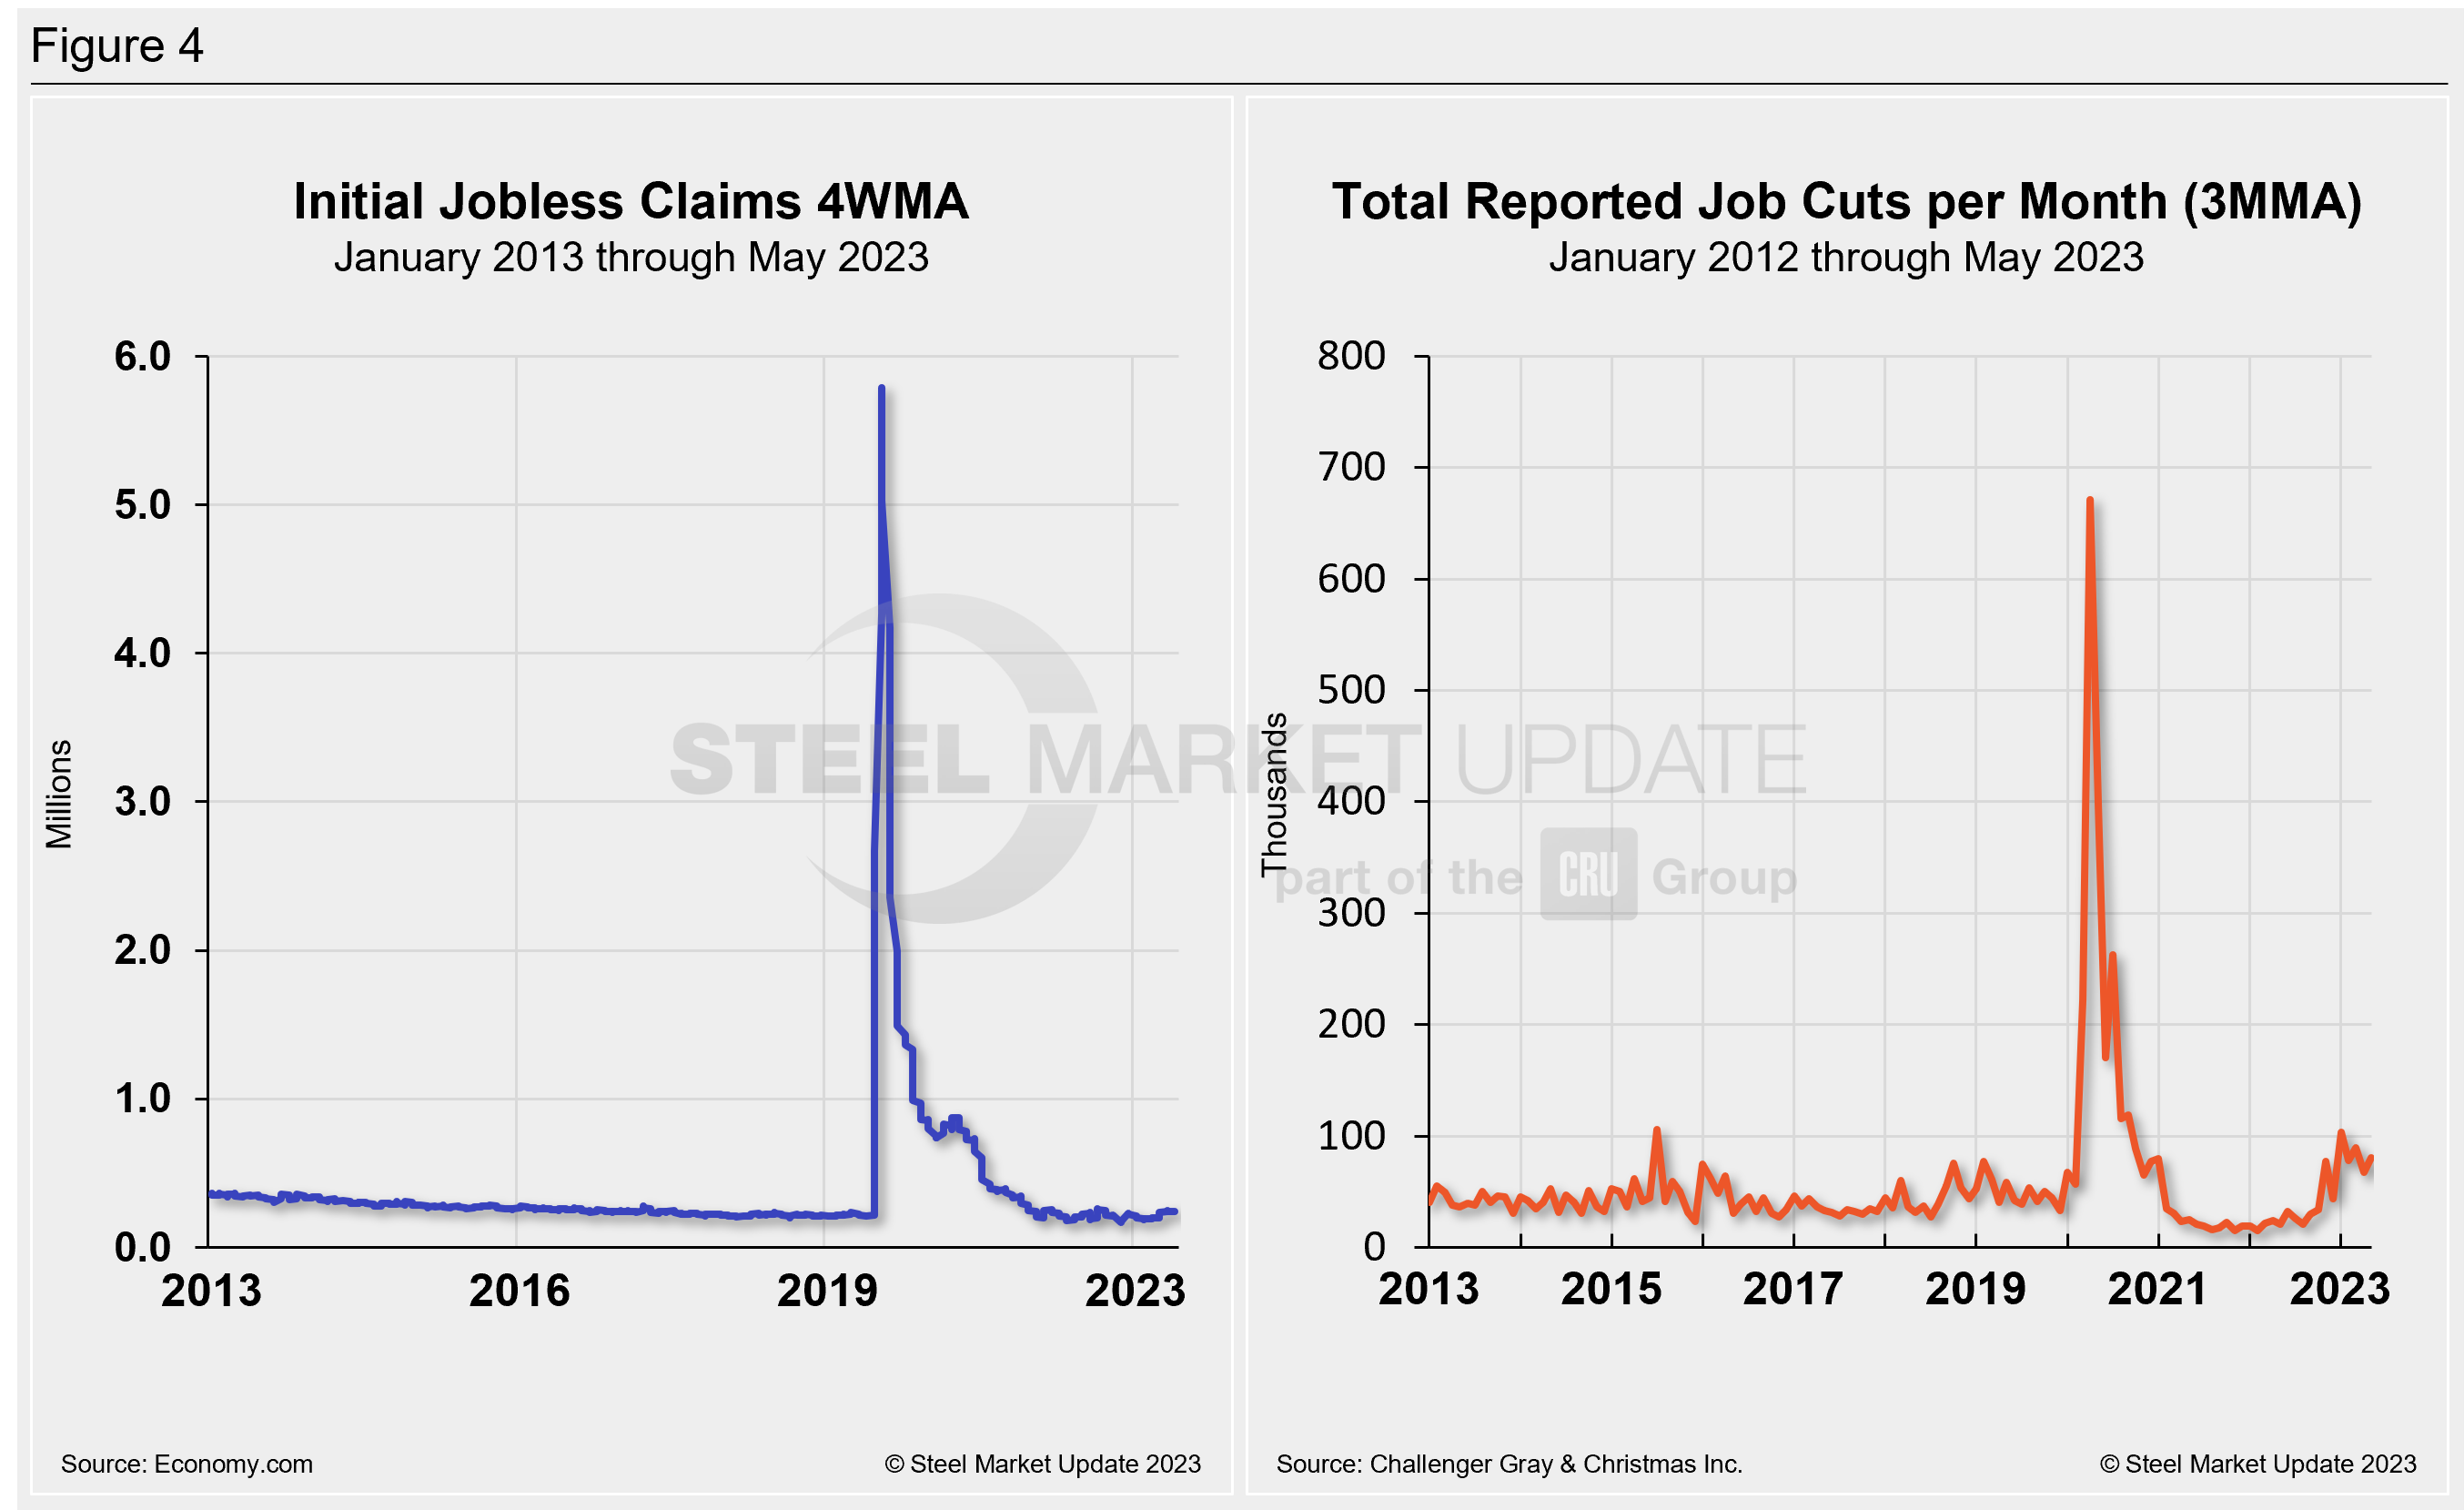
Initial claims for unemployment insurance, which are reported weekly by the Department of Labor, were largely sideways in the week ended May 27, totaling 232,000 but up by 2,000 new claims MoM. While there have been some significant revisions of late, claims have ultimately been flat after rising in February and March, the Department of Labor said.
The four-week moving average was 229,500 in the week ended May 27, down 2,500 from the previous week. Continuing claims rose 6,000 week-over-week to 1.8 million in the week ended May 20, Economy.com reported.
Human resources consulting firm Challenger, Gray, and Christmas Inc. produces a monthly employment update for the US. It reported that job cuts in May totaled 80,089 — an increase of 20% from the 66,995 announced the previous month. May’s total is 287% higher than the same year-ago period when just 20,712 cuts were announced.
Year-to-date (YTD), employers announced 417,828 cuts, up a whopping 315% from the 100,694 cuts announced through the same period in 2022. It is the highest January-May total since 2020, when 1,414,828 cuts were recorded, the report said.
“Consumer confidence is down to a six-month low and job openings are flattening,” said Challenger. “Companies appear to be putting the brakes on hiring in anticipation of a slowdown.”
Except for education, government, industrial manufacturing, and utilities, every industry has seen an increase in layoffs this year, the report said. Cuts were again widespread in May. Technology companies led in job cut announcements last month, with 22,887, bringing total cuts YTD to 136,831, a 2,939% year-over-year surge in the sector. Other cuts included retailers, automotive, financial firms, and healthcare.
Figure 4 shows the four-week moving average of new claims since January 2013, seasonally adjusted. It also shows the total reported job cuts per month, according to Challenger, on a three-month moving average.
Explanation: On the first Friday of each month, the Bureau of Labor Statistics releases the employment data for the previous month. Data is available at www.bls.gov. The BLS reports on the results of two surveys. The Establishment survey reports the actual number employed by industry. The Household survey reports on the unemployment rate, participation rate, earnings, average workweek, the breakout into full-time and part-time workers and lots more details describing the age breakdown of the unemployed, reasons for and duration of unemployment.
By David Schollaert, david@steelmarketupdate.com


