

Analysis

June 19, 2023
North American Auto Assemblies Recover in May
Written by David Schollaert
North American auto assemblies saw nearly an 11% boost in May, posting the second-best monthly total year to date. The month’s assemblies were also nearly 18% higher year-on-year (YoY), according to LMC Automotive data.
A modest decline was seen in supply levels in April, but that easing was in part due to seasonal factors and was not expected to last. The dynamic indeed was a short stall as auto production rose in May and is seen likely gaining more ground in the coming months on improved supply chains.
While increased vehicle availability rose in May and should continue to support sales moving forward, demand might be affected should economic headwinds build.
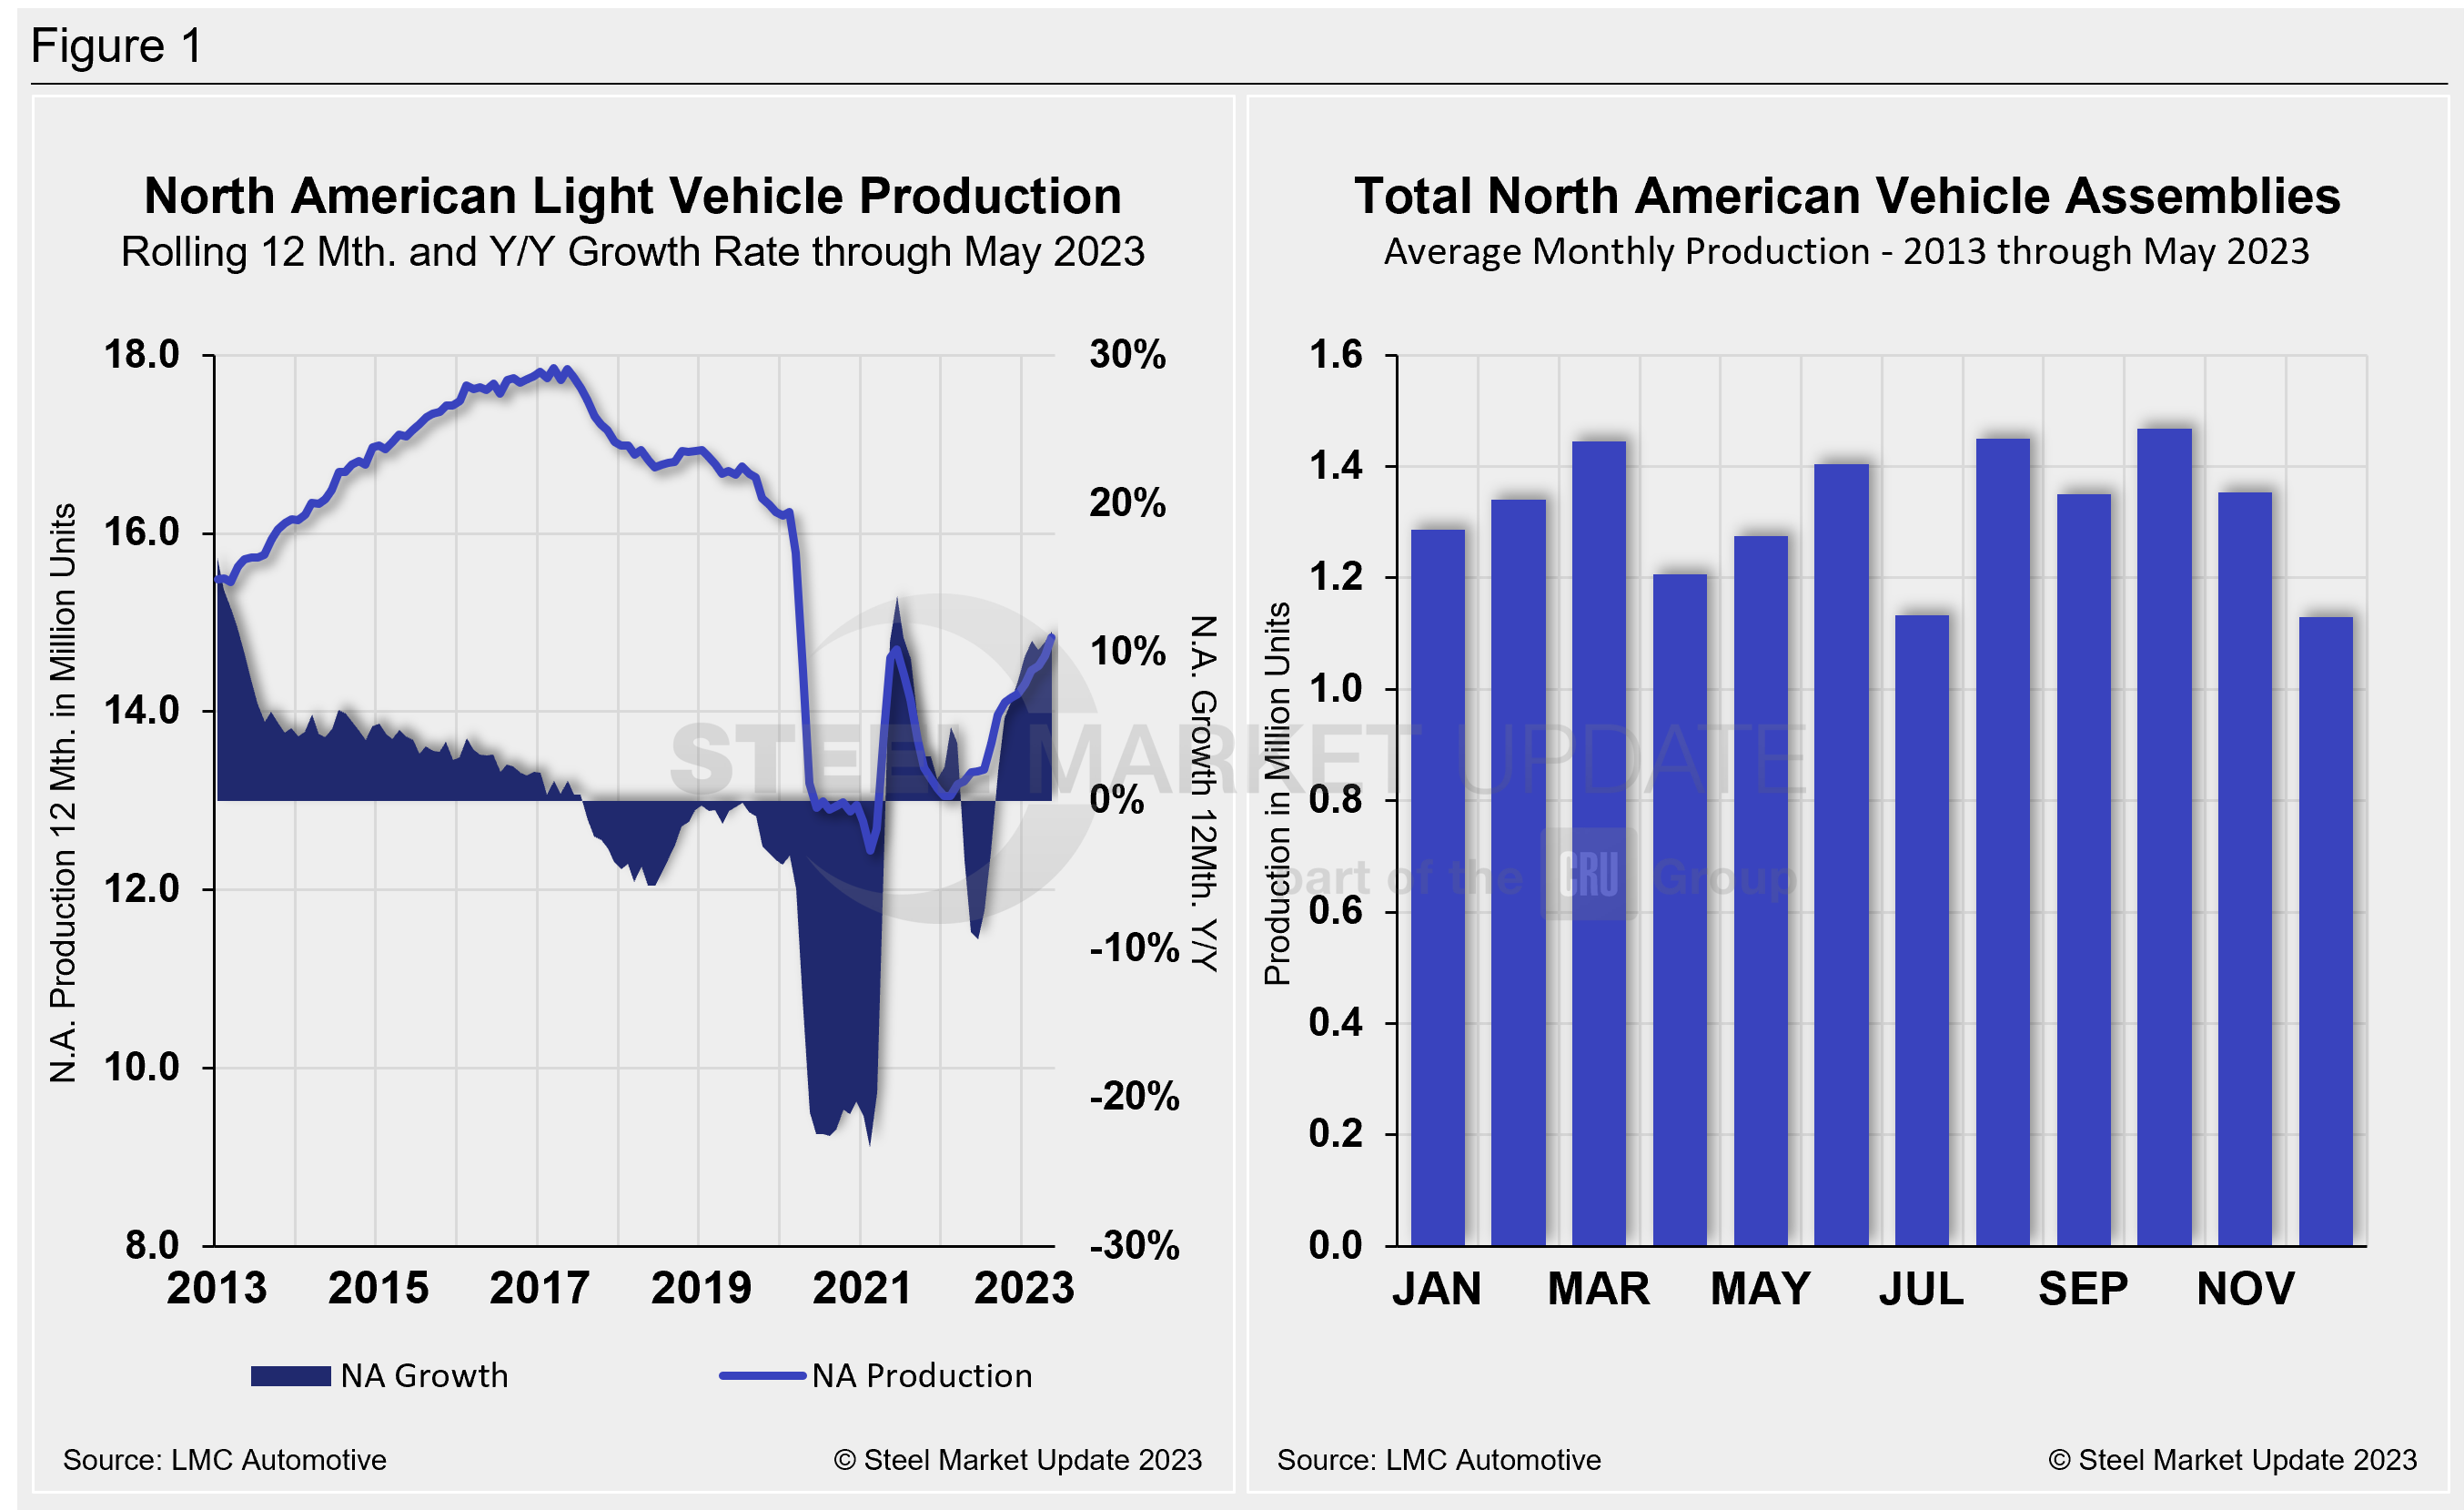
North American vehicle production, including personal and commercial vehicles, totaled 1.37 million units in May, up from 1.22 million units in April, and was 17.8% ahead of the 1.16 million produced one year ago.
Below in Figure 1 is North American light-vehicle production since 2013 on a rolling 12-month basis with a YoY growth rate. Also included is the average monthly production, which includes seasonality since 2013.
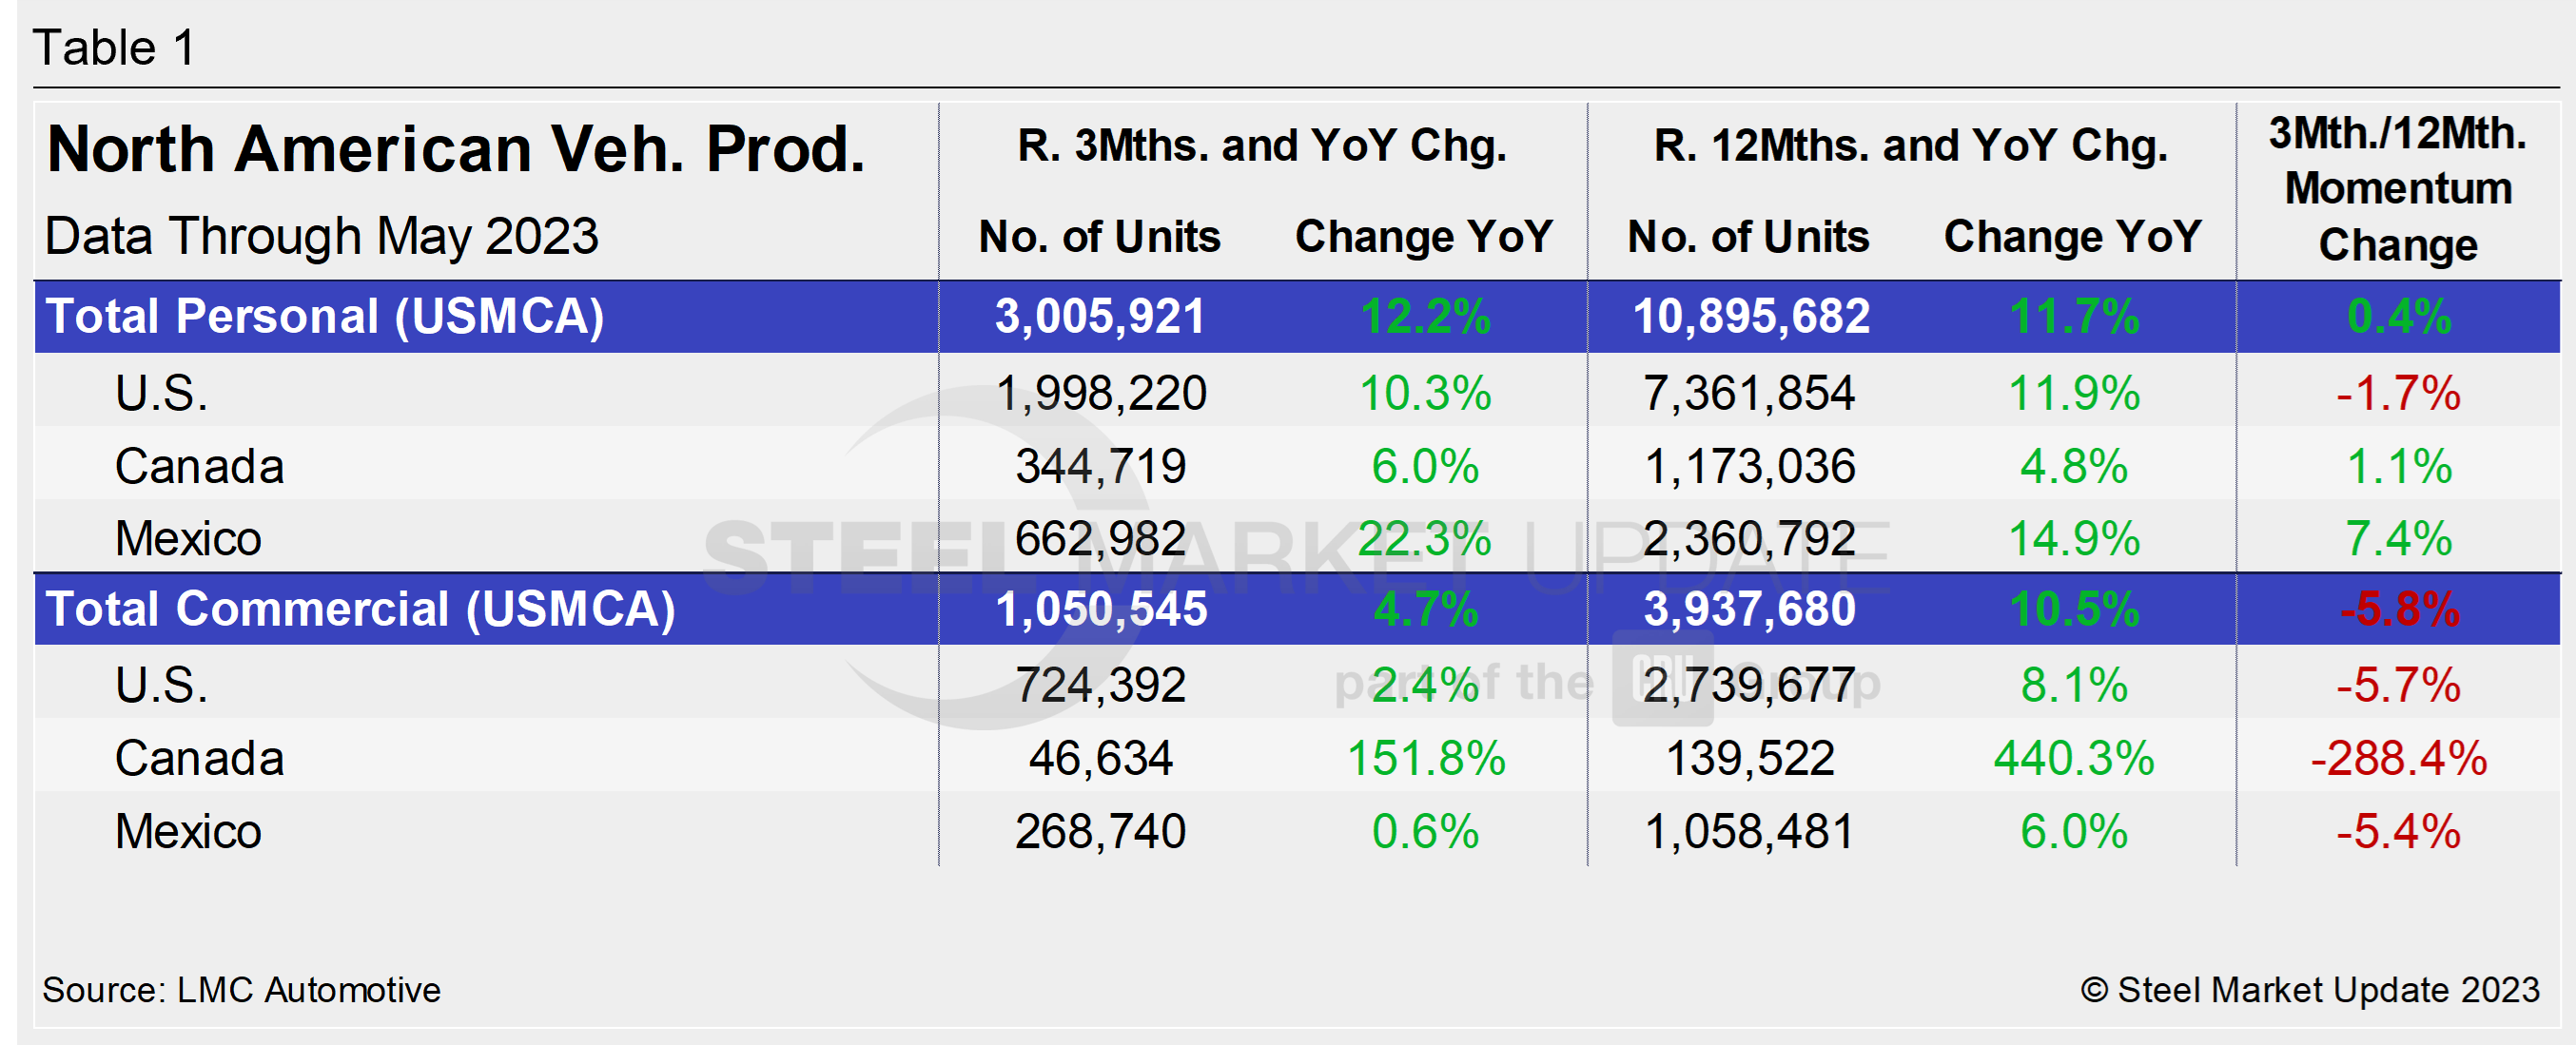
A short-term snapshot of assembly by nation and vehicle type is shown in the table below. It breaks down total North American personal and commercial vehicle production into US, Canadian, and Mexican components. It also includes the three- and 12-month growth rates for each and their momentum change.
Through last September, growth rates for personal and commercial light vehicles were -25.8% and -8.4%, respectively. They have since recovered nicely, with both posting steady gains.
For the three months through May, the growth rate for total personal and commercial vehicle assemblies in the USMCA region is up. When comparing it to 12-month basis totals, results are mixed. While personal production is up marginally, commercial assemblies are still behind by nearly 6%. YoY comparisons are up by double-digits, however.
Personal Vehicle Production
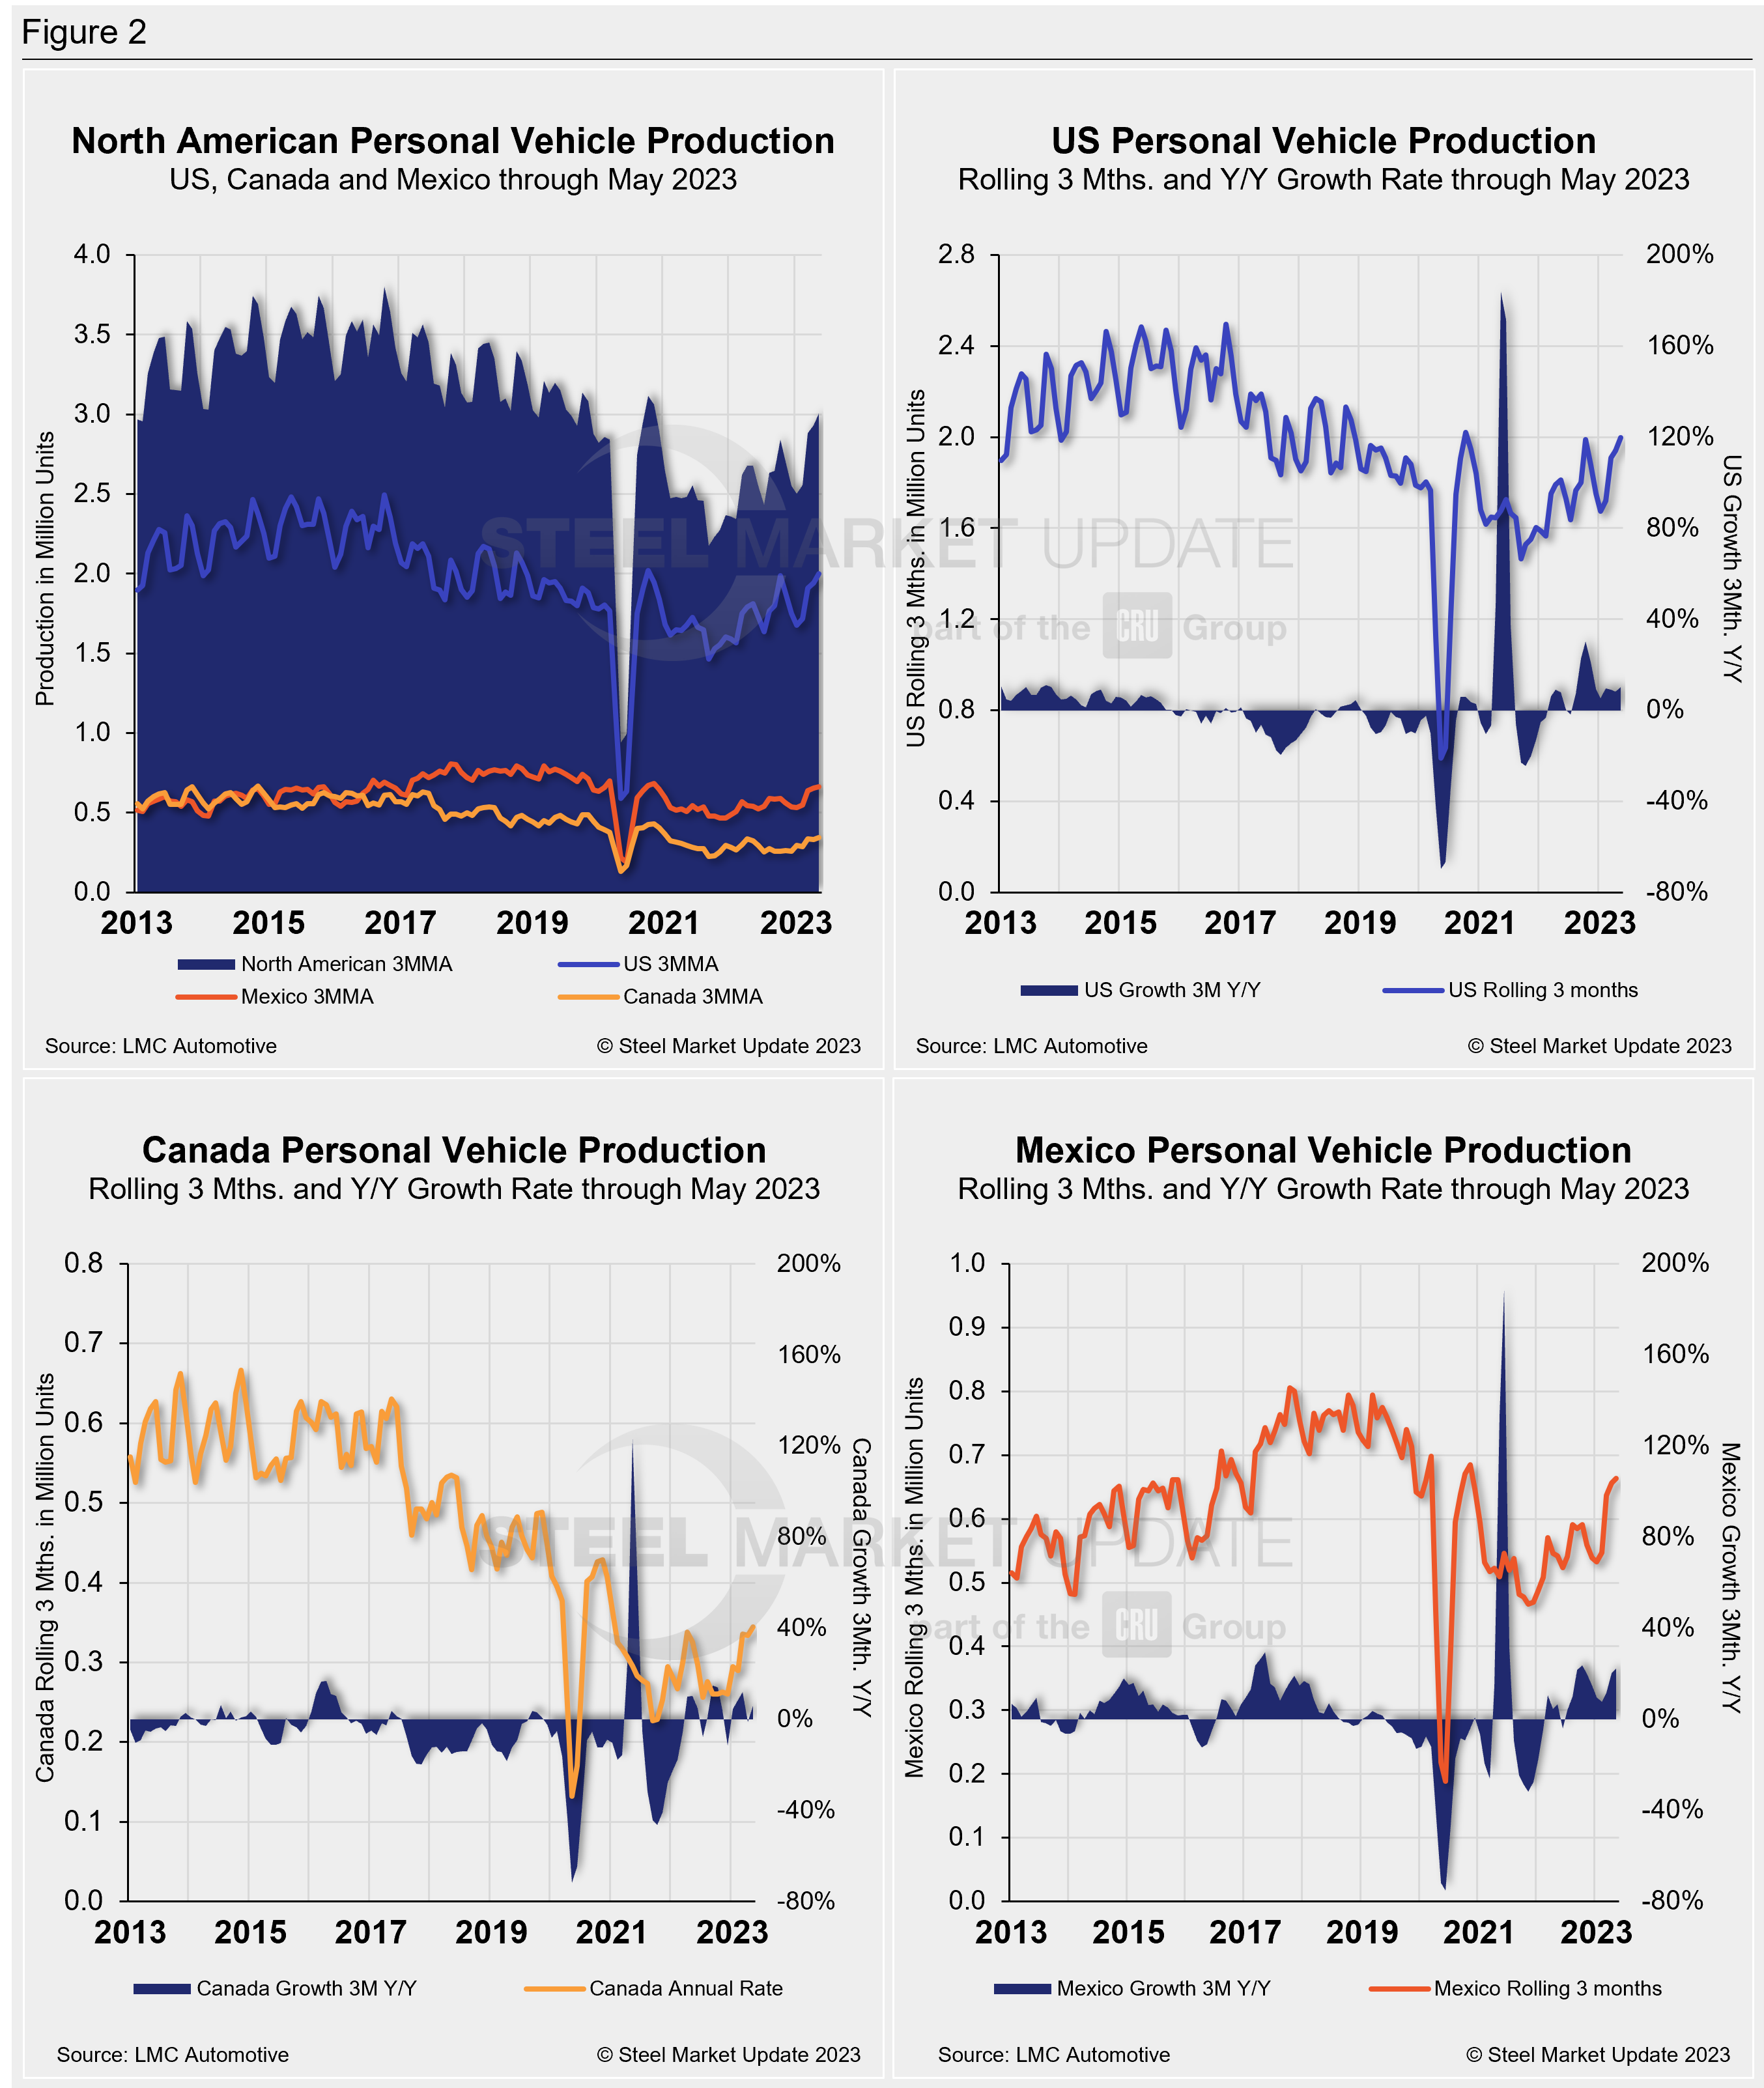
The longer-term picture of personal vehicle production across North America is shown below. The charts in Figure 2 show the total personal vehicle production for North America and the total for the US, Canada, and Mexico.
In terms of personal vehicle production, the region saw a month-over-month (MoM) increase in May, up 10.3% after declining by 17% the month prior. The result was also a 23% boost vs. the period one year ago.
The US saw the largest increase in both units produced and percentage gain in May vs. April, up 69,483 units (+11.3%). It was followed by Mexico, up 14,347 units (+7.3%), while Canada produced 10,554 more units (+10.3%) MoM.
Production share across the region was largely unchanged. The US and Canada saw personal vehicle production share of the North American market edge up marginally to 66.5% and 11.5%, respectively. Mexico saw its share slip 0.4 percentage points, to 22.1%.
Commercial Vehicle Production
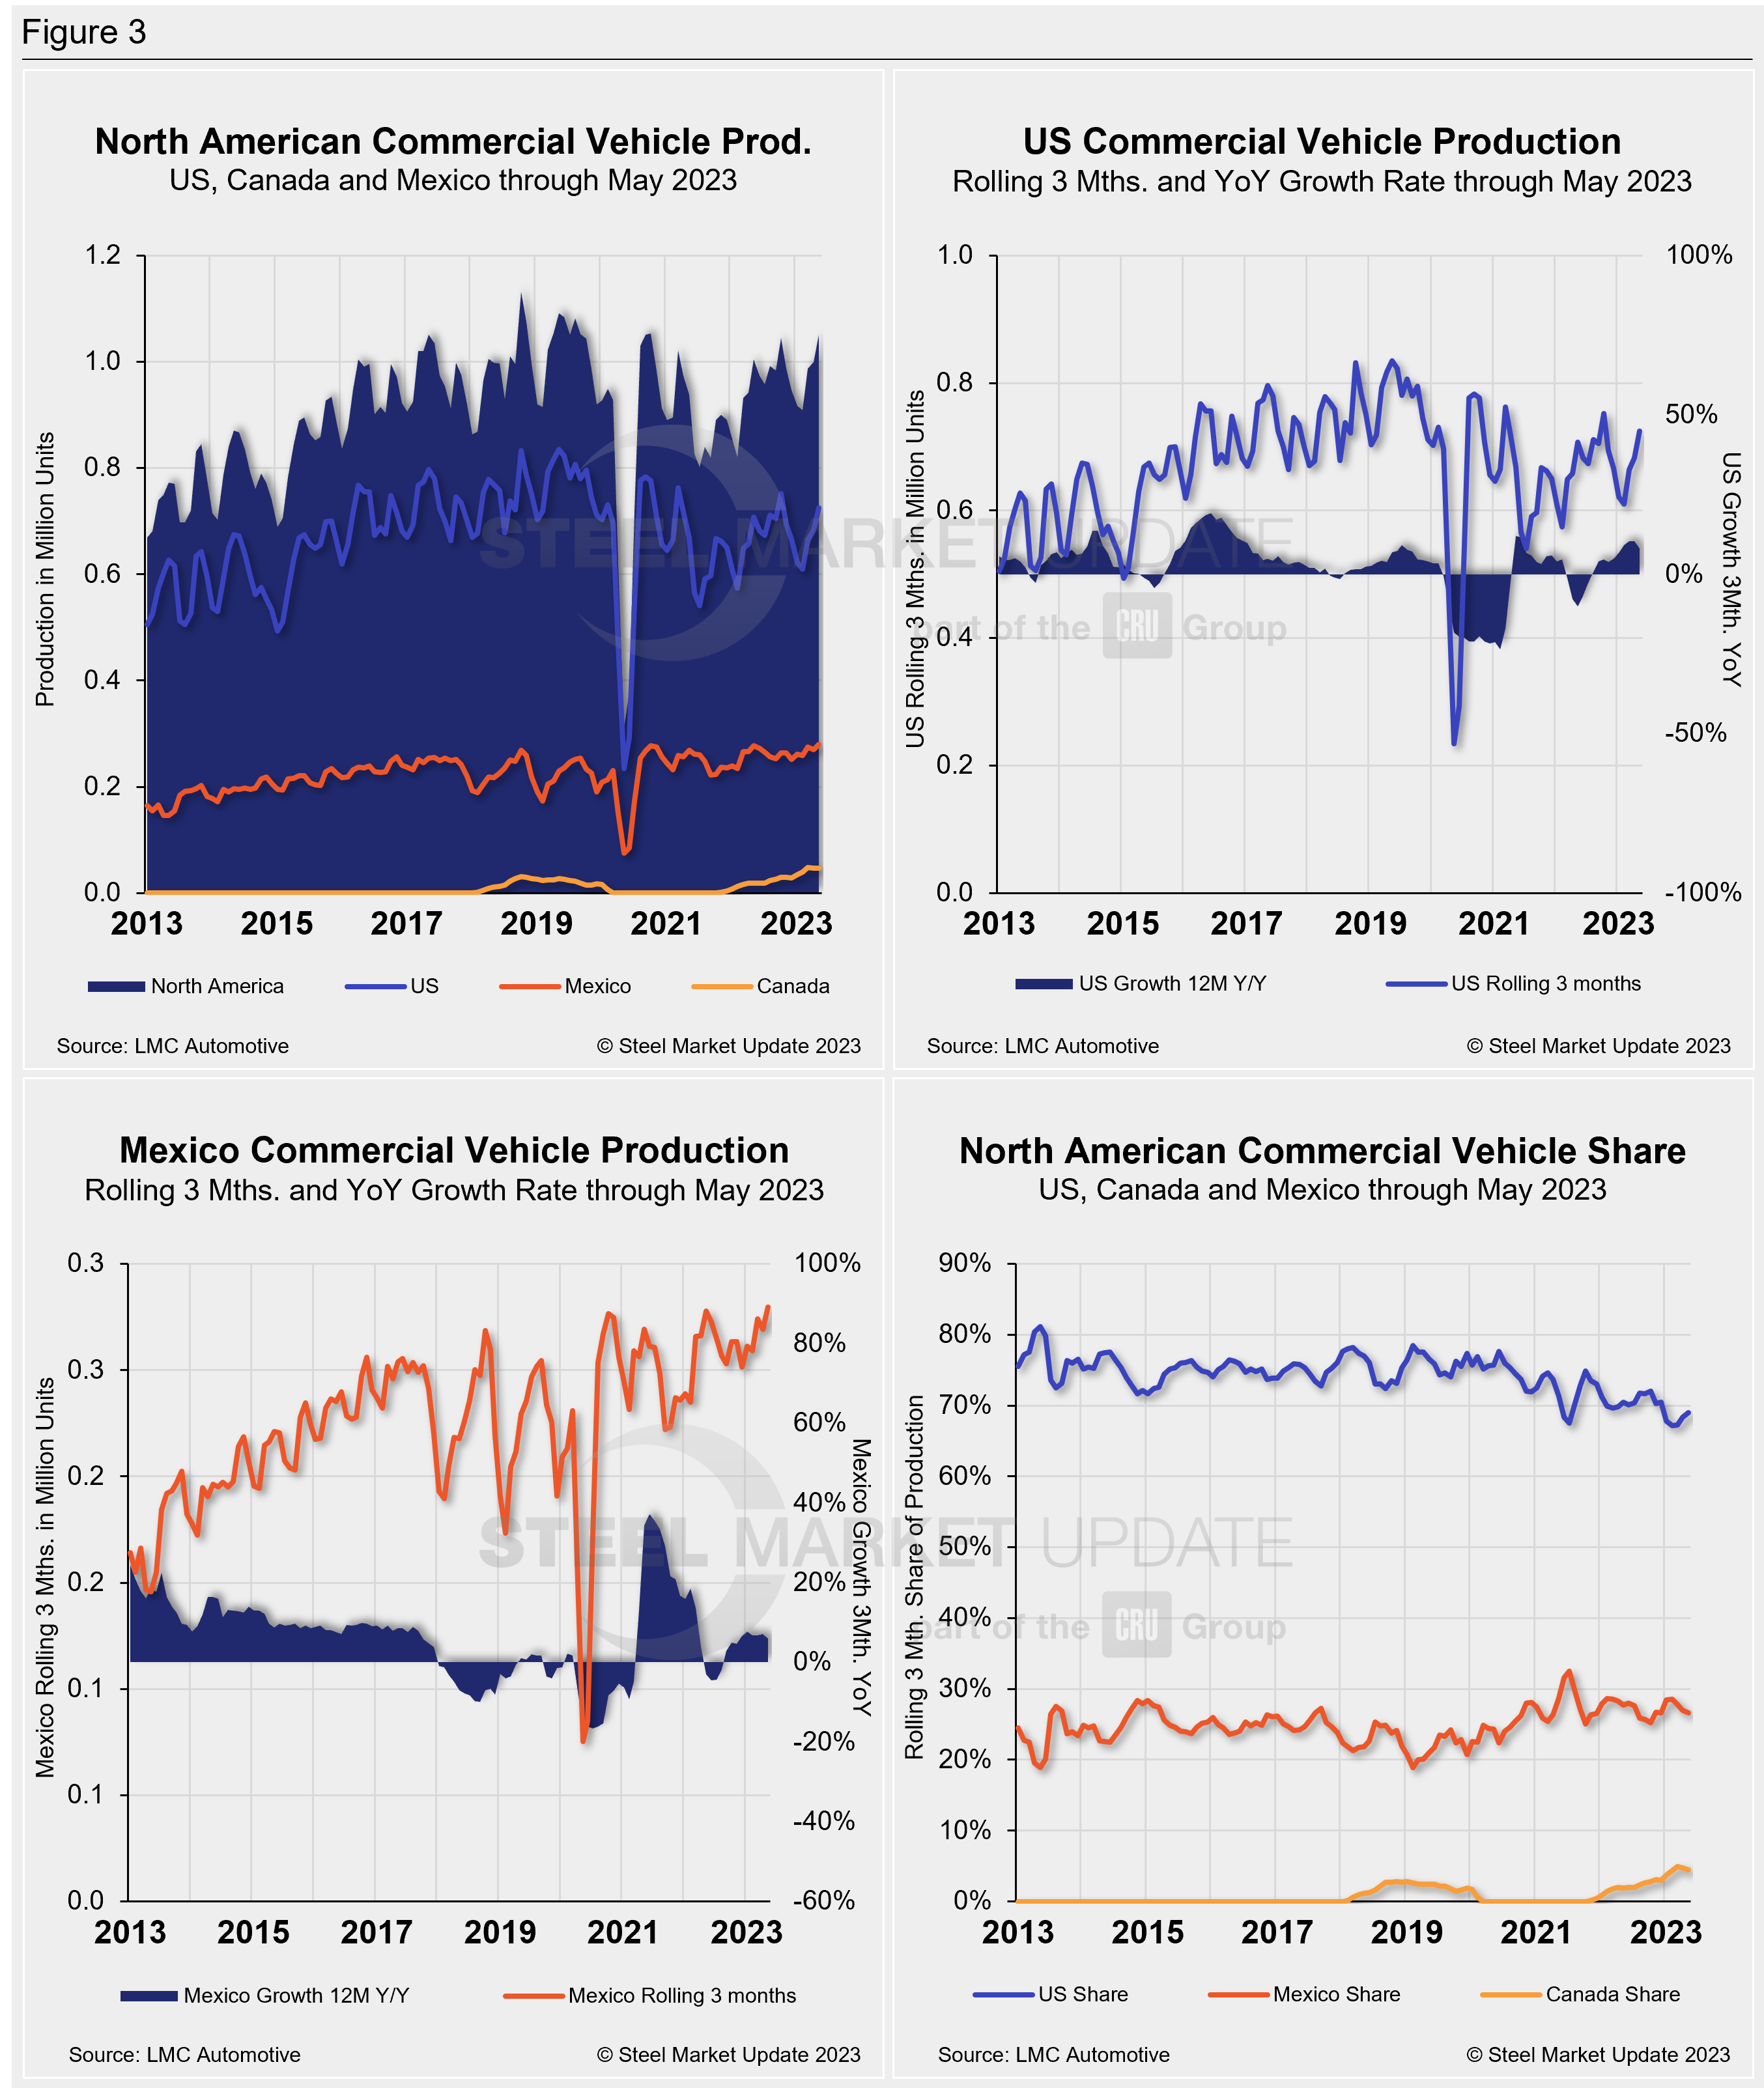
Total commercial vehicle production for North America and the total for each nation within the region are shown in the first chart in Figure 3 on a rolling three-month basis. Commercial vehicle production in the US and Mexico and their YoY growth rates, as well as the production share for each nation in North America, are also shown.
Canada produced 15,078 light commercial vehicles in May, a 7.6% increase from April’s 14,016 total units. May marked Canada’s 19th straight month of commercial vehicle assemblies after ceasing production for nearly two years from Jan. 2020 through Oct. 2021.
North American commercial vehicle production was up 11.4% in May with a total of 362,364 units produced during the month, an increase of 37,135 units MoM. The gain was driven by the US, which saw a 15.2% boost in commercial vehicle assemblies in May, producing 33,009 more vehicles MoM. Canada’s increase was followed by a 3.3% gain in Mexico, which produced 3,054 more vehicles over the same period.
The overall increase put the commercial production growth rate at 4.7% for the region last month, down from 6.1% in April.
The market share across the region was largely unchanged. The US was up six percentage points, with a total share of 69%, followed by Mexico with a 26.6% share, and Canada with at 4.4% share in May.
Presently, Mexico exports just under 80% of its light-vehicle production, with the US and Canada the highest-volume destinations.
Editor’s Note: This report is based on data from LMC Automotive for automotive assemblies in the US, Canada, and Mexico. The breakdown of assemblies is “Personal” (cars for personal use) and “Commercial” (light vehicles less than 6.0 metric tons gross vehicle weight rating; heavy trucks and buses are not included).
By David Schollaert, david@steelmarketupdate.com


