Market Data
November 28, 2023
SMU survey: Steel Buyers Sentiment Indices rise
Written by Ethan Bernard
SMU’s Current and Future Steel Buyers Sentiment Indices have both increased, based on our most recent survey data as of Wednesday, Nov. 22.
Every other week, we poll steel buyers about sentiment. The Steel Buyers Sentiment Indices measure how steel buyers feel about their companies’ chances of success in the current market, as well as three to six months down the road. (We have historical data going back to 2008. Check out our interactive graphing tool here.)
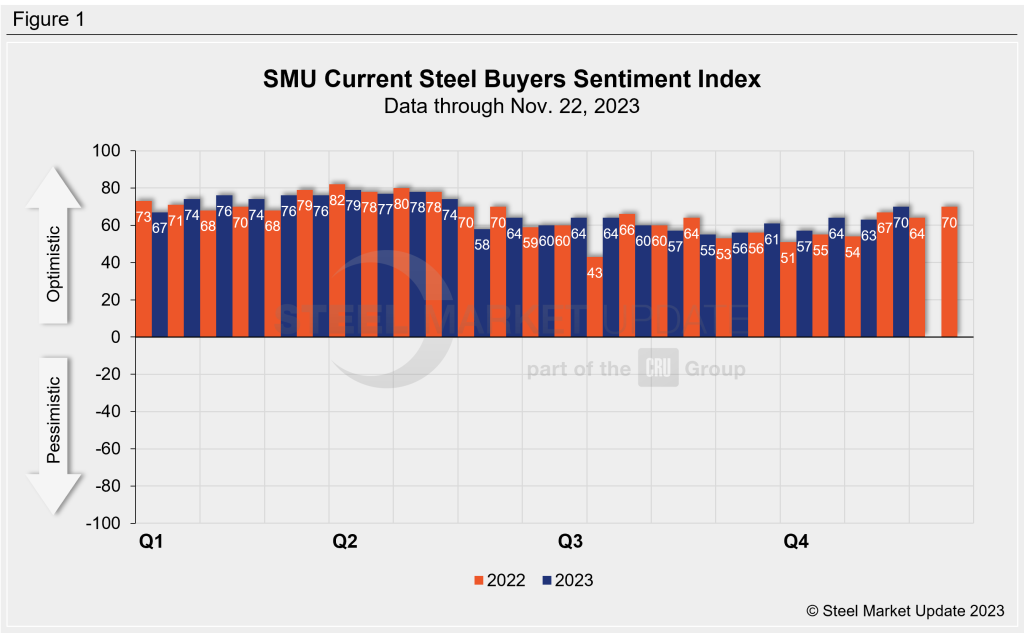
SMU’s Current Buyers Sentiment Index stood at +70 as of last week, up seven points from +63 two weeks earlier (Figure 1). On the eve of the (now concluded) United Auto Workers (UAW) union strike on Sept. 14 the reading was +56.
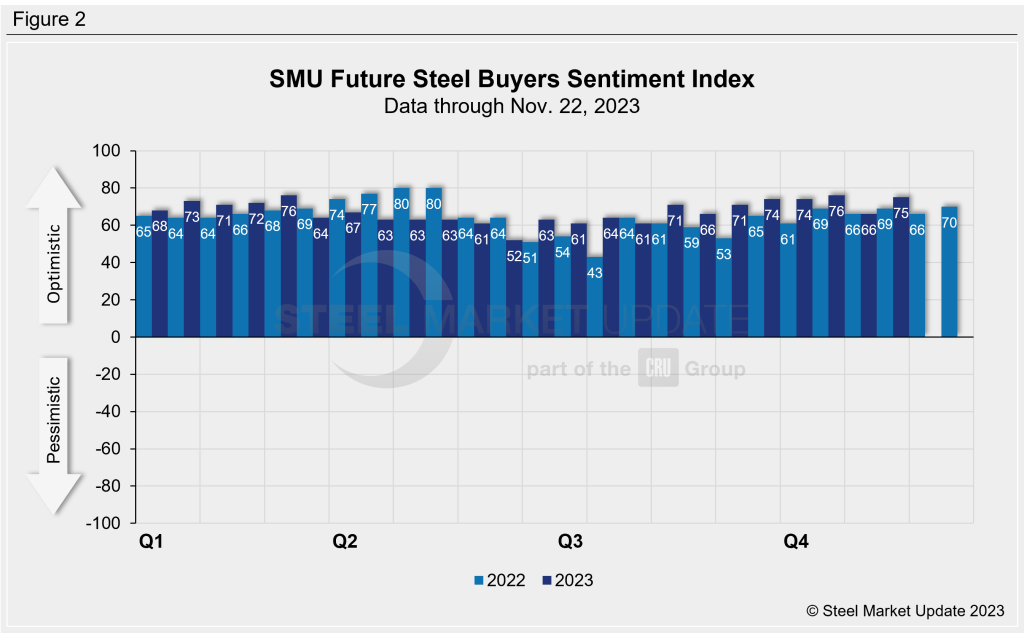
SMU’s Future Buyers Sentiment Index measures buyers’ feelings about business conditions three to six months in the future. Last week, the index jumped nine points from our prior market check to +75 (Figure 2). This is the highest reading since early March when it stood at +76.
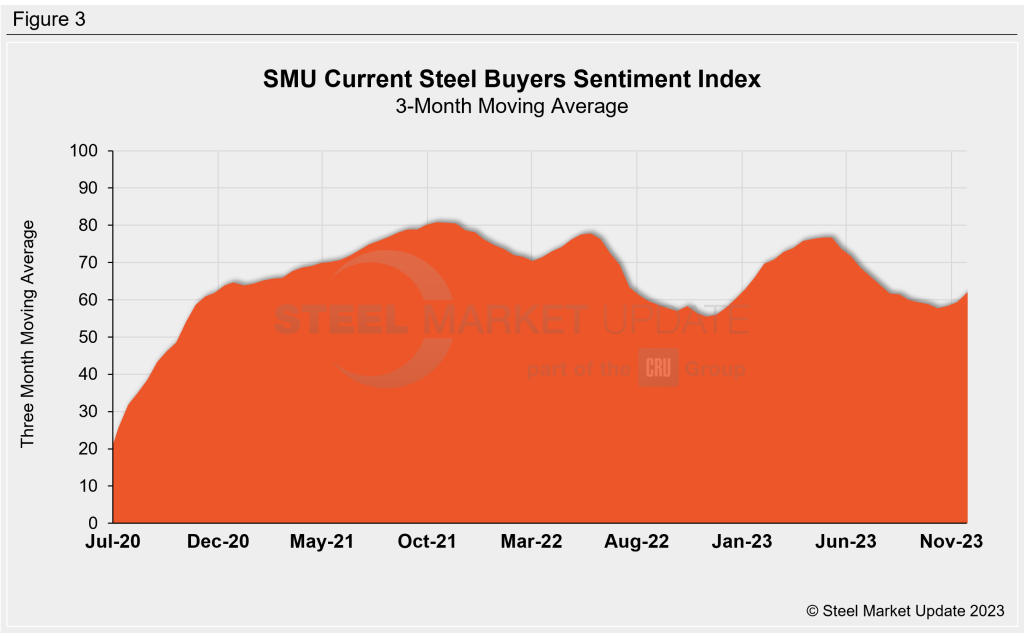
Measured as a three-month moving average, the Current Sentiment 3MMA rose to +61.83, up from with +59.33 two weeks earlier. (Figure 3).
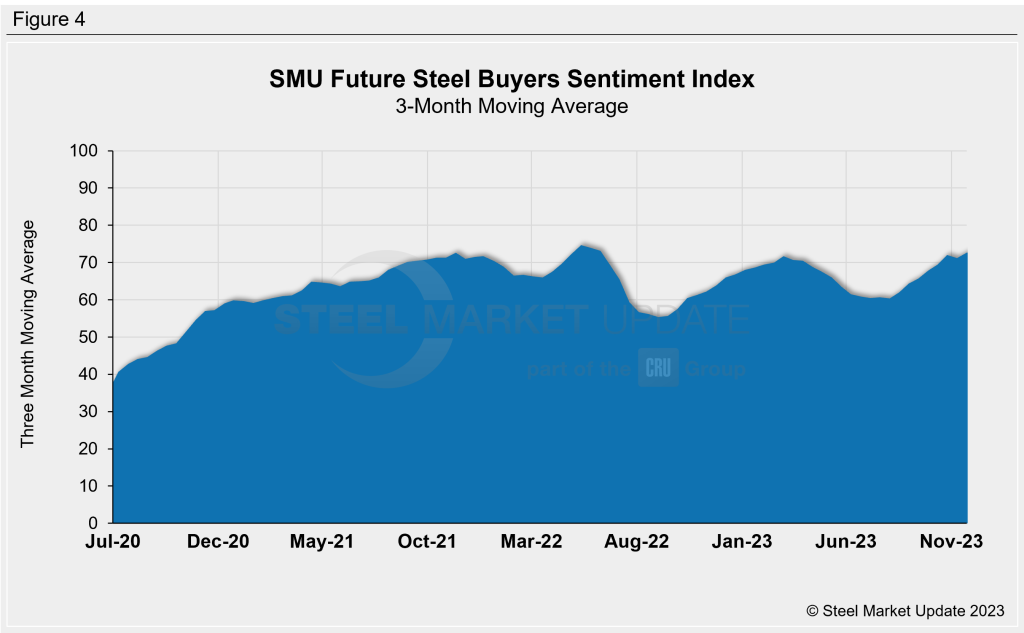
Last week’s Future Sentiment 3MMA increased to +72.67 from +71.17 at the previous market check (Figure 4).
What SMU Respondents Had to Say:
“We are closing the year very well with good orders and announced increases.”
“Demand is steady and prices increasing.”
“Future uncertainty economically could create headwinds.”
“Hard to tell what Q2 of 2024 looks like.”
“Contracts looking OK, spot business very slow.”
About the SMU Steel Buyers Sentiment Index
The SMU Steel Buyers Sentiment Index measures the attitude of buyers and sellers of flat-rolled steel products in North America. It is a proprietary product developed by Steel Market Update for the North American steel industry. Tracking steel buyers’ sentiment is helpful in predicting their future behavior.
Positive readings run from +10 to +100. A positive reading means the meter on the right-hand side of our home page will fall in the green area indicating optimistic sentiment. Negative readings run from -10 to -100. They result in the meter on our homepage trending into the red, indicating pessimistic sentiment. A reading of “0” (+/- 10) indicates a neutral sentiment (or slightly optimistic or pessimistic), which is most likely an indicator of a shift occurring in the marketplace. Sentiment is measured via SMU surveys twice per month. If you would like to participate in our survey, please contact us at info@steelmarketupdate.com.