Mexico

June 19, 2025
HRC Futures: Could oil, ag price spikes drive steel higher too?
Written by David Feldstein
David Feldstein is the president of Rock Trading Advisors. Rock Trading Advisors is a National Futures Association Member Commodity Trade Advisory. It provides commercial clients with price risk solutions in ferrous, energy, and interest rate derivatives markets.
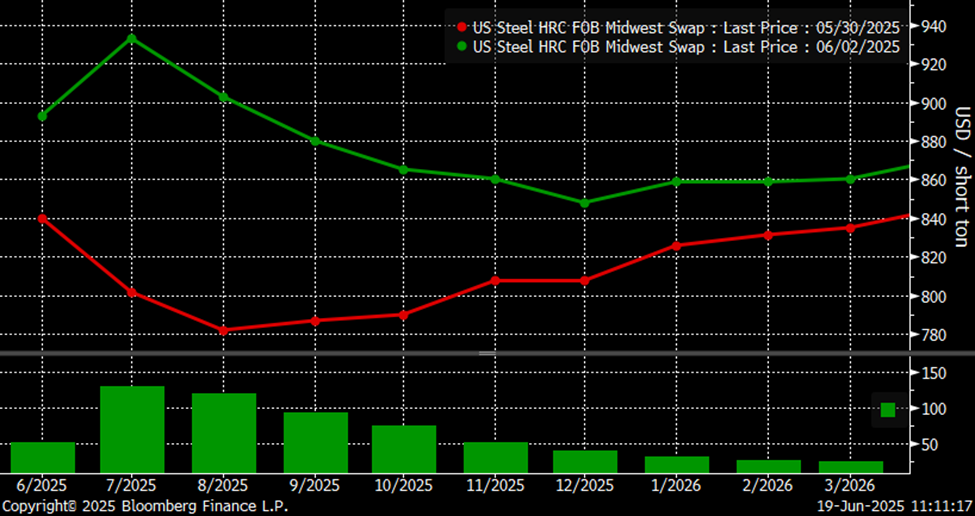
Monday, June 2, was one for the books. The Midwest HRC futures market responded with gusto to President Trump’s announcement that he would raise steel tariffs to 50%.
The July and August futures surged $131 per short ton (st) and $121/st on the day with the curve immediately shifting from contango into backwardation. Trading volume across the Midwest HRC futures curve set a record high with 137,920 tons traded on the day. (Editor’s note: You can click on the charts below to expand them.)
CME Hot Rolled Coil Futures Curve $/st
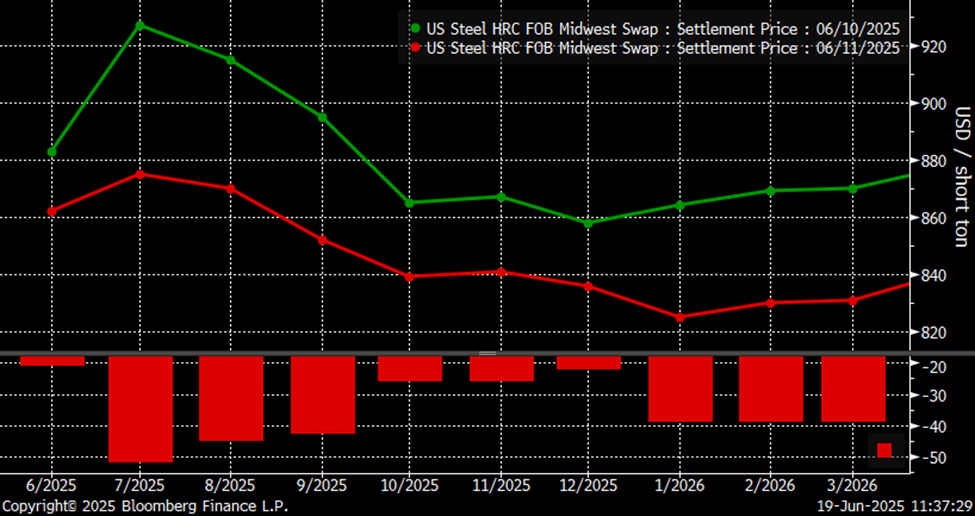
The market started to percolate at the start of last week. Then at 3:30 pm on Tuesday, June 10, a headline that read “US, Mexico Near Deal to Cut Steel Duties and Cap Imports” came across the tape. Bloomberg reported that a deal that was close that would remove the 50% tariff on steel imports up to a certain volume. The HRC futures market responded immediately, with futures in the months of Q3 tanking $43-$52/st as of Wednesday’s settlements.
CME Hot Rolled Coil Futures Curve $/st
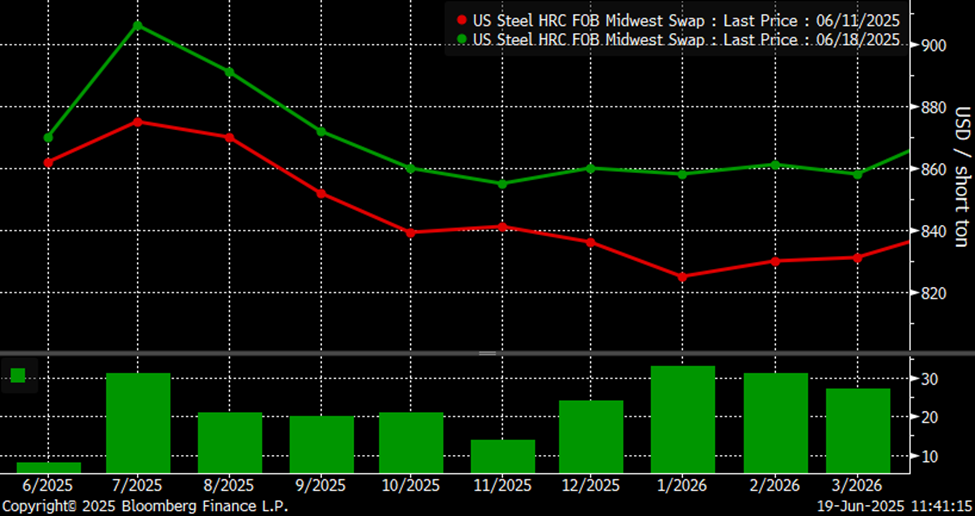
However, digging a bit deeper into the story uncovered alternative reporting that said Mexico is awaiting a response to its request to be exempted from the 50% tariff. Whether the initial news report jumped the gun or not remains uncertain. But so far, no more news with respect to Mexico’s request to have the tariffs removed has developed.
In addition, President Trump left this week’s G-7 meeting in Canada without any changes to the steel tariffs, a potential development that some market participants were watching closely for. Since last Wednesday, the curve has clawed back some of the Mexico-story drop, with the July future up $31/st and the August, September, and October futures up roughly $20/st.
CME Hot Rolled Coil Futures Curve $/st
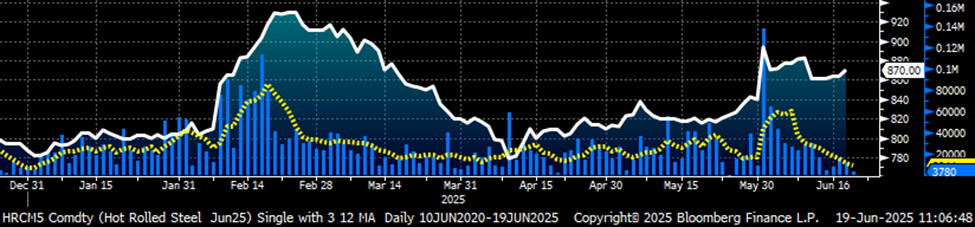
As noted above, trading volume across the Midwest HRC futures curve skyrocketed on June 2 to a new all-time high. But since then, trading volume has been on the slide – especially with some futures market participants out of the office this week attending a steel conference in New York.
June CME HRC Future $/st w Aggregate Curve Volume & 5-Day Avg
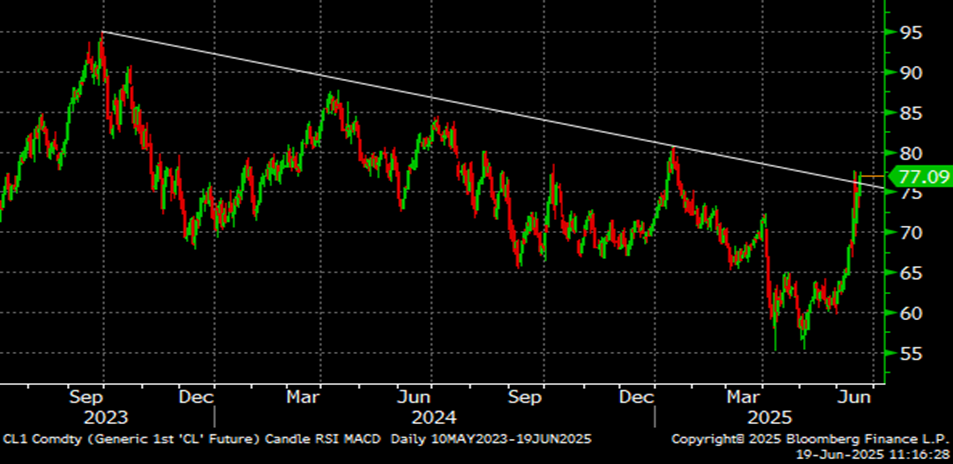
The front month (July) CME crude oil has spiked more than 25% so far in June in response to the Israel-Iran conflict. The front month future is breaking through its multi-year downtrend, perhaps indicating a trend reversal. The sudden spike in oil, diesel, and gasoline prices has several implications for the steel industry.
Rolling Front Month CME WTI Crude Oil
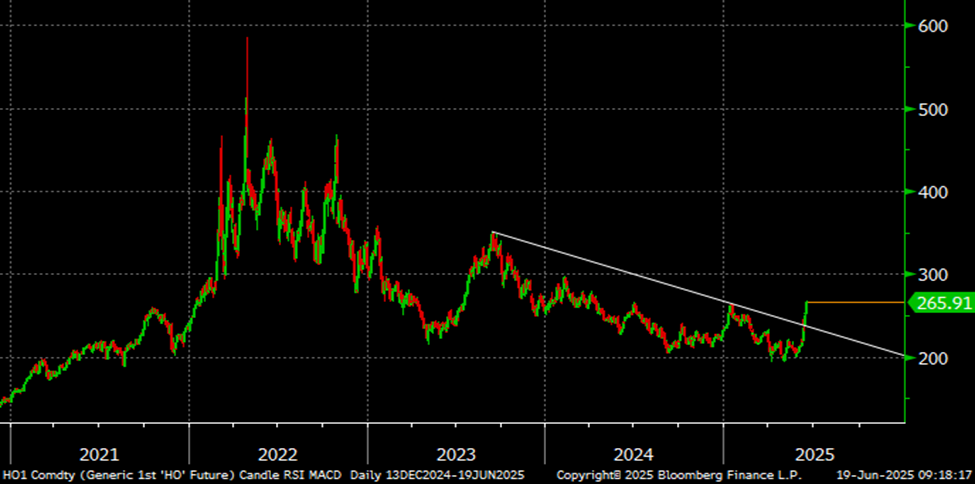
The front month (July) CME diesel future has also busted through its downtrend. Will higher diesel fuel prices drive up the price of scrap? What will these higher prices mean for steel transportation costs?
Rolling Front Month CME Diesel Future
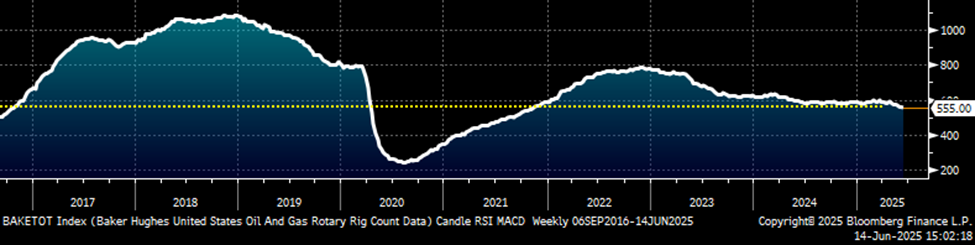
The Baker Hughes Rig Count fell to 555 rigs last week, its lowest since November 2021. For 2025, publicly traded oil and gas companies have indicated a conservative approach to capex. They are either scaling back or maintaining their budgets. These firms have indicated a similar approach to 2026.
Could we see an abrupt shift now that oil prices have spiked higher? Will we see a rebound in the rig count? Will this create a snap-loading effect (think waterski rope), where the industry suddenly does a 180-degree turn? If so, will that bring with it increased demand for steel products used by the energy industry?
Baker Hughes U.S. Oil & Gas Rig Count
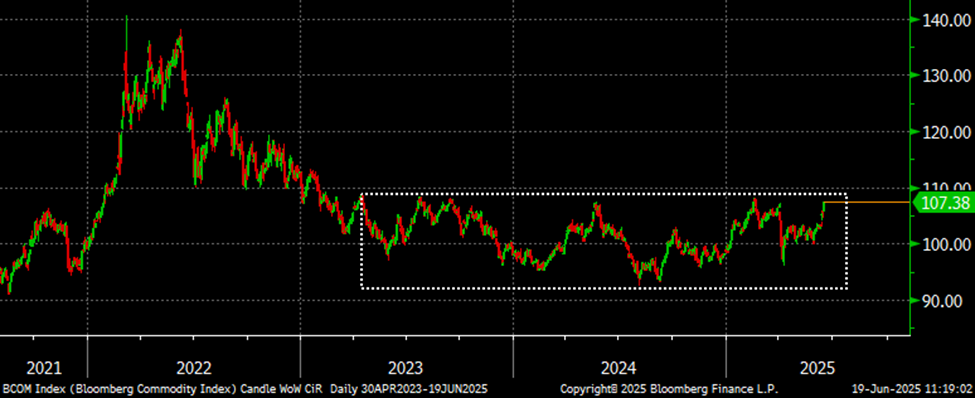
A rising tide lifts all boats. The Bloomberg Commodity Index has been stuck in a tight range since early 2023. The sharp increase in crude, diesel, and gasoline has helped lift the Bloomberg Commodity Index 7.4% so far in June. Could we see it break out of this range into a new bull market? On the financial derivatives front, will we see forced buying across commodities driven by financial funds tied to the Bloomberg Commodity Index and other commodity indices?
Bloomberg Commodity Index
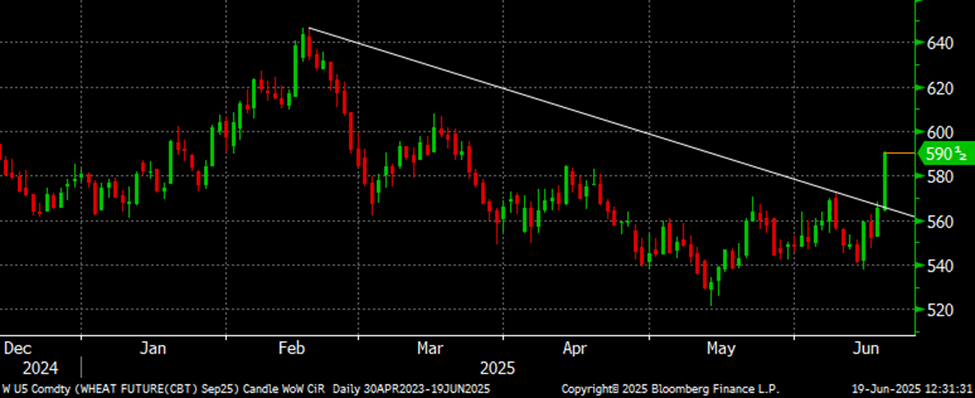
Agriculture futures such as corn, wheat, and soybeans have rallied over the past few trading sessions. With cattle prices setting record highs in recent weeks, could we see improved demand for steel products from the beleaguered agricultural industry?
CME September Wheat Future
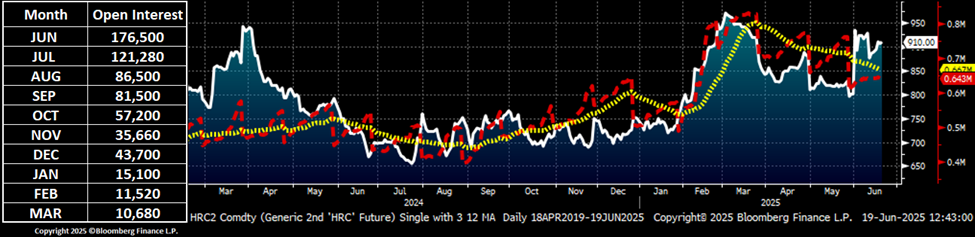
Hypothetically speaking, what would a sudden increase in demand mean for the steel industry? Are end users prepared for 2H? Or is the uncertainty related to interest rates and tariffs driving a broad-based, short-term lean supply chain management strategy? While I am unaware of a statistic that measures this, the ISM Manufacturing PMI’s inventory and customer inventories can provide some indication (with both around 45). Open interest across the CME Midwest HRC futures curve could also act as a proxy for end users’ strategy.
Open interest (OI) has been in a steady decline to 643K tons since peaking at 831K tons on March 19. While the months of July and August have increased over the past months following the expiration of the April and May futures, there remains a sharp drop-off in OI after 60 days and then again after 120 days. This could be indicative of a relatively low level of fixed-priced deals held by end users. Perhaps the open interest and ISM data combined with the uncertainty noted above could bring us to the conclusion that end users are in fact underprepared for a sudden shift like the one seen in the oil industry.
Rolling 2nd Month CME HRC Future $/st and open Interest (red) (22-day M.A. ylw)
It never gets dull around here, I tell ya! As Ferrous Bueller once said, “Life moves pretty fast. If you don’t stop and take a look around once in a while, you could miss it.”
Disclaimer
The content of this article is for informational purposes only. The views in this article do not represent financial services or advice. Any opinion expressed by Mr. Feldstein should not be treated as a specific inducement to make a particular investment or follow a particular strategy, but only as an expression of his opinion. Views and forecasts expressed are as of date indicated, are subject to change without notice, may not come to be and do not represent a recommendation or offer of any particular security, strategy or investment. Strategies mentioned may not be suitable for you. You must make an independent decision regarding investments or strategies mentioned in this article. It is recommended you consider your own particular circumstances and seek the advice from a financial professional before taking action in financial markets.