Analysis
August 7, 2025
US steel imports declined again in July
Written by Brett Linton
After rebounding 20% from April to May, US steel imports slipped 9% month on month (m/m) in June to 2.25 million short tons (st), according to US Commerce Department data.
Following January’s pre-tariff surge, imports have remained low since February compared to post-pandemic volumes. Looking at preliminary license data, the steel trade appears to have slowed even further in July. Import licenses are currently down another 4% m/m to potentially the second-lowest monthly rate of the year.
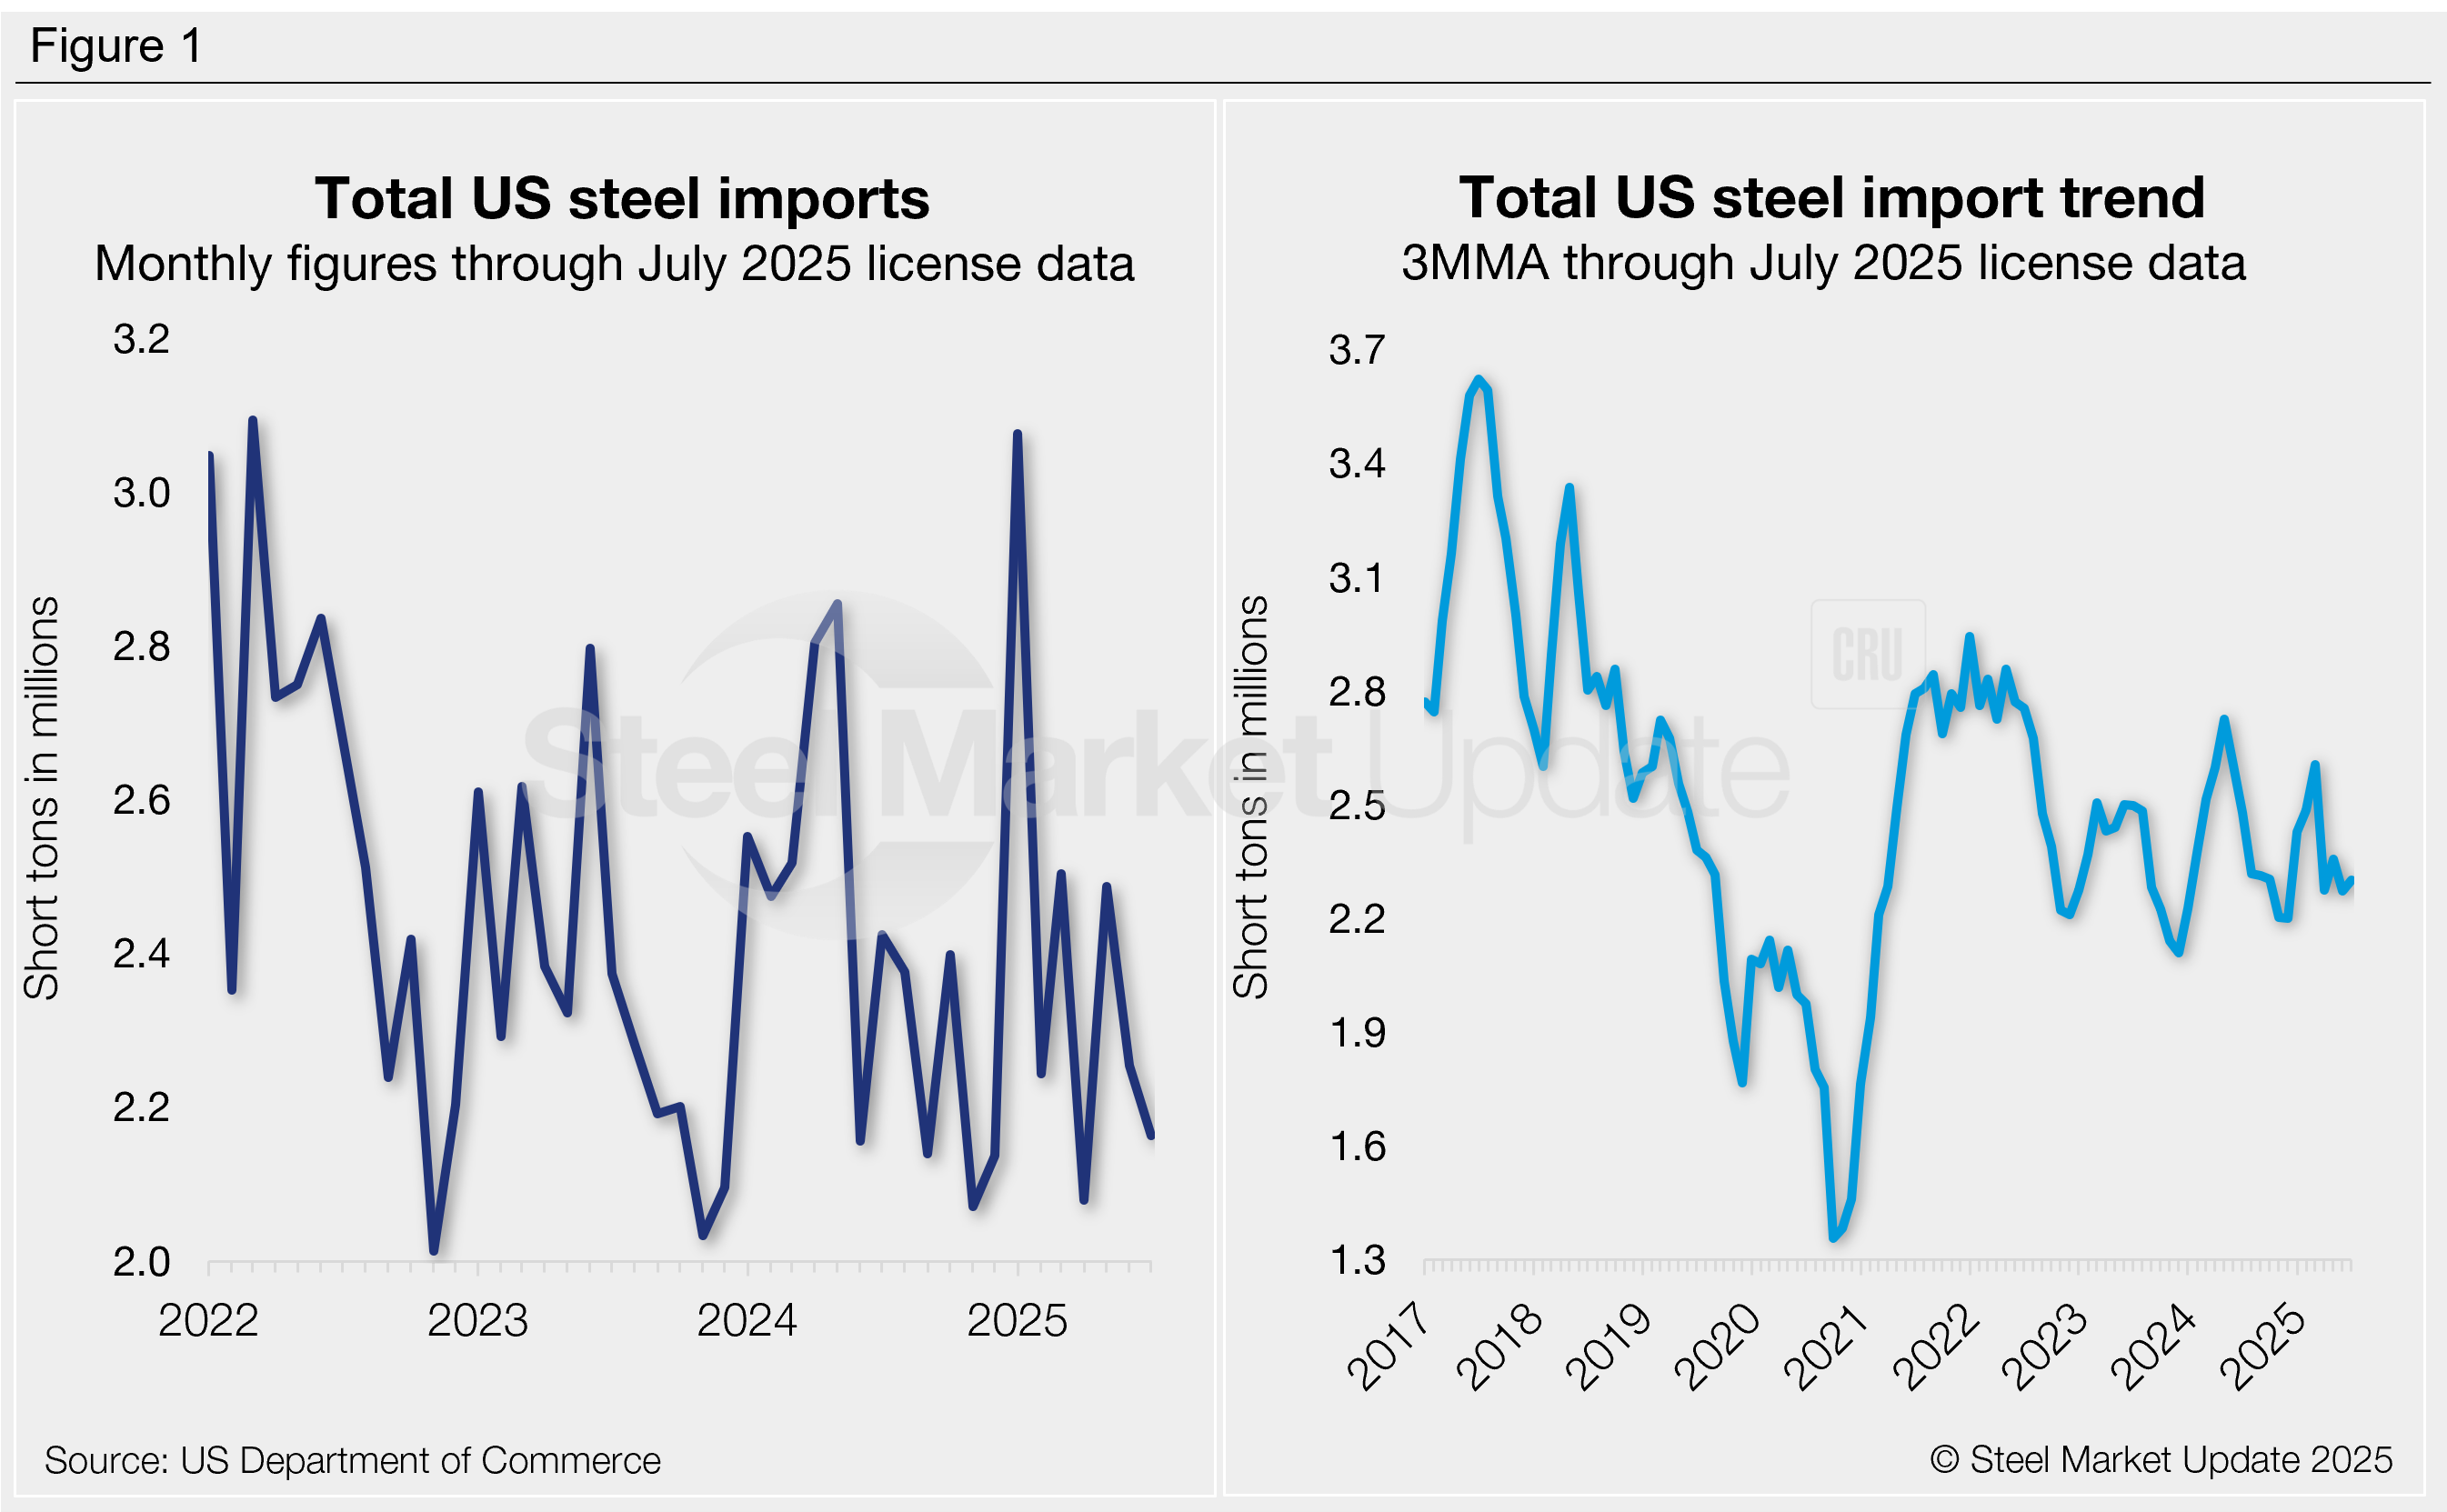
Recall that imports spiked at the start of the year to 3.08 million st in January, the highest rate recorded since May 2022. Imports have generally trended lower since then. As of last week, July licenses total 2.16 million st, down by 42% from January’s peak (Figure 1, left).
Over half of the steel that entered the country in June (56%) came from just five countries: Brazil (19%), Canada (15%), South Korea (8%), Mexico (8%), and Vietnam (6%). Other major suppliers included Taiwan, Egypt, Germany, Japan, India, Turkey, Romania, the Netherlands, and Spain, each contributing 2-5% of the total. Combined, these 14 countries accounted for 84% of all June imports.
To explore steel import data by country, category, or specific product, visit the International Trade Administration’s Steel Import Monitor.
Import trends
Import data can be analyzed on a three-month moving average (3MMA) to smooth out monthly fluctuations and better highlight trends (Figure 1, right). On this basis, 3MMA imports reached a 10-month high of 2.61 million st back in March and have trended lower since then. The 3MMA fell to 2.27 million st in June, marginally rising through July to 2.30 million st. For comparison, imports averaged 2.41 million st per month in 2024 and 2.35 million st per month in 2023.
Imports by product
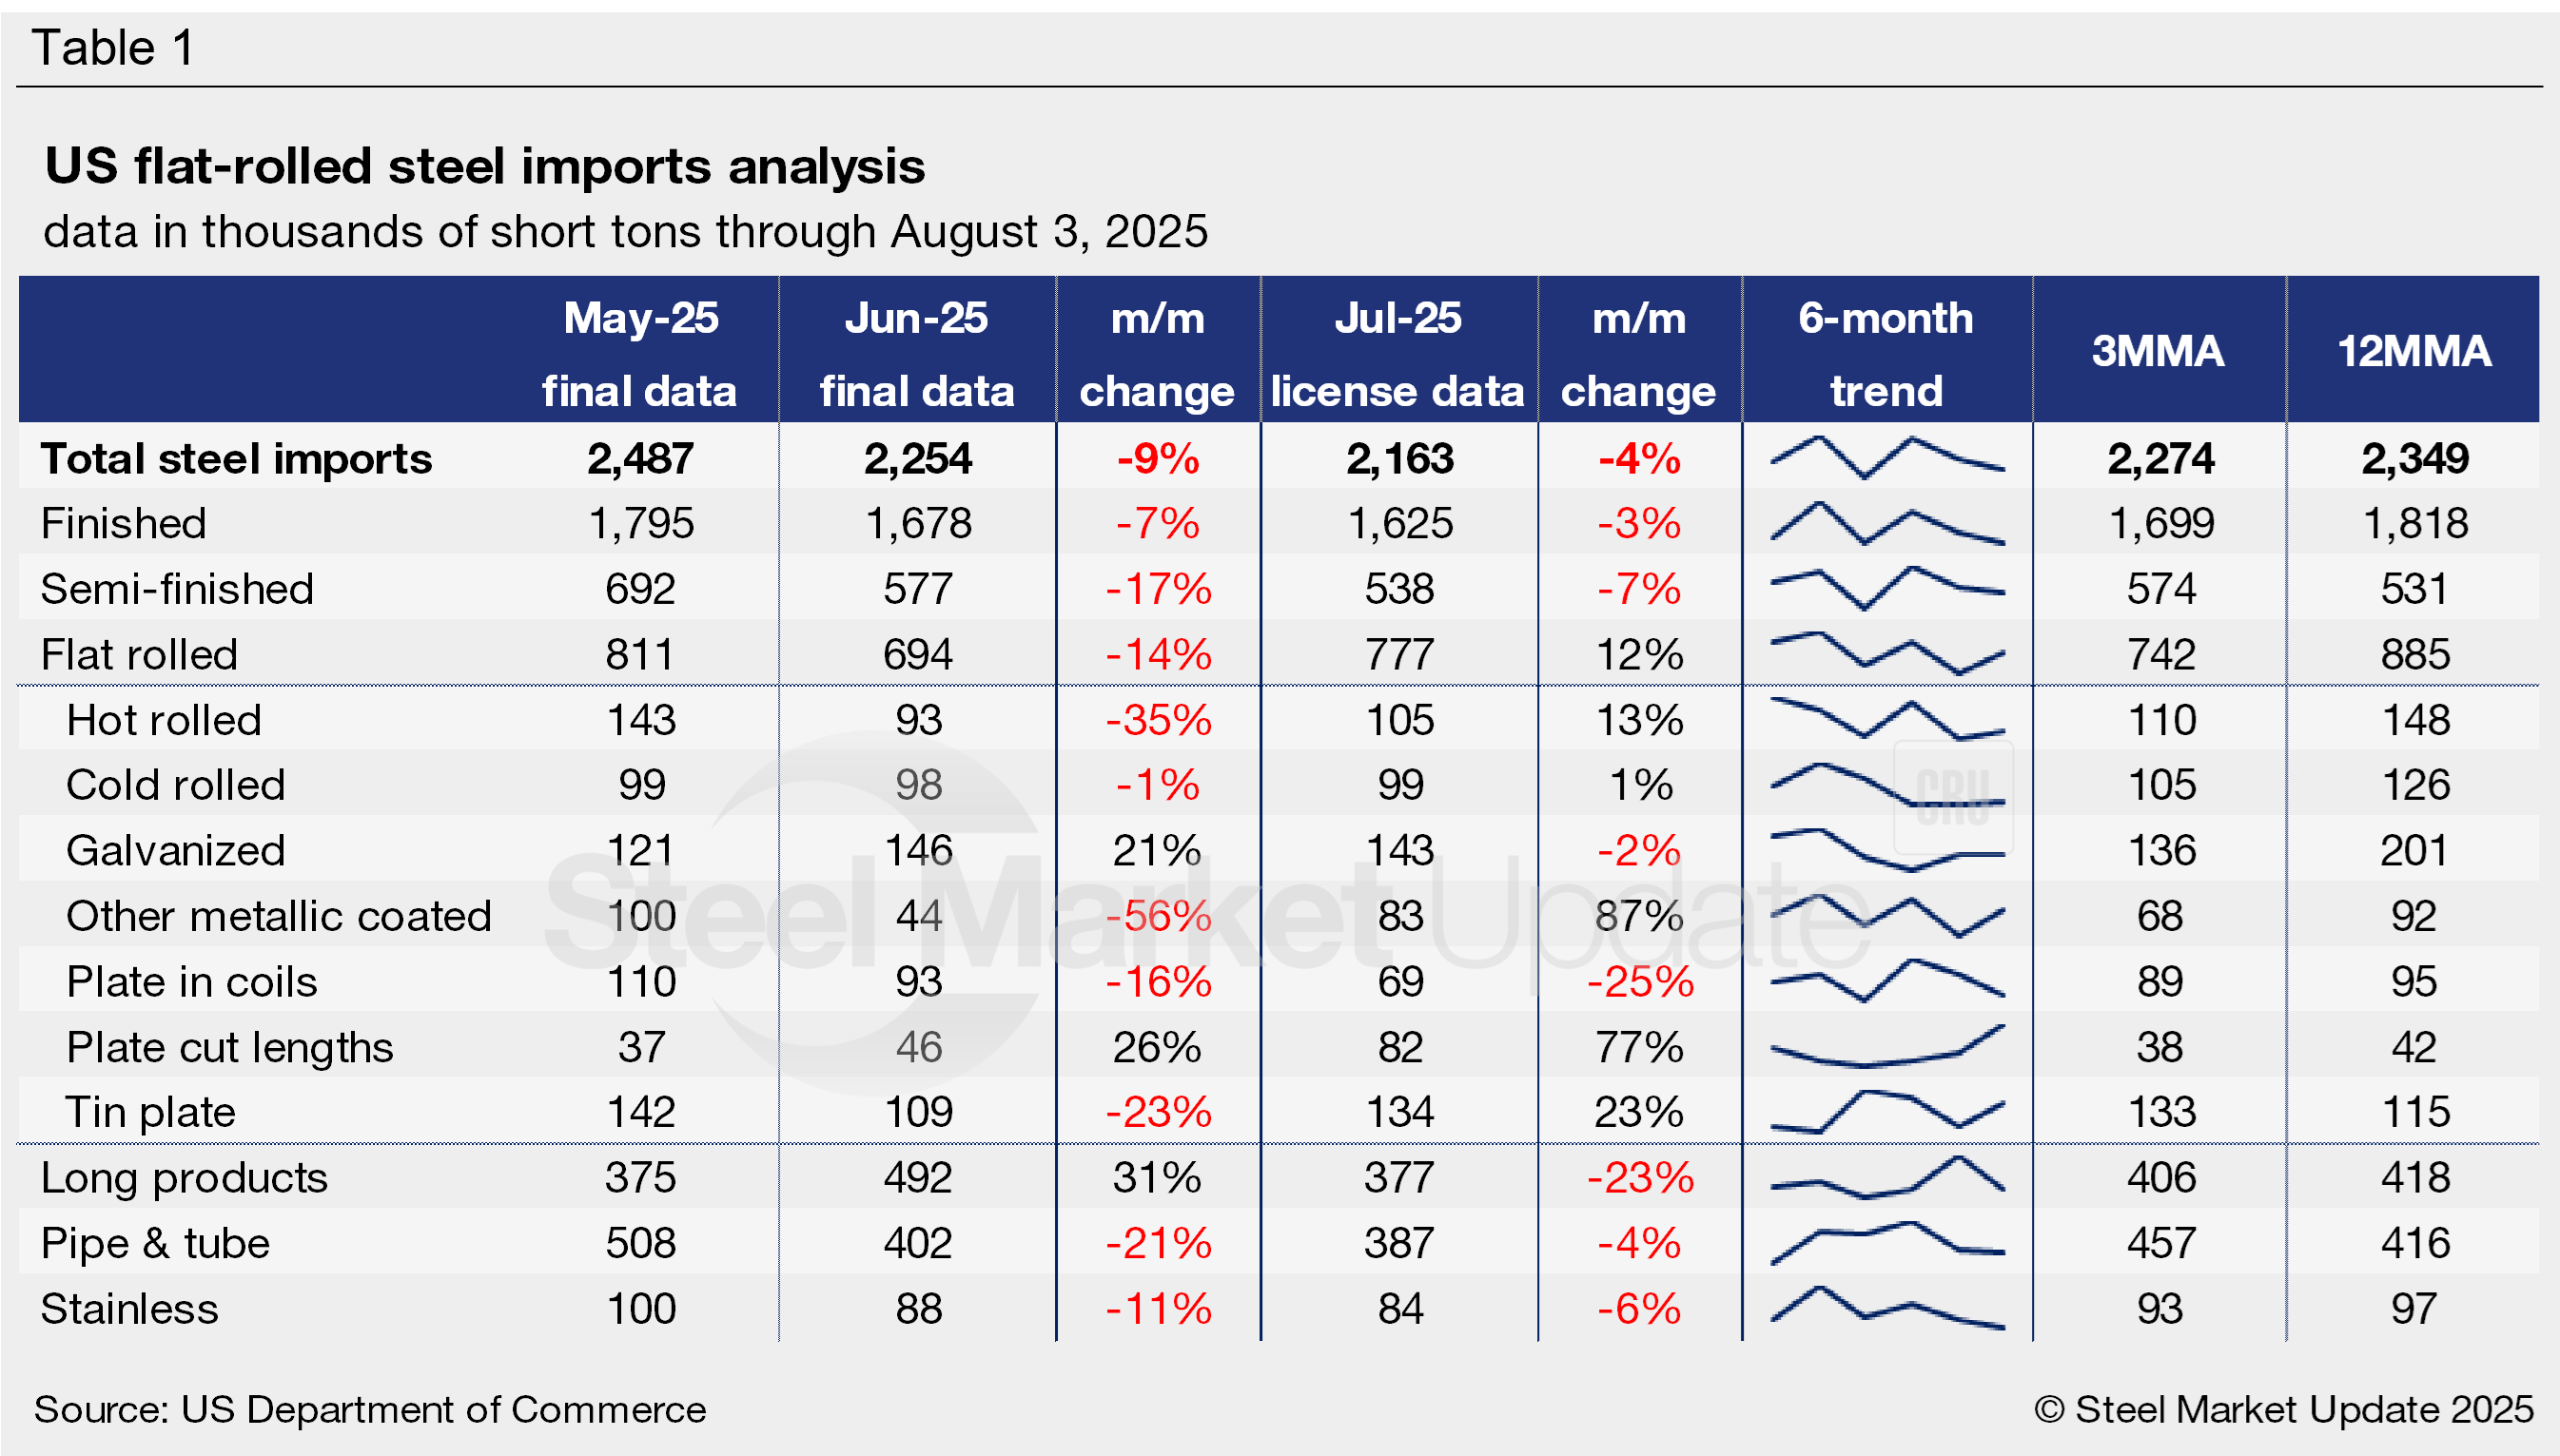
Table 1 highlights high-volume steel product imports (click to expand). Note that the 3MMA and 12MMA columns are through final June figures. For deeper analysis, visit our Steel Imports page.
Finished vs. semi-finished imports
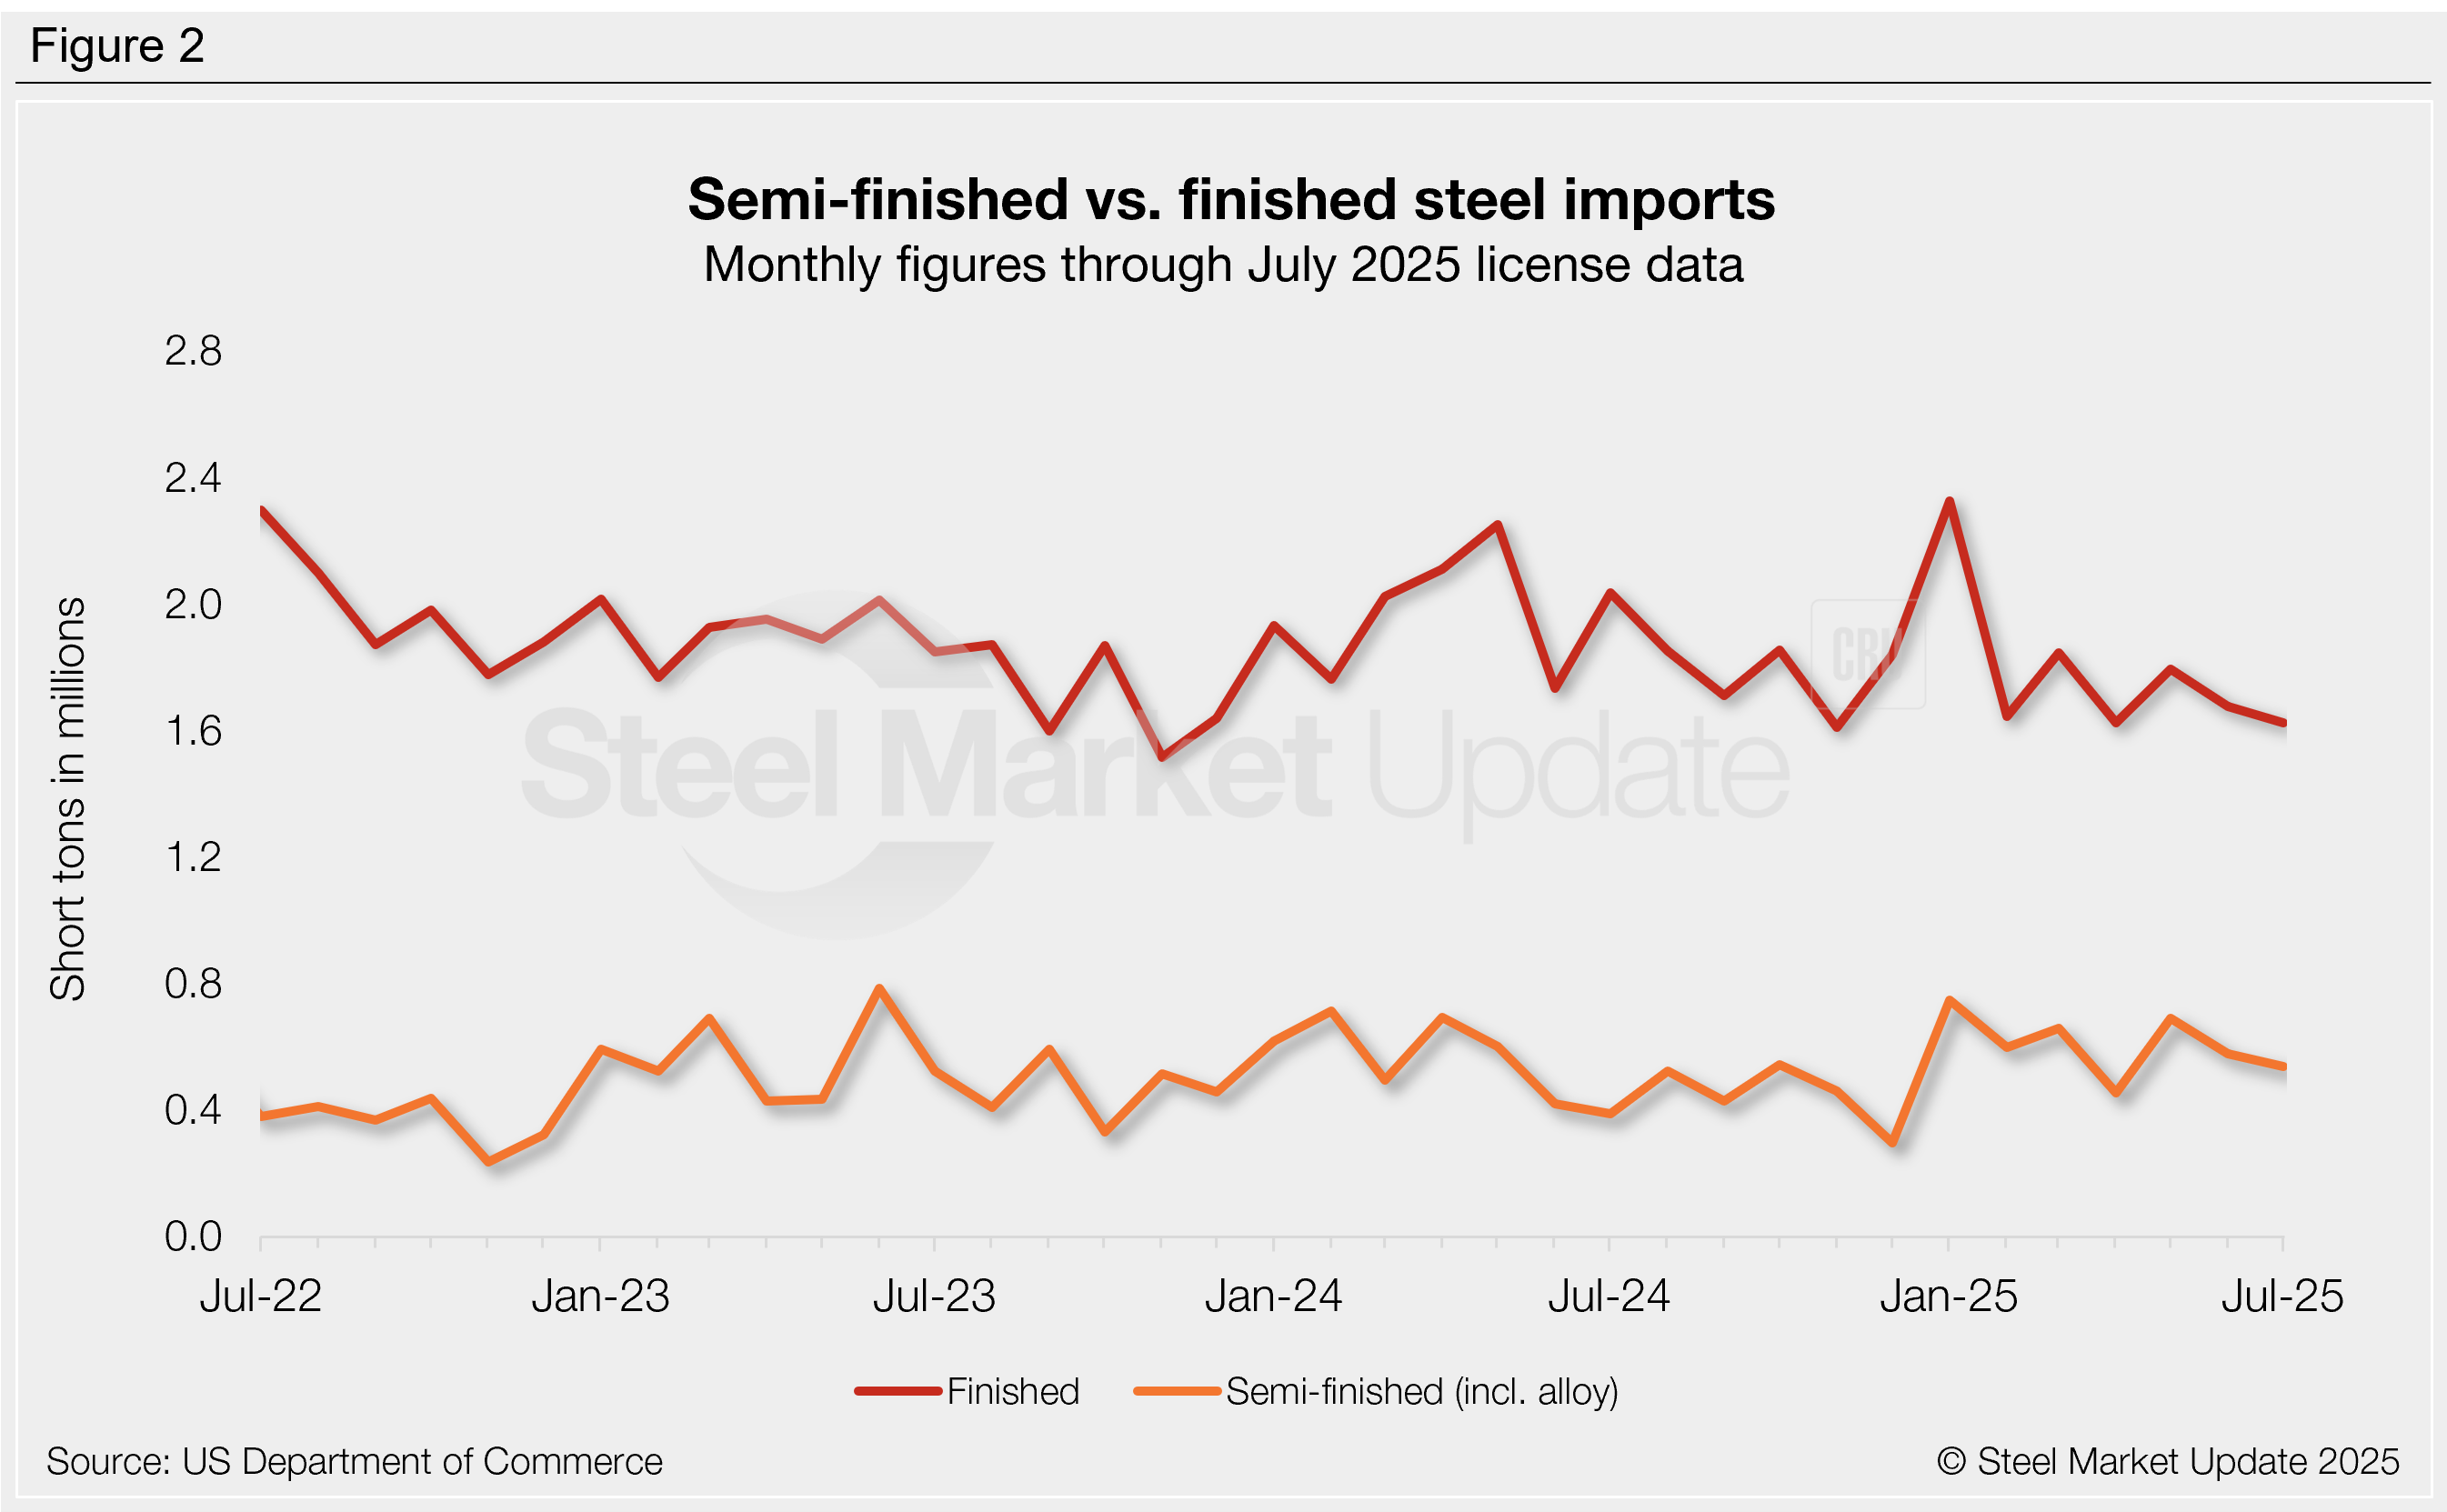
Finished steel product imports declined 7% from May to June, totaling 1.68 million st, or 74% of total imports (Figure 2). July finished licenses are currently down another 3% from June to 1.62 million st (75% of total imports), nearly tied with April for the lowest monthly rate of the year. In 2024, imports of finished products averaged 1.89 million st per month, representing 79% of total imports.
Semi-finished imports (mostly slabs to be further processed by a mill) fell 17% m/m in June to 577,000 st, easing from a near one-year high the month prior. July licenses are currently down another 7% to 538,000 st. For reference, semi-finished imports averaged 515,000 st per month in 2024 and 524,000 st in 2023.
Imports by category
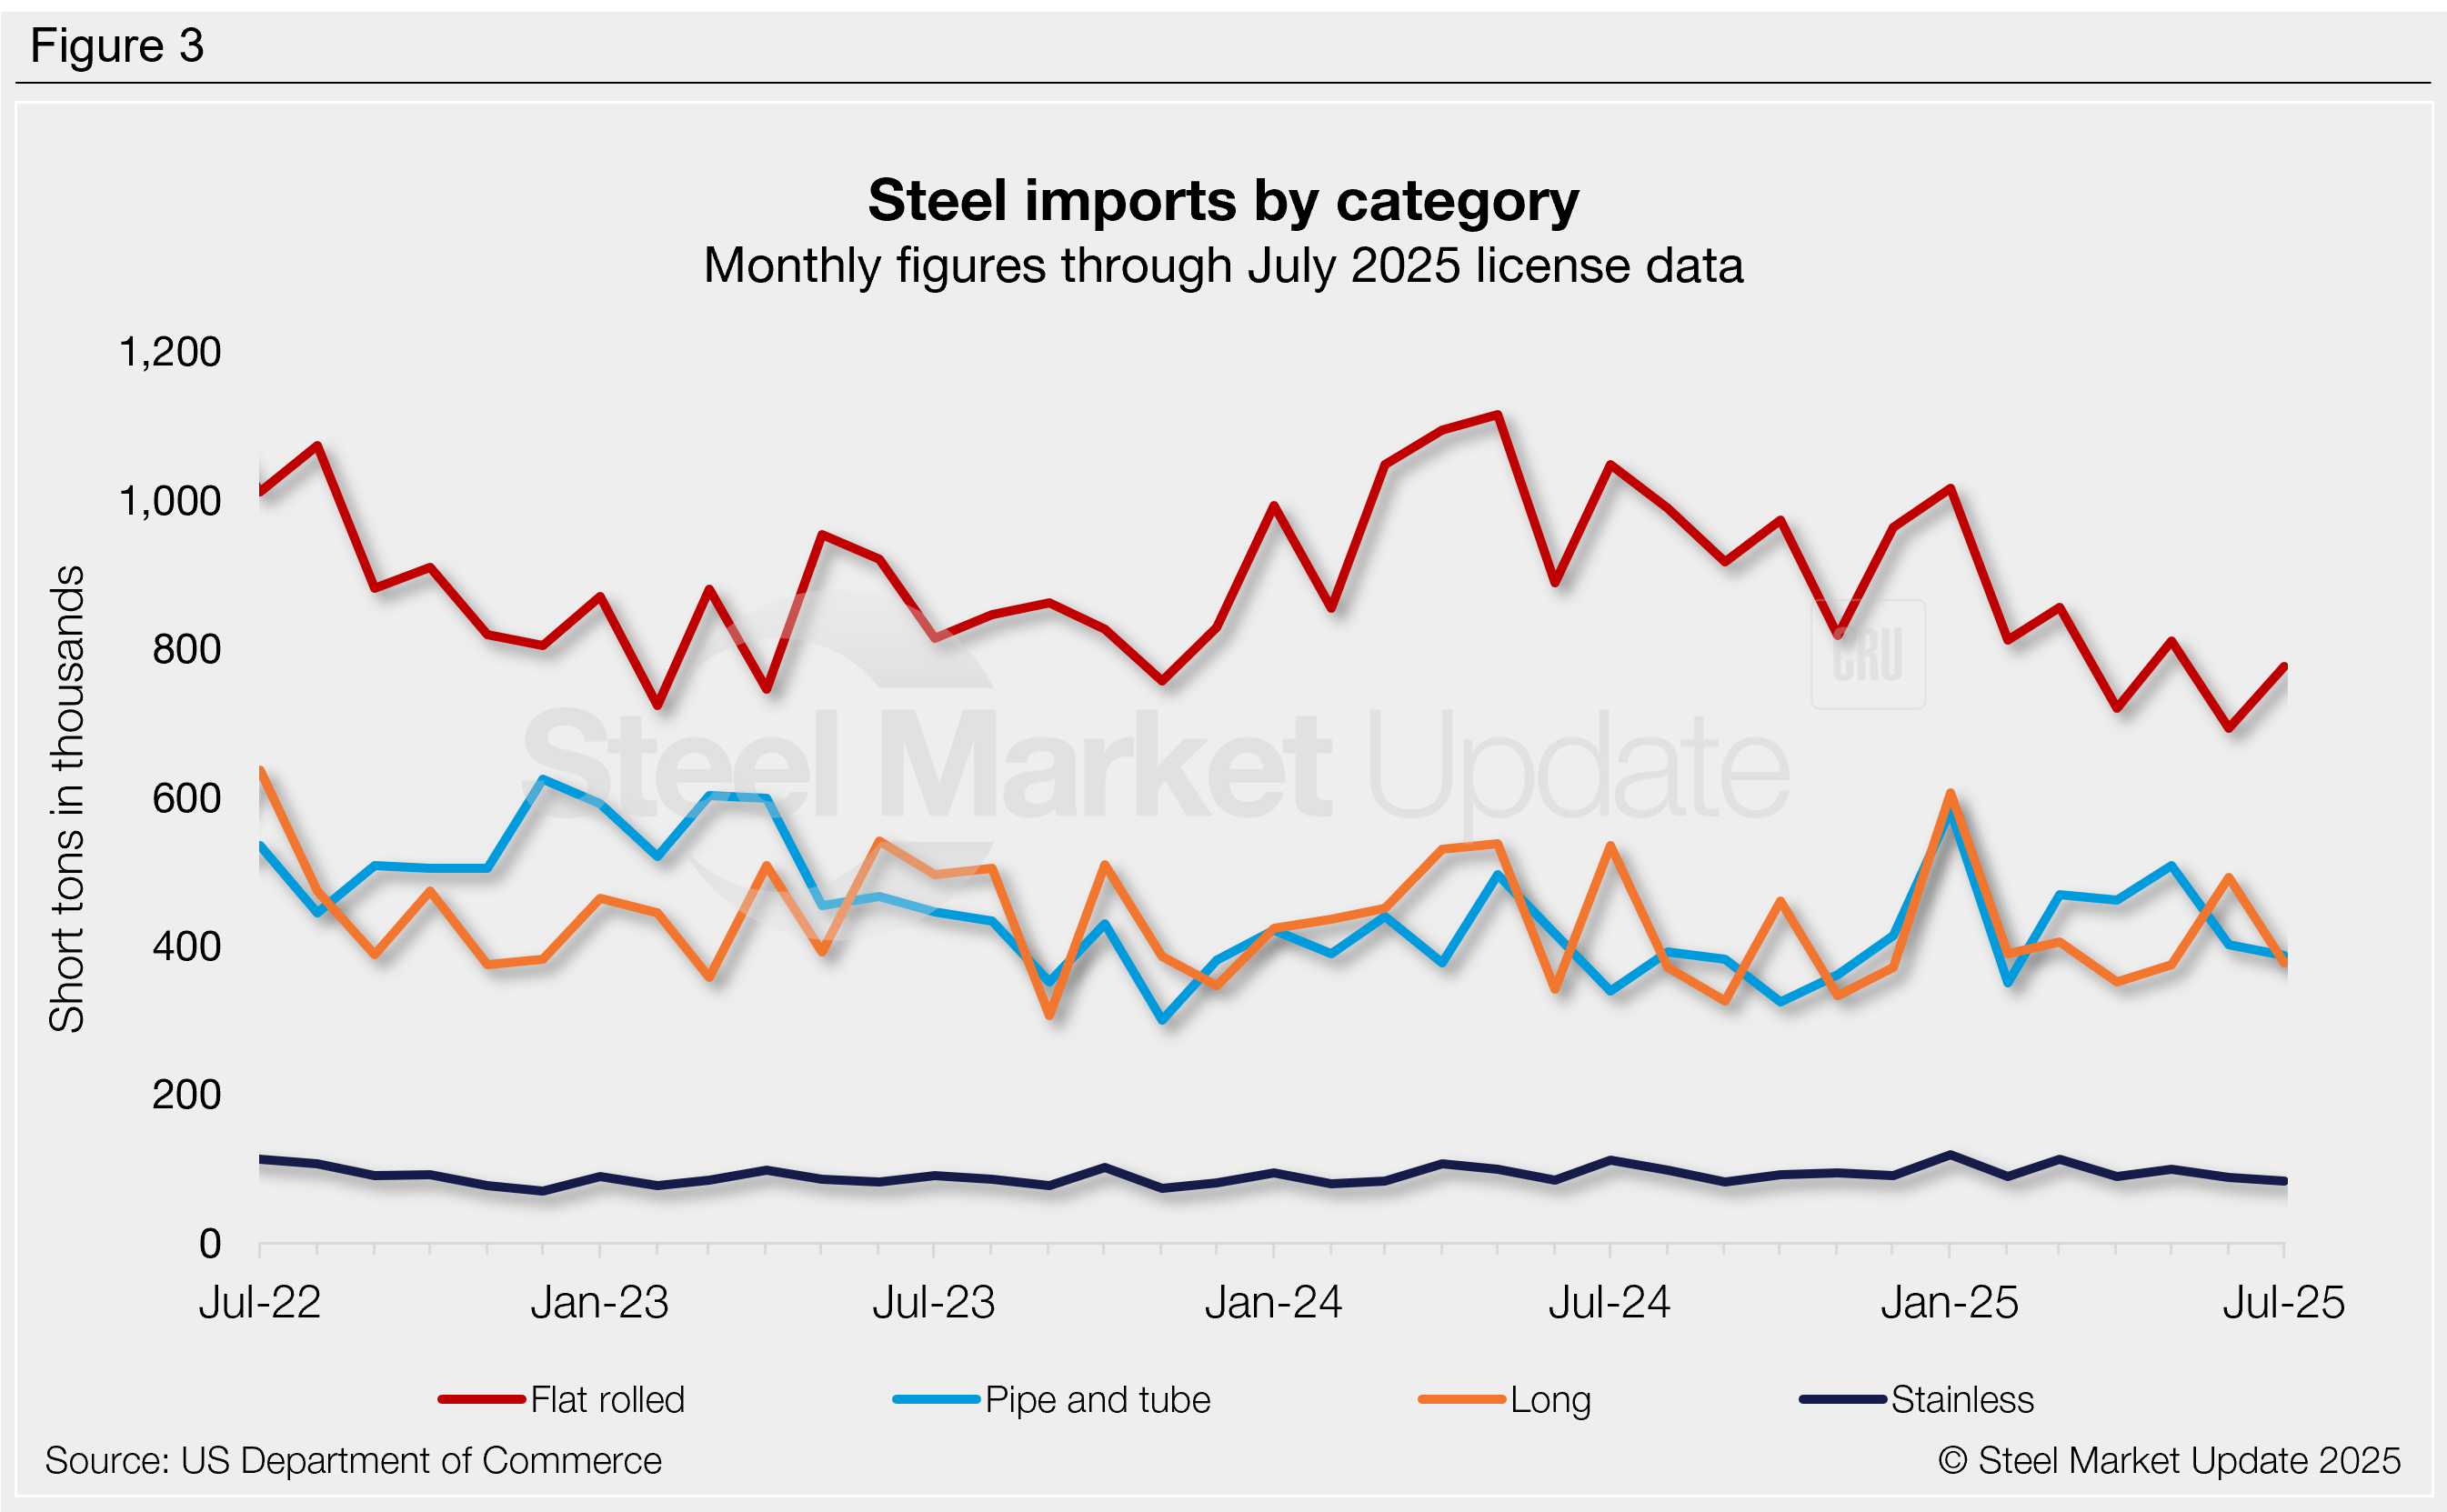
Figure 3 shows monthly imports by popular steel product categories. Notable shifts include:
- Flat-rolled imports fell 14% further in June to the lowest volume seen since January 2021. July licenses are potentially back up 12%.
- Long products increased 31% in June to a five-month high, likely tumbling back down 23% in July.
- Pipe and tube fell 21% in June to a four-month low, possibly down another 4% in July.
- Stainless declined 11% in June to a nine-month low, and July licenses are down another 6%.
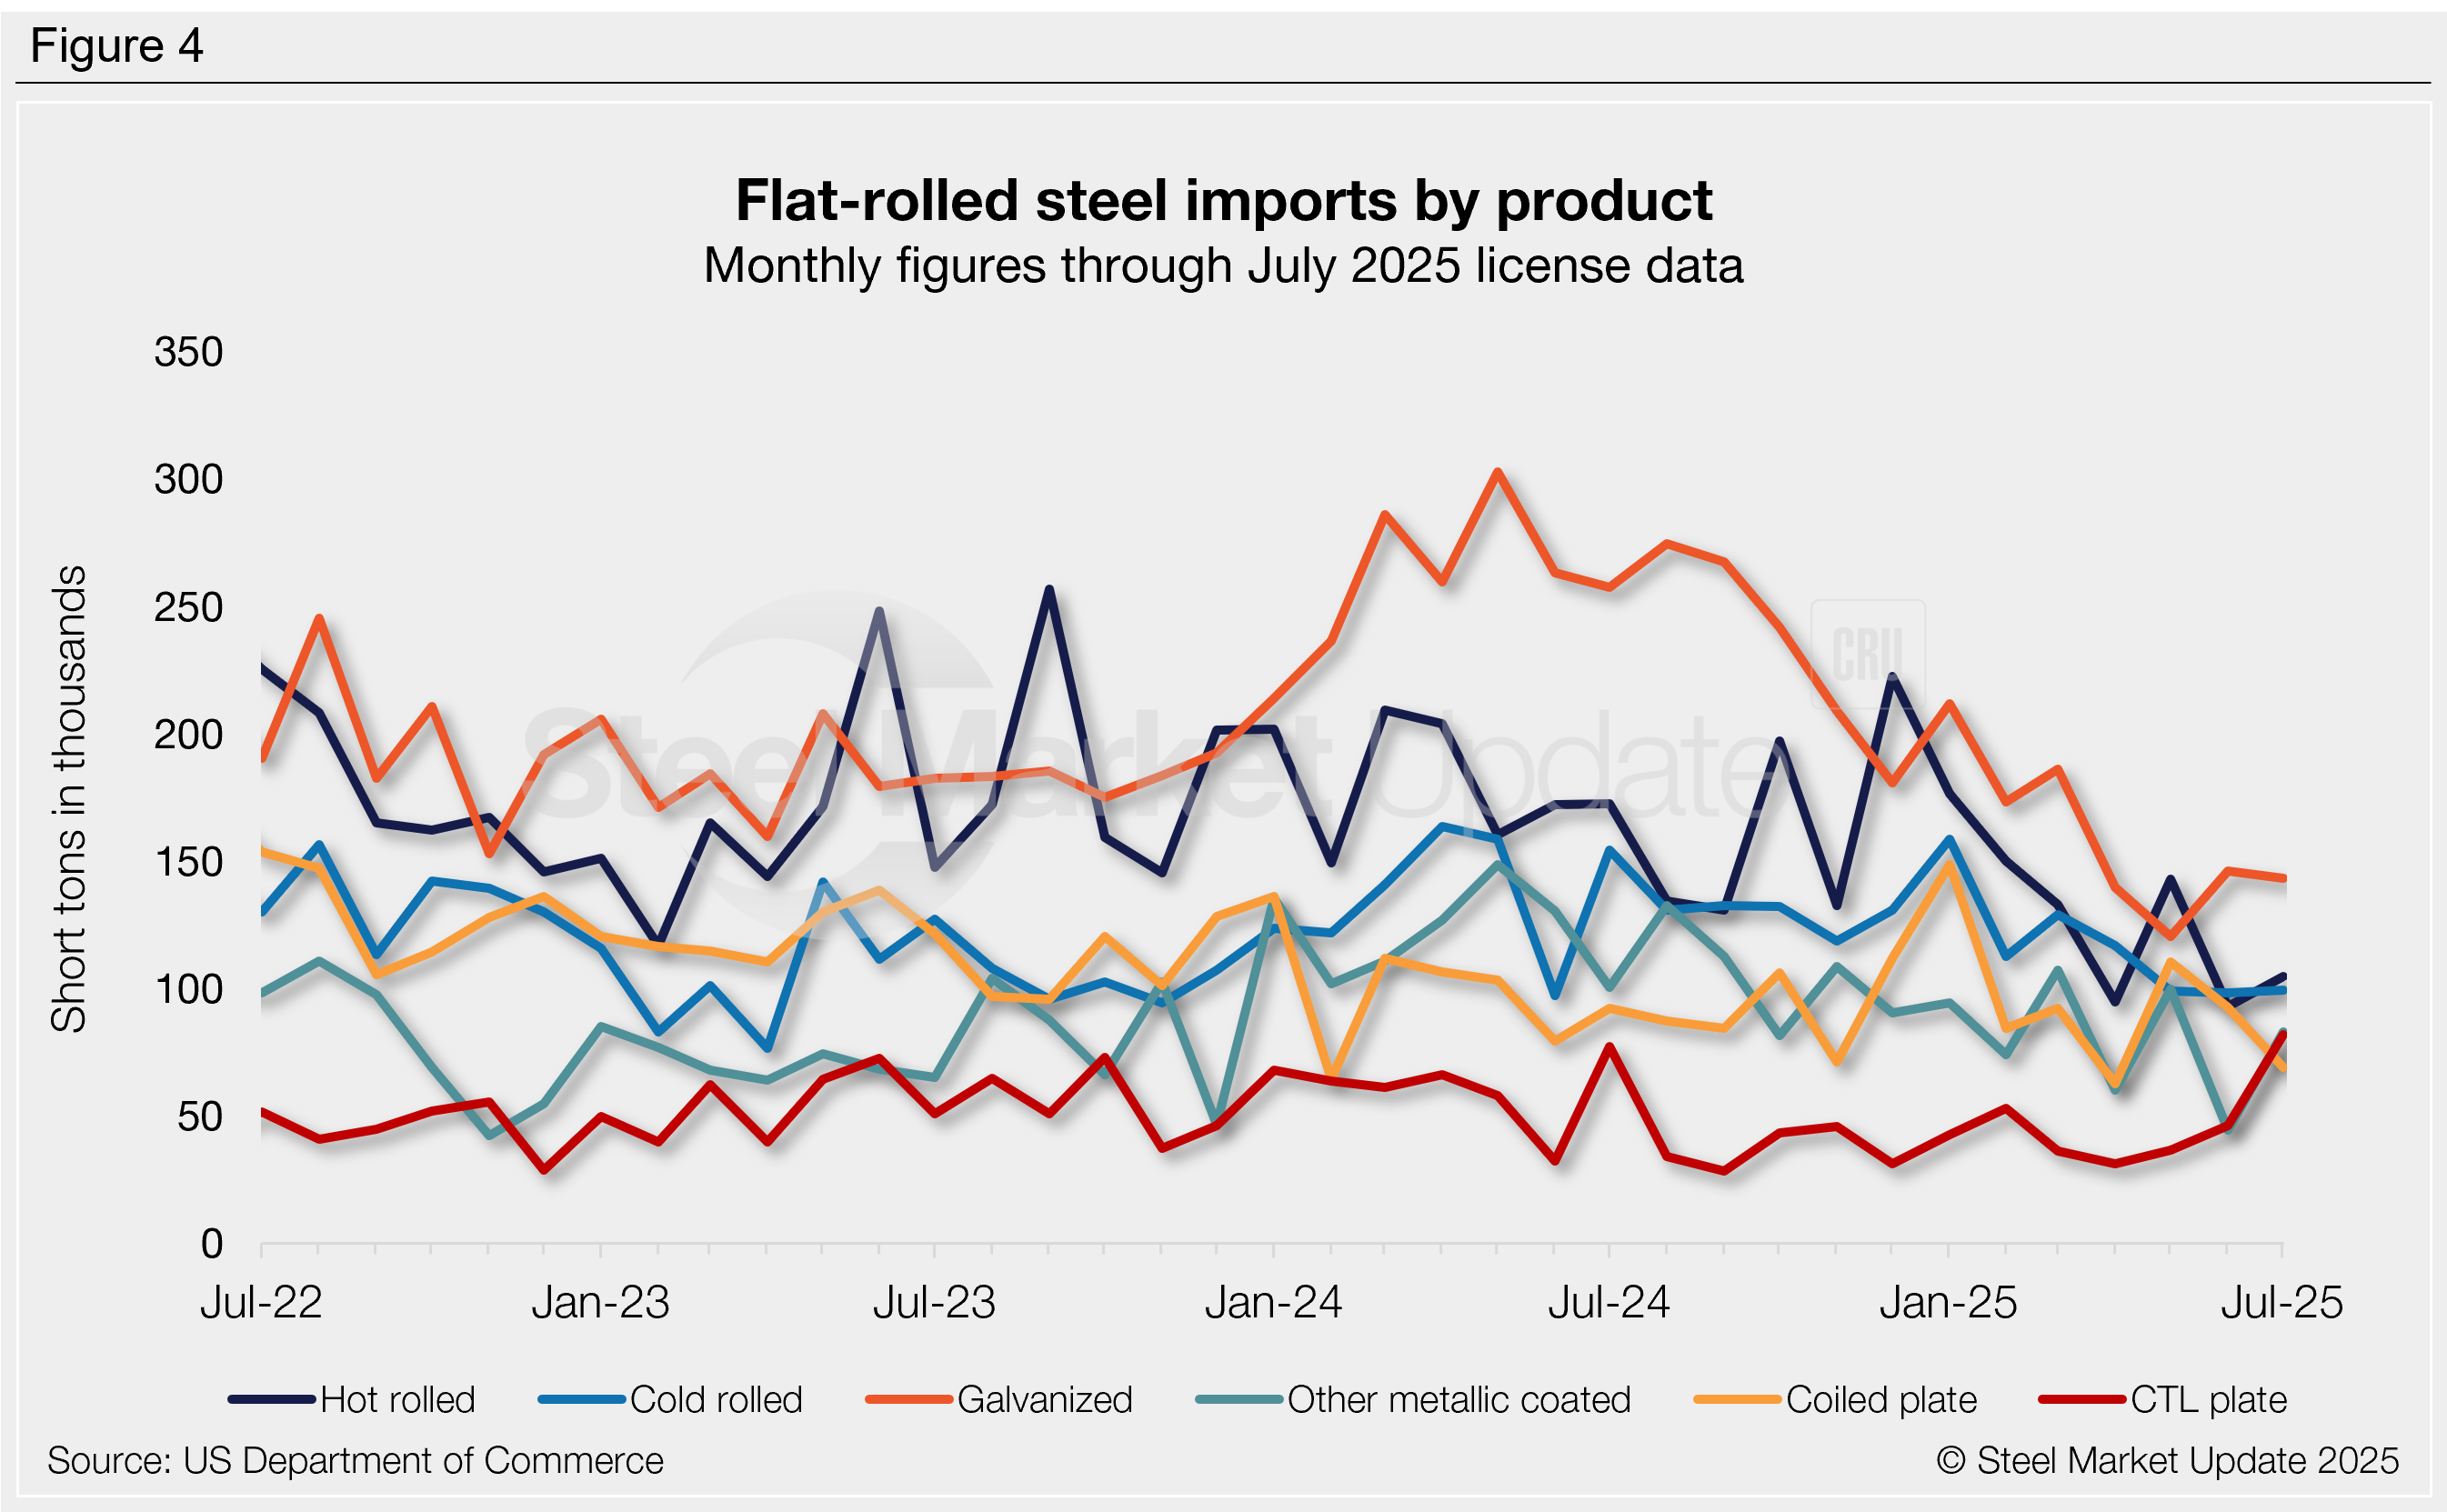
Flat-rolled imports
Figure 4 tracks flat rolled imports for six popular sheet products. Most products decreased from May to June, with multiple reaching multi-year lows, and then slightly recovered in July. Key highlights:
- Hot-rolled coil imports fell 35% m/m in June, erasing May’s gains and then some. The last time we saw imports this low was July 2009 (16 years!). July licenses are currently back up 13%.
- Cold-rolled coil eased 1% in June to a one-year low, bouncing up 1% in July.
- Galvanized rebounded 21% in June following May’s 12-year low, then slipped 2% in July.
- Other-metallic coated dropped 56% in June to a near-three-year low. July licenses bounced back nearly double, rising 87%.
- Coiled plate fell 16% in June, then slipped another 25% in July to a three-month low.
- CTL plate increased 26% in June to a four-month high and is up another 77% through July license data to a potential eight-year high.