Analysis

November 18, 2025
SMU Mill Order Index jumped in October
Written by David Schollaert
SMU’s Mill Order Index (MOI) surged in October after a notable decline the month prior. The recovery came as service center on-order inventory totals picked up, supported by a slight uptick in shipments, according to our latest service center inventories data.
An increase in intake and new order entries in October at an aggressive rate underscored the result. The boost comes as service centers both capitalized on recent bottom-dollar prices and primed inventories for anticipated seasonal demand.
Despite the boost, a key highlight remains the continued efforts on rightsizing inventories. This is noted by the increase in shipment levels and moderate reduction in inventories, keeping service center supply in balance with demand.
Cautious buying remains at the forefront, as the downstream marketplace buys on an as-needed basis. Service centers’ daily shipping rates – down 0.3% from September – underscore this continued dynamic.
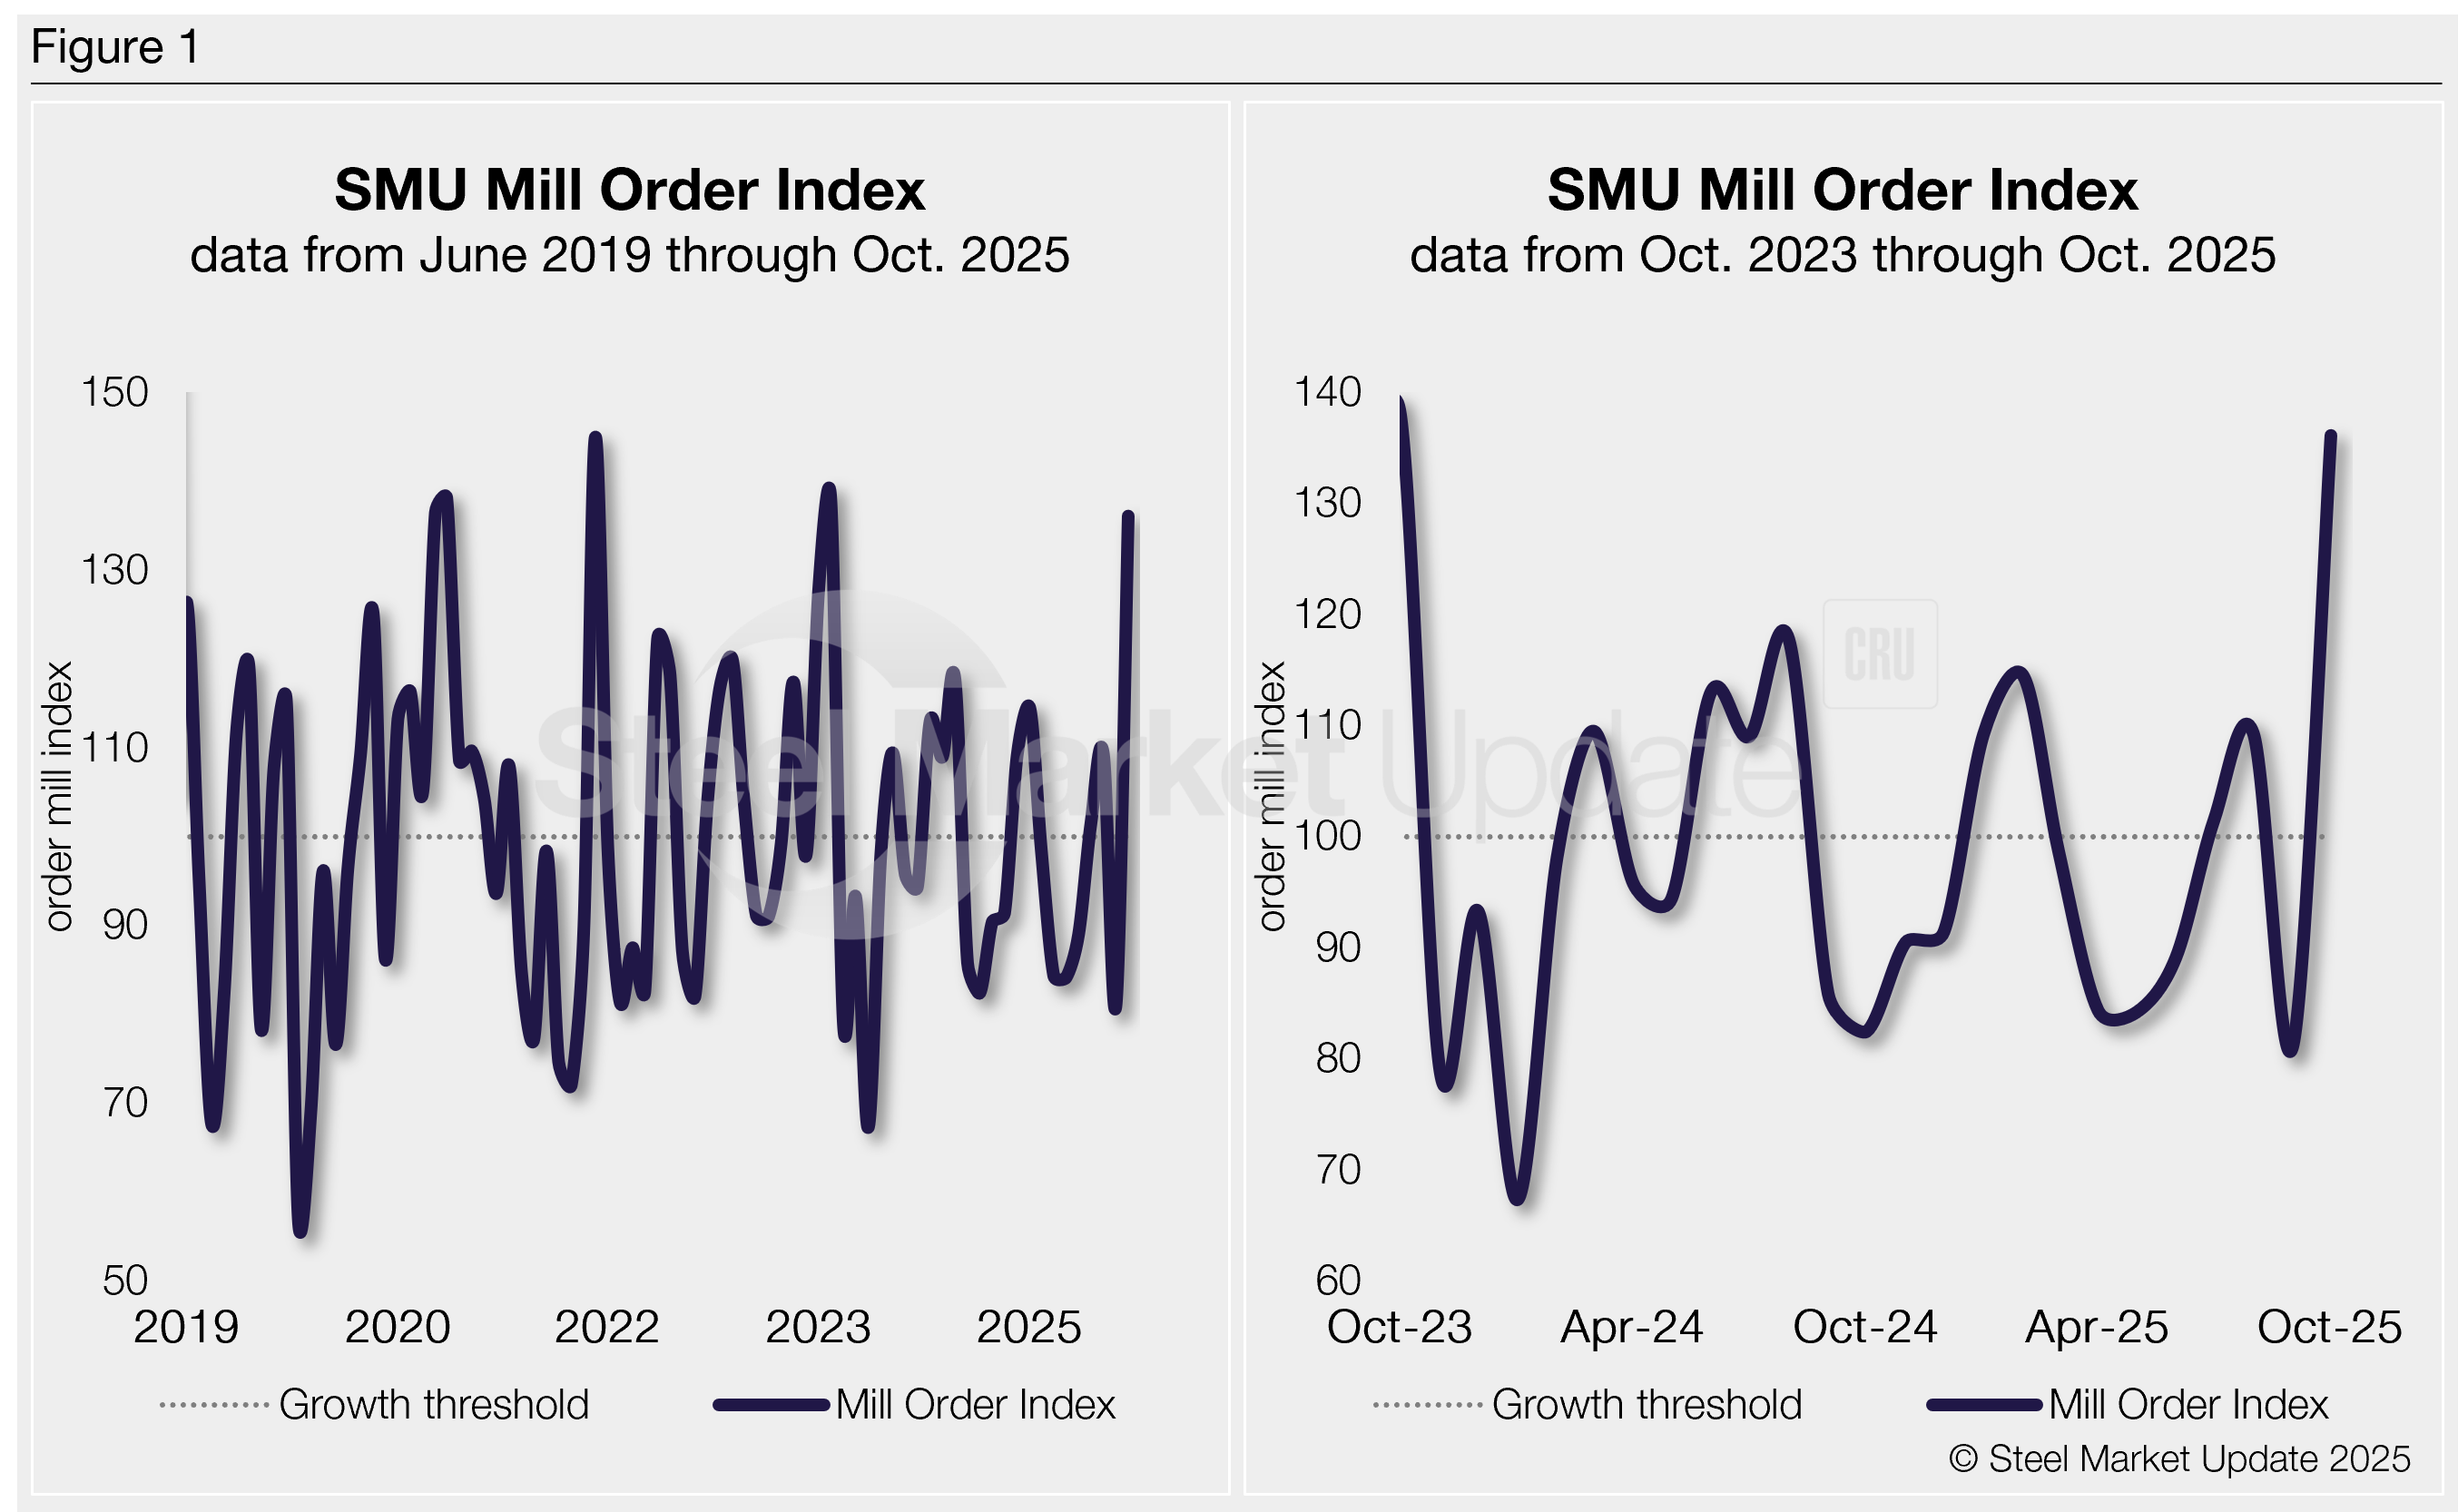
The MOI now stands at 136.1, up nearly 68% from 81.1 in September. It’s the highest reading in two years, and the sharpest m/m swing in the index’s history.
Methodology
SMU derives its MOI — a relative index that evaluates the latest change in service center mill order entries — from our monthly service center inventories data. This index is a good indicator of current service center buying patterns, displaying perceived demand and lead times. This stands out because lead times typically signal upcoming moves in steel prices.
The MOI uses a base period, presently 2022-24, to establish a reference point for measuring service centers’ mill orders over time. This base period is assigned an index value of 100. Subsequent MOI values are then calculated relative to this base.
An index score above 100 indicates an increase in buying, and a score below 100 indicates a decrease.
Figure 1 shows the nearly six-year history of the index on the left and provides a closer look at the MOI readings of the past two years on the right (100 = 2022-2024 average).
Background
Despite brief price spikes — driven by sudden price increases from mills backed by tariff news — market conditions have remained steady, at times sluggish, due to flat end-use demand (as shown in the right-side chart in Figure 1 above).
A rise in intake volume was reported for most of Q1, with a boost in buying from downstream customers pulling forward demand ahead of tariff-fueled price increases. A rapid rise in mill prices was triggered by the increase in service center orders.
The market had been largely grinding lower since it peaked in mid-to-late March, a trend displayed by flat-to-lower intake volumes from May through September.
The skinny
Intake had steadily tailed off after the tariff-driven buying surge fizzled out. And with downstream buyers managing inventories and focused largely on maxing out contract orders, there had been no spike in service center shipments through Q3. October data suggests the first real increase in shipments, followed by a surge in new orders.
It’s too early to note if this was driven by some opportunistic buying at low price points or an indication of future demand on the horizon. Mills are presently digging in, looking to maintain or even increase prices amid 2026 contract talks.
SMU’s MOI will undoubtedly vary a bit here to close out 2025. Consensus would be that inventories tick up a bit to close out Q4, with it mostly going away in January. A very common occurrence.
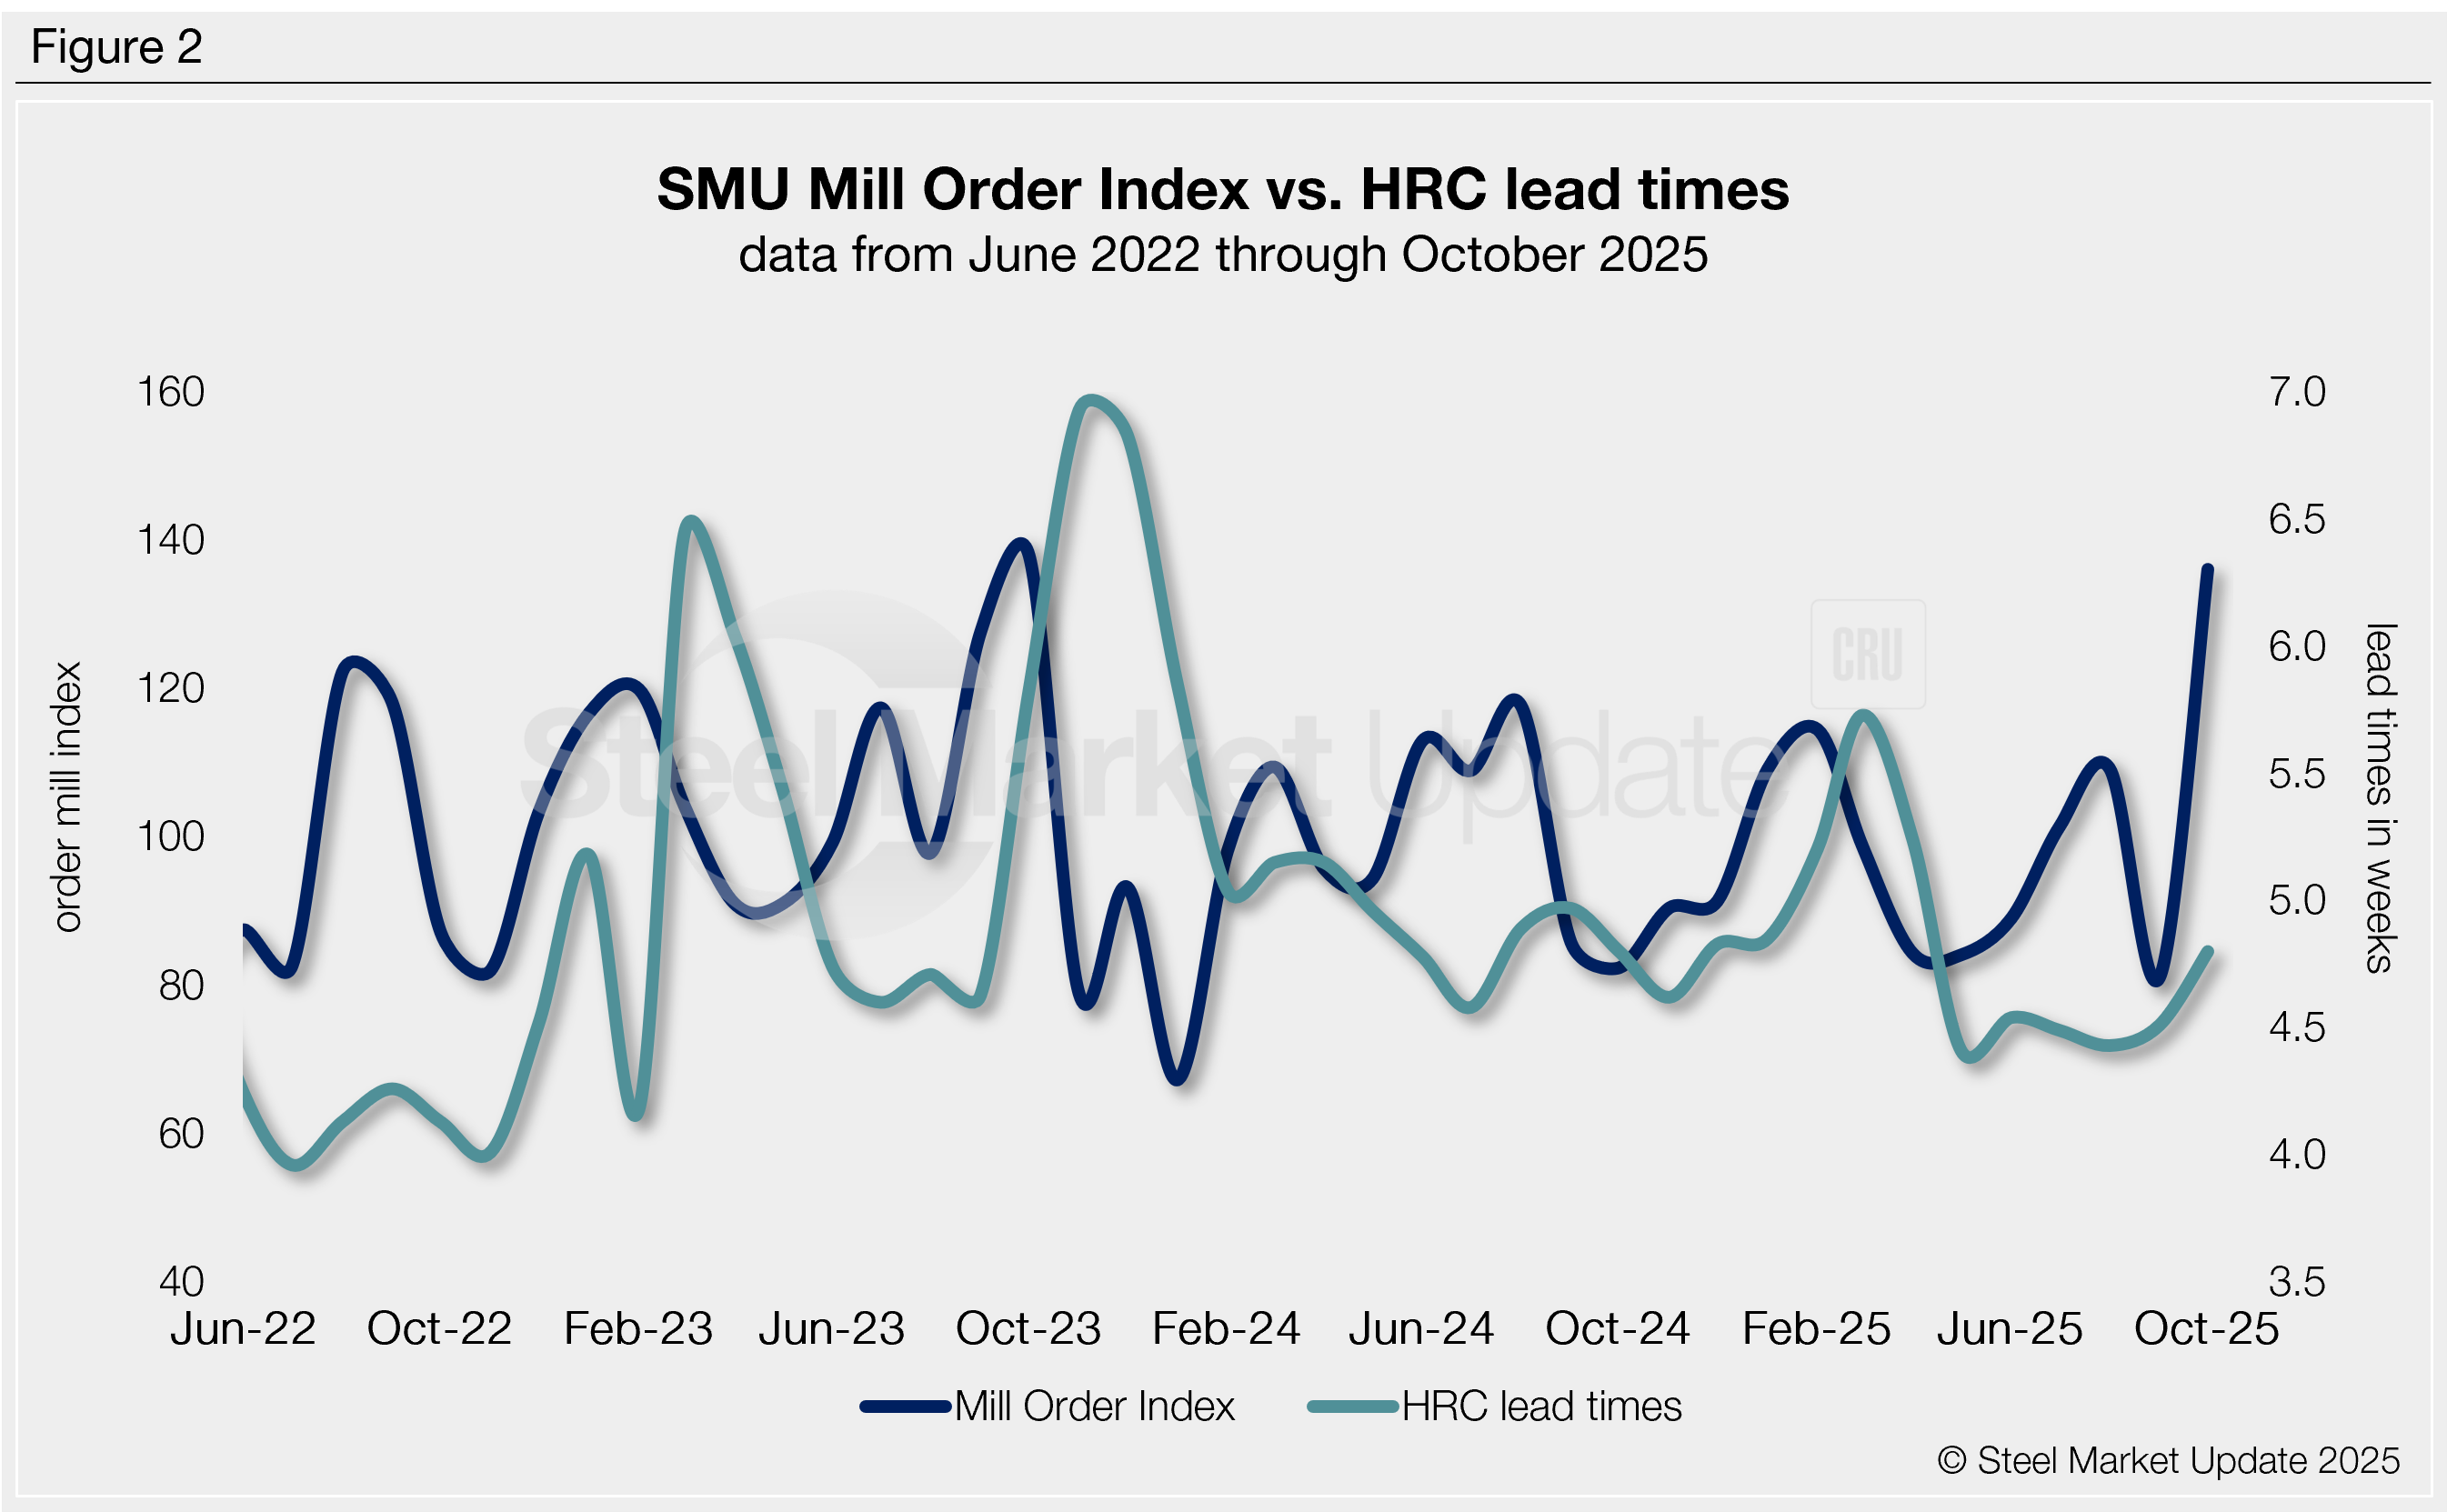
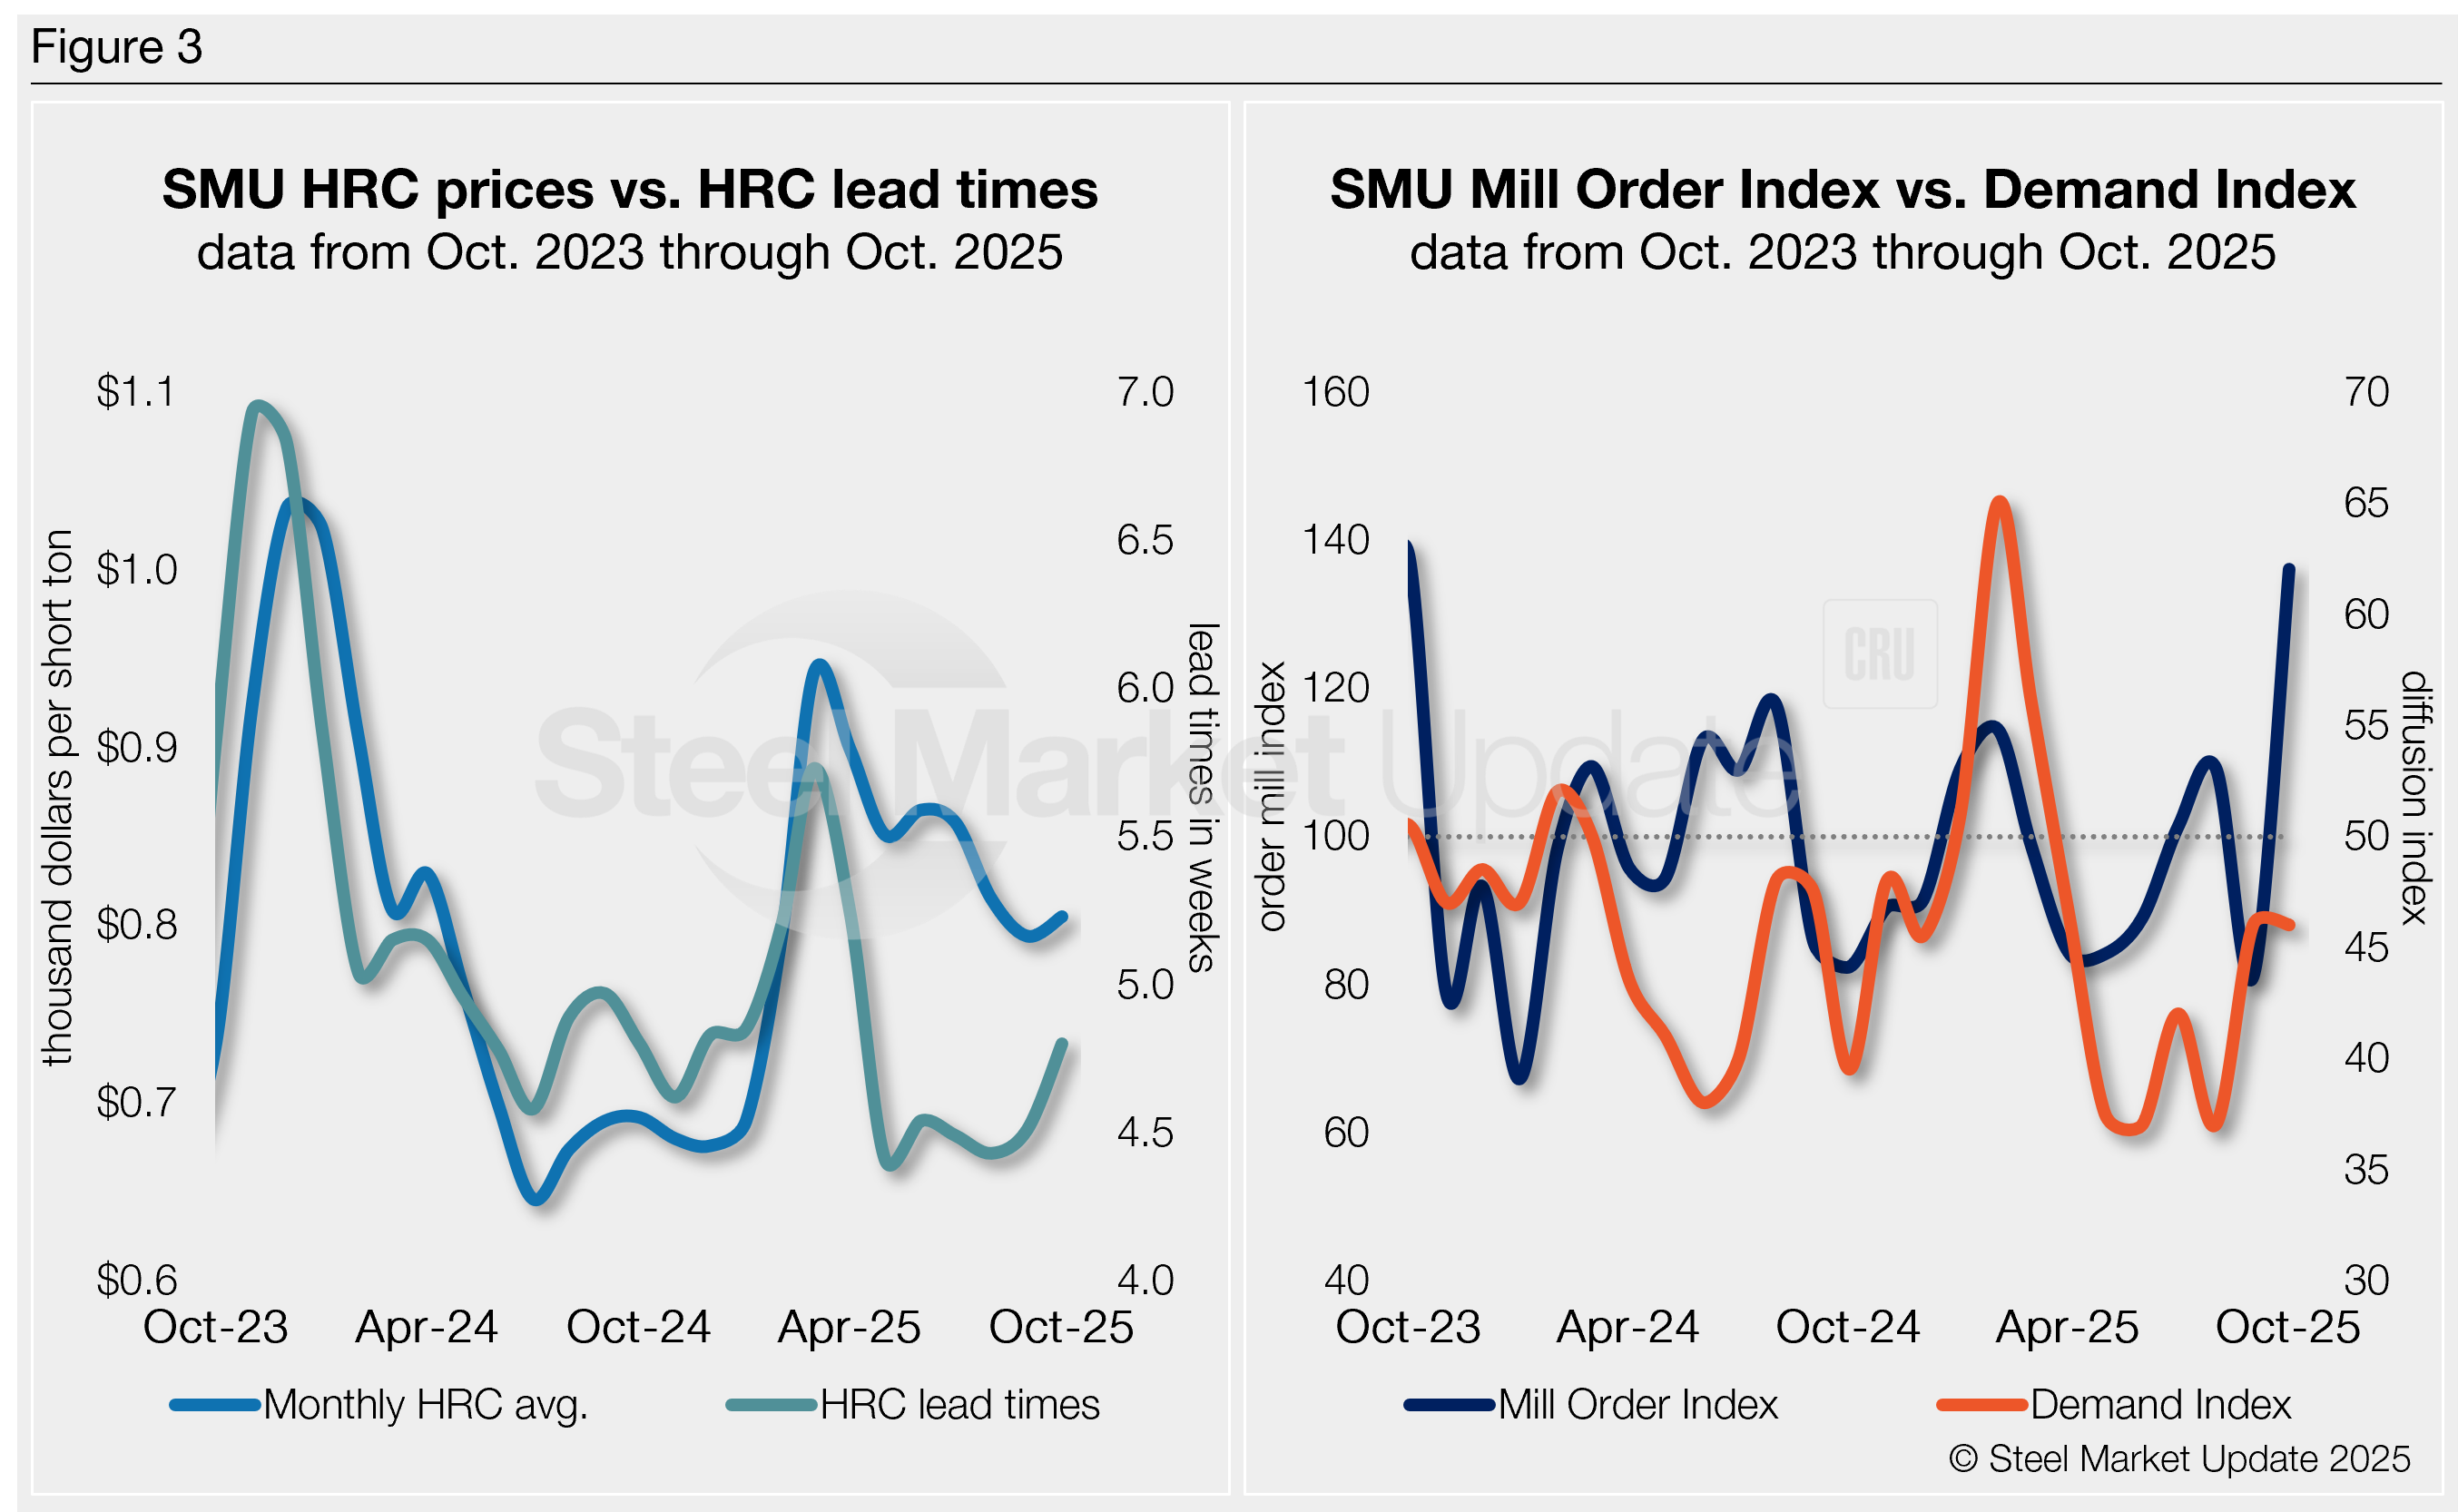
SMU’s MOI pairs well with — and has for the past five years proceeded — moves in mill lead times (Figure 2). And SMU’s lead times have also been a leading indicator of flat-rolled steel prices, particularly for HRC (see left-side chart in Figure 3).
Our MOI also pairs well with our Steel Demand Index (see right-side chart in Figure 3), which, for nearly a decade, has preceded moves in mill lead times.
How it shakes out
Prices have been inching up, and variable-based contracts still incentivize new orders at mills placed in November and even December. Tack on a downstream supply chain filling up to get ahead of present increases, and you have a recipe to further support prices.
But there are still some fundamental demand questions unanswered. And it could all shift November service center shipments up, above demand, leaving an overhang should December and January buying disappoint (see right-side chart in Figure 3).
So, will it last? It’s unclear, especially as the market is on the edge of a slower holiday period. Lead times have been edging higher ahead of the recent price increases, but moderate demand expectations need to shift higher as well.
And don’t forget, service center shipments will need to improve further, followed by a notable and steady shift in demand, to truly support stronger prices. Something some suggest we are starting to see, while others note it’s just too early to tell.
We’ll be tracking any changes closely as we move through the second half of Q4.