
Analysis

September 17, 2026
HR Futures: Sharp recovery in market in 'eventful' times
Written by Gaby Ain
I ended my previous column expecting some eventful times ahead for HRC futures. That proved true almost immediately. By that weekend, the tentative US-Canada trade agreement had fallen through, and the futures market began a sharp recovery. Since then, the curve has not only erased the initial selloff but has moved well beyond where it stood before the agreement was announced.
CME Midwest HRC futures curve (9/17 in white, 9/10 in blue, 8/20 in orange, 8/18 in purple)
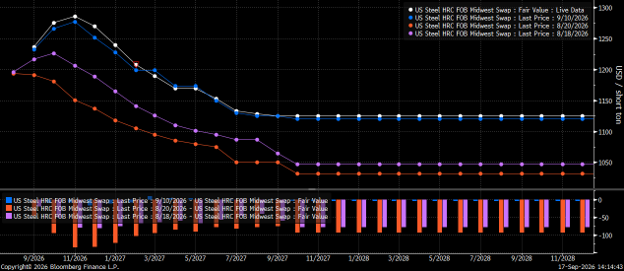
The progression of the curve tells the story. Following news of the tentative Canada agreement, HRC futures sold off broadly (orange from purple), with the belly bearing the brunt of the move. Several nearby and mid curve contracts fell by more than $50, while the long-dated floor shifted from $1,047 to $1,032 per short ton (st). Once the agreement fell apart, that move reversed. And then some. By Sept. 10 (a week ago, blue), much of the mid-curve had rallied by more than $100, while the deferred floor moved up to roughly $1,120/st.
The latest curve (white) extends that move at the front, while the back end has remained comparatively anchored. November 2026 has climbed to $1,286/st, while the longer-dated portion of the curve is at $1,125. That leaves roughly a $1,161 spread between the nearby peak and the 2028 flat. The shape suggests the market is placing a sizable premium on near-term tightness while still pricing eventual normalization, albeit at a higher level than previously assumed.
CME HRC Money-Manager Positioning
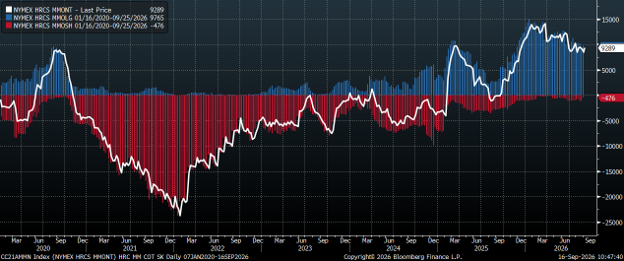
Money manager positioning adds another dimension. Net managed money positioning currently stands at 9,289 contracts and has been oscillating within an approximate 8,400-9,500 range over the past five weeks. Short positions have collapsed from 1,174 contracts on Aug. 28 to only 476, a 59% reduction in three weeks, and the lowest reading since the April 24 all-time low of 87 contracts. That shift is worth watching.
Short covering likely provided fuel as prices accelerated higher, but with the short base now considerably smaller, there is less potential short-covering demand available to support another leg higher. If prices continue to advance, the next leg may therefore depend more heavily on additional long participation and continued support from underlying fundamentals. Conversely, if futures begin to stall, the existing net-long position could become a source of selling pressure if positioning starts to unwind.
None of this removes the headline risk hanging over the market. Trade negotiations with Canada and Mexico remain obvious sources of volatility, and another agreement could prompt a rapid repricing in futures, as the Canada reaction demonstrated. But a futures-market response and a change in the physical market are not necessarily simultaneous (Main Street vs. Wall Street). With lead times extended and spot availability constrained, any additional import tons resulting from any agreement would still need time to reach the domestic market.
That distinction may be increasingly important. The current HRC rally is now a year old, and over that period the futures curve has repeatedly repriced higher and pushed its peak further out. Trade agreements remain a legitimate downside risk, but the question may be less about whether additional supply becomes available and more about how much arrives, how quickly, and whether that volume is sufficient to materially loosen current physical-market conditions.
Disclaimer
The content of this article is for informational purposes only. The views in this article do not represent financial services or advice. Any opinion expressed by Flack Global Metals or Flack Capital Markets should not be treated as a specific inducement to make a particular investment or follow a particular strategy, but only as an expression of his or her opinion. Views and forecasts expressed are as of date indicated, are subject to change without notice, may not come to be and do not represent a recommendation or offer of any particular security, strategy or investment. Strategies mentioned may not be suitable for you. You must make an independent decision regarding investments or strategies mentioned in this article. It is recommended you consider your own particular circumstances and seek the advice of a financial professional before taking action in financial markets.