Product
March 4, 2013
SMU Construction Update March 1st 2013
Written by Peter Wright
Written by: Peter Wright
The Commerce Department releases construction expenditure data on the first working day of each month, referred to as “Construction put in place” or CPIP. This data has to be sub divided because sectors do not move synchronously. They are affected by supply / demand fundamentals and sources of financing. CPIP is reported for multiple project types within the categories, “Private” and “State and Local.”
 Monthly data is notoriously erratic and usually should be considered as a three month moving average, (3MMA). In the case of construction, seasonality is also has a very strong influence. Seasonality can be removed by comparing data year over year on 3MMA and 12MMA bases. The next step is to compare the three and twelve month year over year growth rates. If the growth of the 3MMA is stronger than the 12MMA, the situation is improving and momentum is positive. The reverse indicates negative momentum.
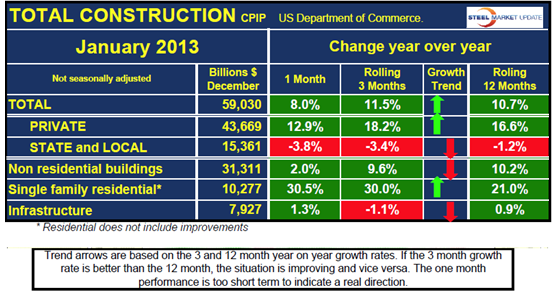
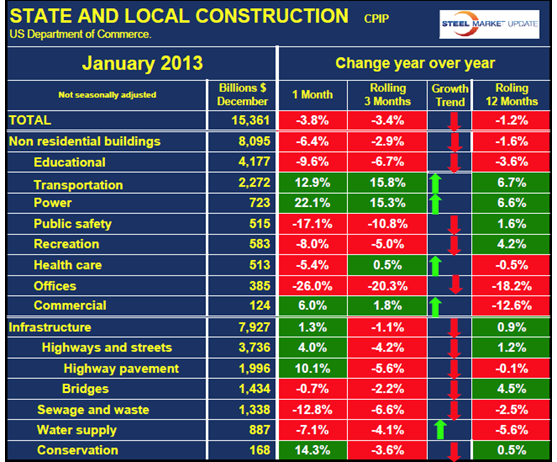
 Figures 1, 2 and 3 show the rolling 12 month expenditures and annualized growth rate for, total, privately financed and state and local government financed construction respectively through January 2013. Total construction grew at an annual rate of 10.7% in twelve months through January, very good news for future steel consumption but the difference between the privately and publicly financed sectors is extreme as shown in Figs 2 and 3. Privately financed construction is growing at an annualized rate of 16.6% and has had positive growth every month since December 2011. Publicly financed work contracted 1.2% in 12 months through January and has contracted every month since January 2010.
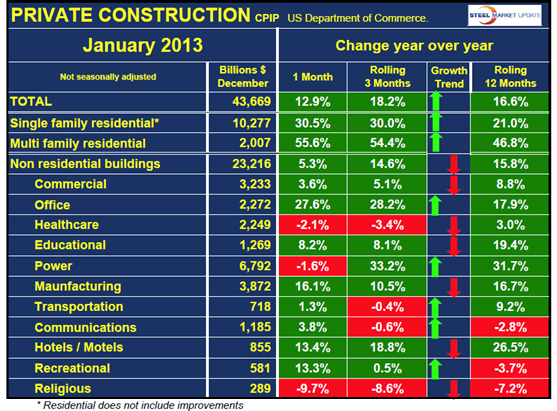
 Table 1 gives a breakdown of total construction into public and private and identifies three of the major categories. These are non residential buildings, single family residential and infrastructure. The growth trend arrows reflect the difference between the 3 and 12 month year / year growth rates. A green arrow indicates positive momentum and red negative. Total non residential building, public plus private grew at 9.6% in the last three months y/y but both sectors are slowing. Residential construction is booming and accelerating led by multi family. The 12 month growth rate of infrastructure has been almost flat-lined for the last six months. Table 2 shows the detail of private construction by project type. Residential construction is the highlight of this sector, particularly multi-family which grew at an annualized rate of 46.8% in the last 12 months and is accelerating. This we believe to be key to the economic recovery as it indicates that personal deleveraging is waning and consumer wealth in terms of household equity is recovering. This will drive personal consumption in 2013 and beyond, will power the economic recovery and promote the growth of steel consumption. By sector, Table 2 shows five non residential building sectors to be accelerating and seven decelerating.