

Market Data

September 22, 2013
Service Center Spot Price Trend Shifting Away from Higher Prices
Written by John Packard
We heard it earlier this month when during our HARDI steel conference call the wholesalers complained of reduced margins due to competitive pressures and mentioned that there were a growing number of non-traditional galvanized suppliers competing for the mechanical contractors business.
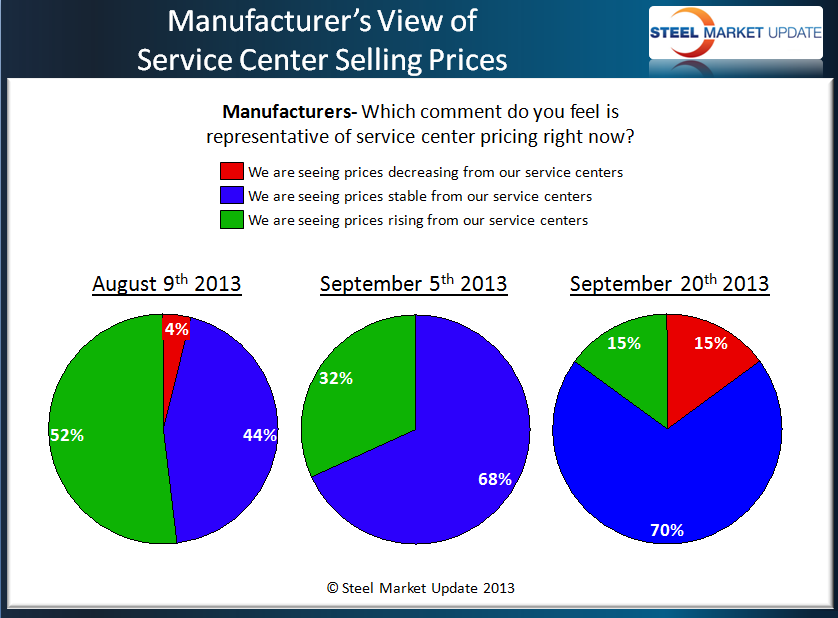
During last week’s steel market review conducted by Steel Market Update (SMU), manufacturing companies reported seeing as many service centers lowering prices as those attempting to increase spot prices (see graphic). At the beginning of August a majority of manufacturing companies reported their service center buyers raising spot prices. Since then, the percentage shrank to 32 percent at the beginning of September and is now at 15 percent. The majority of manufacturing companies are reporting spot prices as being stable. By the way, the thumbnail graphics are “clickable” which will blow up the size for you to be able to read them better
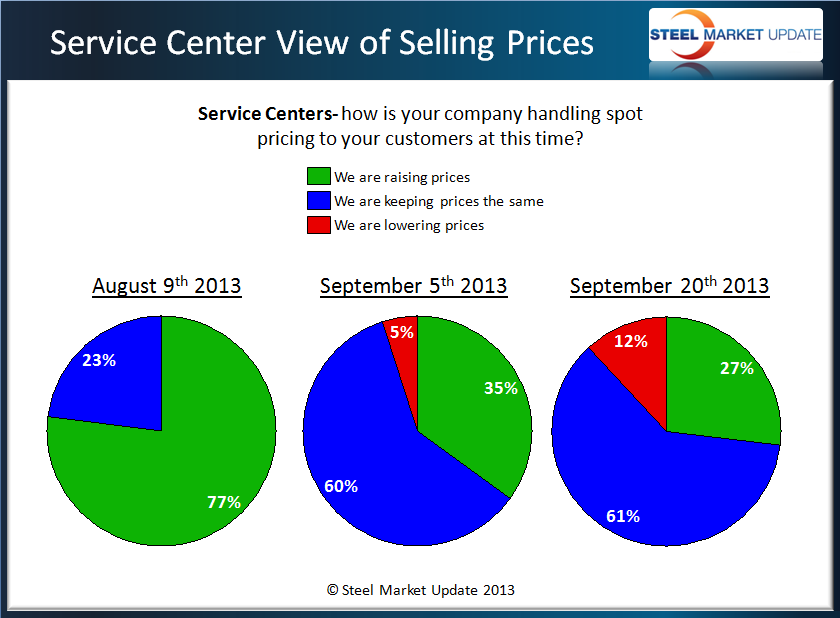
The percentage of service centers reporting their spot prices as dropping increased from 5 percent at the beginning of September to 12 percent this past week. The percentage of distributors raising prices shrank from 35 percent to 27 percent while those reporting spot prices as remaining the same remained steady at 61 percent last week compared to 60 percent at the beginning of the month.
 Steel Market Update believes the strength of the service center spot pricing is directly related to the ability of the domestic steel mills to collect price increases. The trend, at this moment, is moving away from distributors raising spot prices, most likely due to the belief that excess inventory will soon enter the market in the form of USS Lake Erie Works, ThyssenKrupp and AK Steel catching up on their late orders.
What may work to hold spot prices steady is the maintenance going on at ArcelorMittal, the hot strip mill outage scheduled for December at Nucor Berkeley and planned maintenance at Severstal Dearborn and Columbus.


