

Market Data
September 22, 2013
SMU Key Market Indicators
Written by Peter Wright
An explanation of the Key Indicators concept is given at the end of this piece for those readers who are unfamiliar with it.
The total number of indicators considered at present is thirty six. The present situation of eleven of the indicators based on historical standards was positive on September 22nd and thirteen were negative; this was an increase of one to both positive and negative as net imports of long products became negative and the ISM manufacturing index became positive. This is the highest number of positive indicators since this analysis was first published in March when seven indicators were positive by historical standards and fourteen were negative.
The present situation of the general economy is pretty much in a holding pattern with five indicators in neutral, two positive and one negative, no change from last month. The SMU buyer’s index and the SMU service center excess statistics are both currently positive by historical standards.
Present situation indicators for long and flat steel products are similar except that net imports are negative for long and neutral for flat products. All except one of the negative present situation indicators are in the steel and construction sectors. Even though the construction news is generally good the present situation of five of the six indicators is still negative. It is important to recognize that it will be close to 2020 before residential and non residential building construction have recovered and that’s based on an optimistic assumption that we don’t have another downturn before then. The volume of non residential for example is still lower than at any time since 1970 when our statistics begin.
Manufacturing has improved to the point where there are no negative present situation indicators, three of the indicators are OK by historical standards and four are positive.
The quantitative analysis of the value of each indicator over time is shown in the “Trend” column. At present trends are moving in the right direction. Twenty eight of thirty six indicators are improving; this is also the best result since this analysis was initiated in March when seventeen trends were positive and eighteen negative. Seven of eight indicators of the general economy are headed in the right direction. Only bank lending standards have a negative trend and this not by much.
The Steel Market Update buyer’s sentiment index rose by 2.0 from mid August. The service center apparent deficit decreased slightly from 466,000 tons to 433,000 tons still indicating pent up demand that will have to be released sooner or later.
The trends for long products are worse than for flat rolled. Long products have a negative trend in four out of seven indicators, flat rolled in only one out of six. The two main differences are that net imports and service center shipments for longs are trending negative and for flat rolled are both trending positive.
All of the construction indicators except infrastructure expenditures are improving as are all of the manufacturing indicators.
The key indicators analysis confirms our experience that the current market is not great but tells us that most trends which are quantified are moving in the right direction and there is positive momentum. The trends specific to the steel market are believed to be negatively affected by political uncertainty and not to be representative of true demand at the end market level. We believe a continued examination of both the present situation and direction will be a valuable tool for corporate business planning.
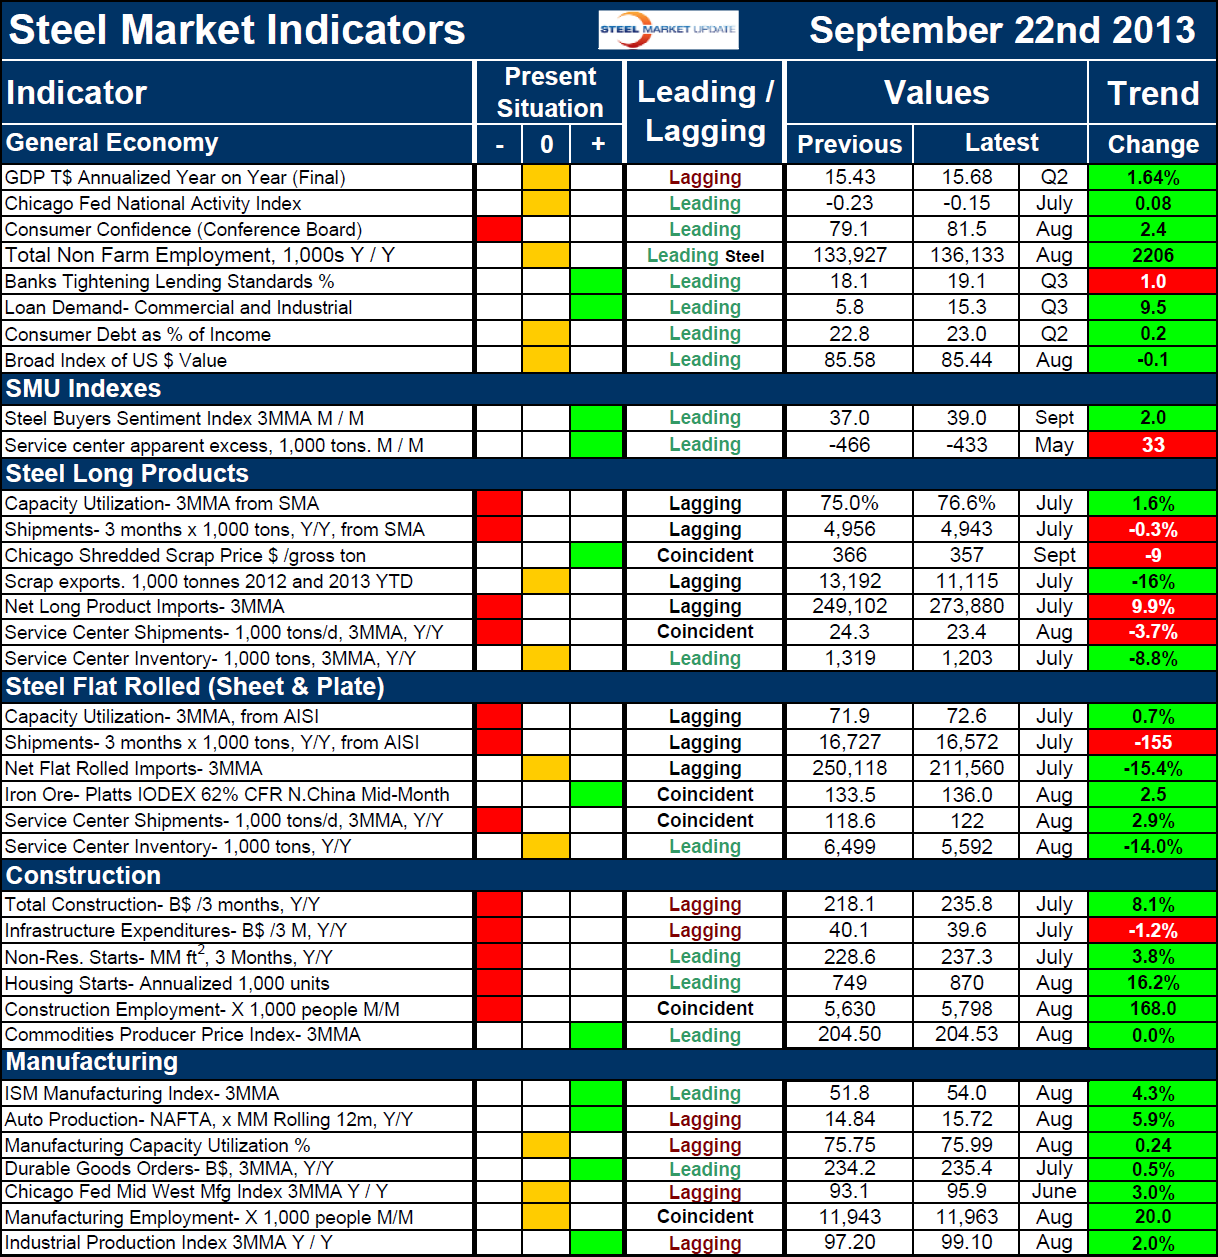
Explanation: The key indicators chart is designed to give a snapshot of the steel market on a specific date. The chart is stacked vertically to separate the primary indicators of the general economy, of proprietary Steel Market Update indices, of both flat rolled and long product market indicators and finally of construction and manufacturing indicators. The indicators are classified as leading, coincident or lagging as indicated.
Columns in the chart are designed to differentiate between the current situation and the direction in which the market is headed. The present situation is sub-divided into, below the historical norm (-), (OK), and above the historical norm (+). The “Values” section of the chart is a quantitative definition of the market’s direction. In cases where seasonality is an issue, the evaluation of market direction is made on a three month moving average basis and compared year over year to eliminate this effect. Where seasonality is not an issue concurrent periods are compared. The date of the latest data is identified in the third values column. Values will always be current as of the date of publication. Finally the far right column quantifies the trend as a percentage or numerical change with color code classification to indicate positive or negative direction.


