

Market Data

October 27, 2013
Durable Goods Orders Up by 6.1%
Written by Peter Wright
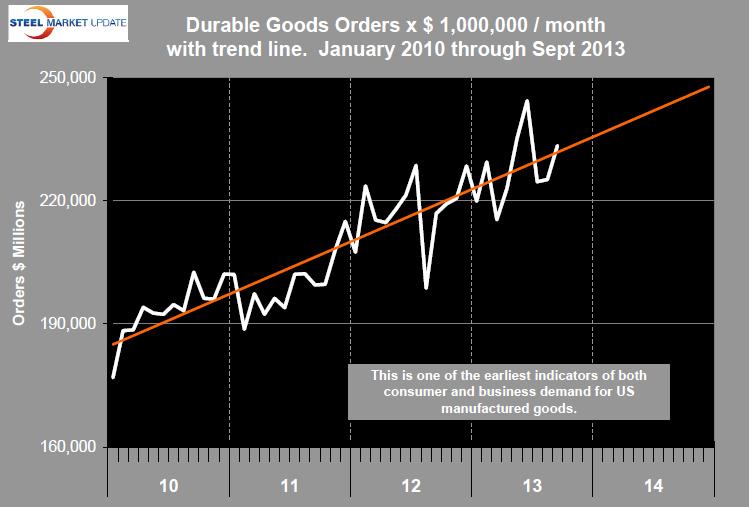
New orders for manufactured durable goods in September came in slightly above trend at $233.411 billion, (Fig 1). This monthly data is very spiky mainly due to erratic orders for civil aircraft. However it is one of the earliest indicators for US manufactured goods and though we are not involved in aviation the overall trend line is very relevant to the steel business.
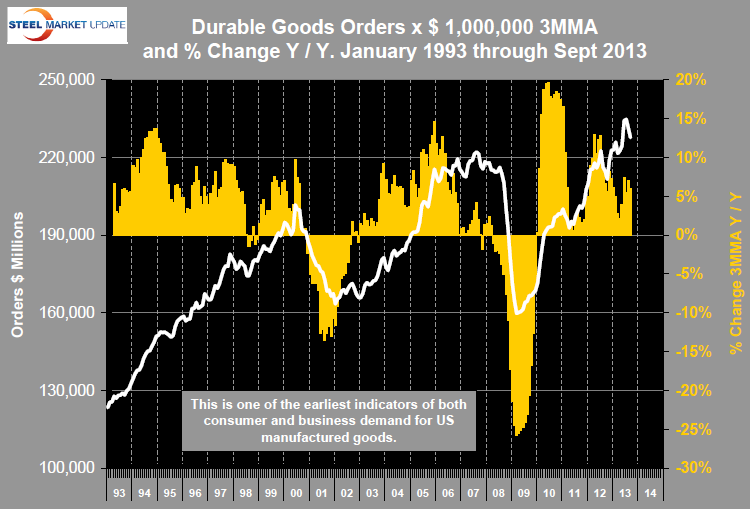 The trend of durable goods orders is a useful reality check for other manufacturing data such as the ISM index, the industrial production index and employment. Even though the monthly durable goods trend is up the three month moving average has declined for the last two months because the months of July and August were well below trend. Year over year orders for Durable goods are up by 6.1 percent, (Fig 2), we believe this is the most relevant number for our businesses and it is included in the “Key Indicators” spread sheet that we publish monthly.
 Moody’s Economy.com published the following conclusion on Friday: Government dysfunction is holding back businesses from investing. Uncertainty leading up to the October shutdown weighed on business and consumer sentiment. Fundamentals still favor additional investment: Firms are highly profitable, financing is accessible and affordable for creditworthy businesses, and labor cost pressures remain extremely low. After the rough patch running through the end of the year, investment will improve.
The unabridged Census Bureau report for September was as follows:
Advance Report on Durable Goods Manufacturers’ Shipments, Inventories and Orders September 2013
New Orders
New orders for manufactured durable goods in September increased $8.2 billion or 3.7 percent to $233.4 billion, the U.S. Census Bureau announced today. This increase, up five of the last six months, followed a 0.2 percent August increase. Excluding transportation, new orders decreased 0.1 percent. Excluding defense, new orders increased 3.2 percent. Transportation equipment, also up five of the last six months, drove the increase, $8.4 billion or 12.3 percent to $77.0 billion. This was led by non-defense aircraft and parts, which increased $6.9 billion.
Shipments
Shipments of manufactured durable goods in September, up two consecutive months, increased $0.5 billion or 0.2 percent to $231.8 billion. This was at the highest level since the series was first published on a NAICS basis in 1992, and followed a 0.8 percent August increase. Primary metals, up five of the last six months, led the increase, $0.2 billion or 0.8 percent to $25.8 billion.
Unfilled Orders
Unfilled orders for manufactured durable goods in September, up seven of the last eight months, increased $8.6 billion or 0.8 percent to $1,041.2 billion. This was at the highest level since the series was first published on a NAICS basis, and followed a 0.1 percent August increase. Transportation equipment, up following two consecutive monthly decreases, led the increase, $7.3 billion or 1.1 percent to $642.1 billion.
Inventories
Inventories of manufactured durable goods in September, up five of the last six months, increased $3.3 billion or 0.9 percent to $382.7 billion. This was at the highest level since the series was first published on a NAICS basis, and followed a 0.1 percent August increase. Transportation equipment, up sixteen of the last seventeen months, led the increase, $1.8 billion or 1.5 percent to $119.0 billion.
Capital Goods
Non-defense new orders for capital goods in September increased $5.2 billion or 6.9 percent to $80.7 billion. Shipments increased $0.3 billion or 0.4 percent to $74.0 billion. Unfilled orders increased $6.7 billion or 1.1 percent to $616.7 billion. Inventories increased $1.4 billion or 0.8 percent to $173.6 billion. Defense new orders for capital goods in September increased $1.2 billion or 13.4 percent to $9.8 billion. Shipments decreased $0.6 billion or 6.0 percent to $9.6 billion. Unfilled orders increased $0.1 billion or 0.1 percent to $167.8 billion. Inventories increased $0.8 billion or 3.8 percent to $23.0 billion.


