

Market Data

November 11, 2013
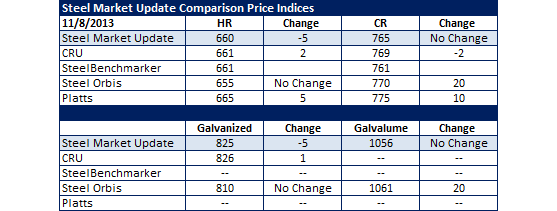
SMU Comparison Price Indices
Written by John Packard
All of the indices continue to show strength at the domestic steel mills as prices remained relatively steady to rising this past week. Even with the minor drop in hot rolled and galvanized by our own index which we attribute to just the way the data fell this past week. Steel Market Update continues to see the market as moving higher and our SMU Price Momentum Indicator is reflecting higher flat rolled steel prices over the short term (next 30 to 60 days).
FOB Points for each index:
SMU: Domestic Mill, East of the Rockies.
CRU: Midwest Mill, East of the Rockies.
SteelBenchmarker: Domestic Mill, East of the Mississippi.
SteelOrbis: Midwest Domestic Mill.
Platts: Within 200-300 mile radius of Northern Indiana Domestic Mill.


