

Prices

November 25, 2013
September 2013 Imports by Product, Port and Country
Written by Brett Linton
Once per month Steel Market Update publishes reports on flat rolled imports into the United States by product, port and country of origin. The result is a fairly massive report which is difficult to reproduce in our newsletter but is in our new website.
The totals in the report are accurate. However, we have removed countries whose exports to the United States are less than 2,000 tons in order to keep the report from becoming overwhelming.
The most recent report is for the month of September 2013 (all tons shown are net tons):
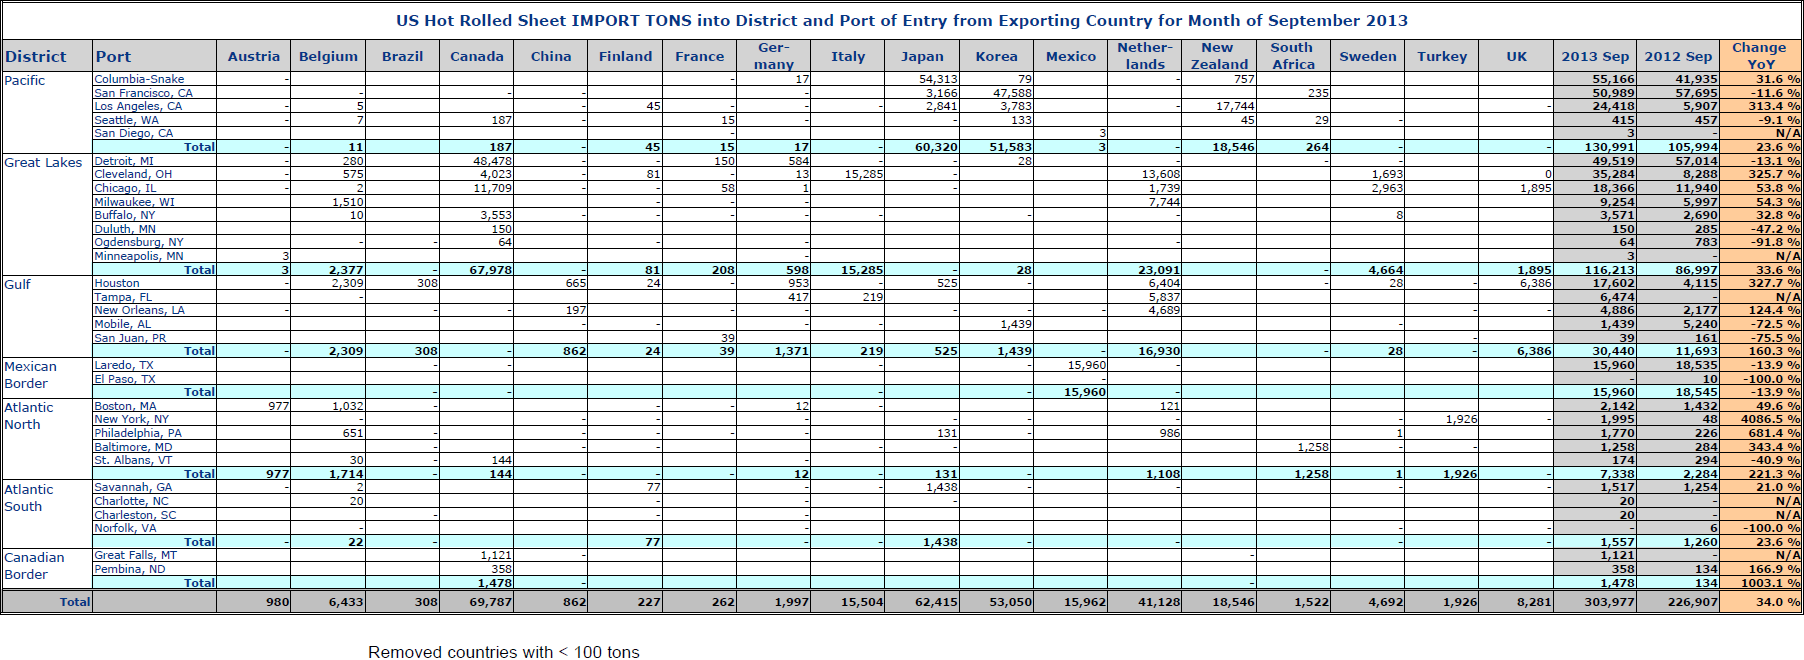
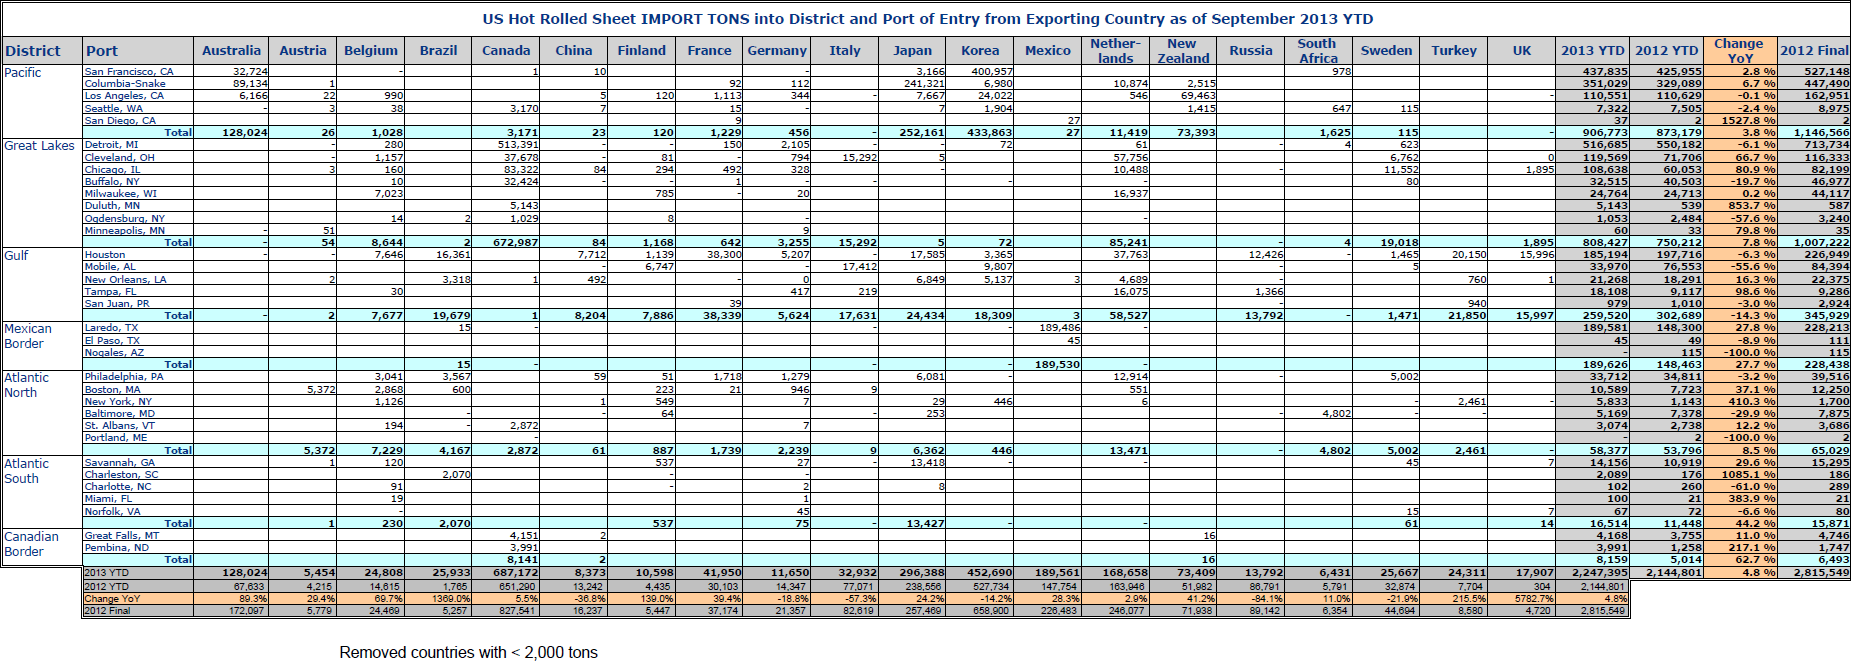
Total hot rolled imports for September 2013 were 303,977 tons, up 2.7 percent from the previous month. 2013 year-to-date (YTD) imports were 2,247,395 tons, up 4.8 percent compared to the first 9 months of 2012. The primary exporting countries for hot rolled were Canada, Japan, Korea, and the Netherlands, accounting for 74.4 percent of total imports.
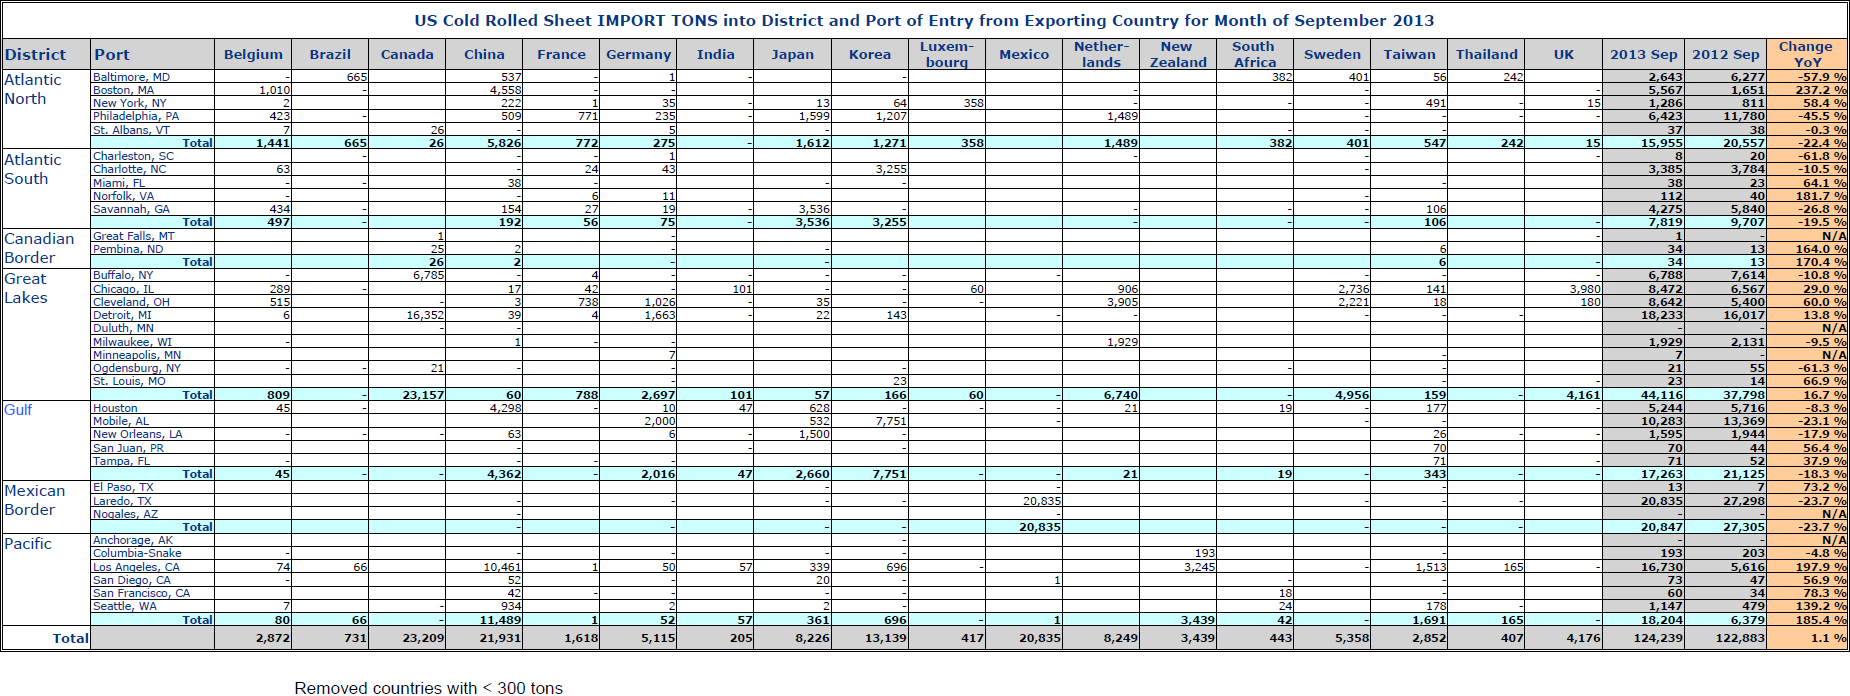
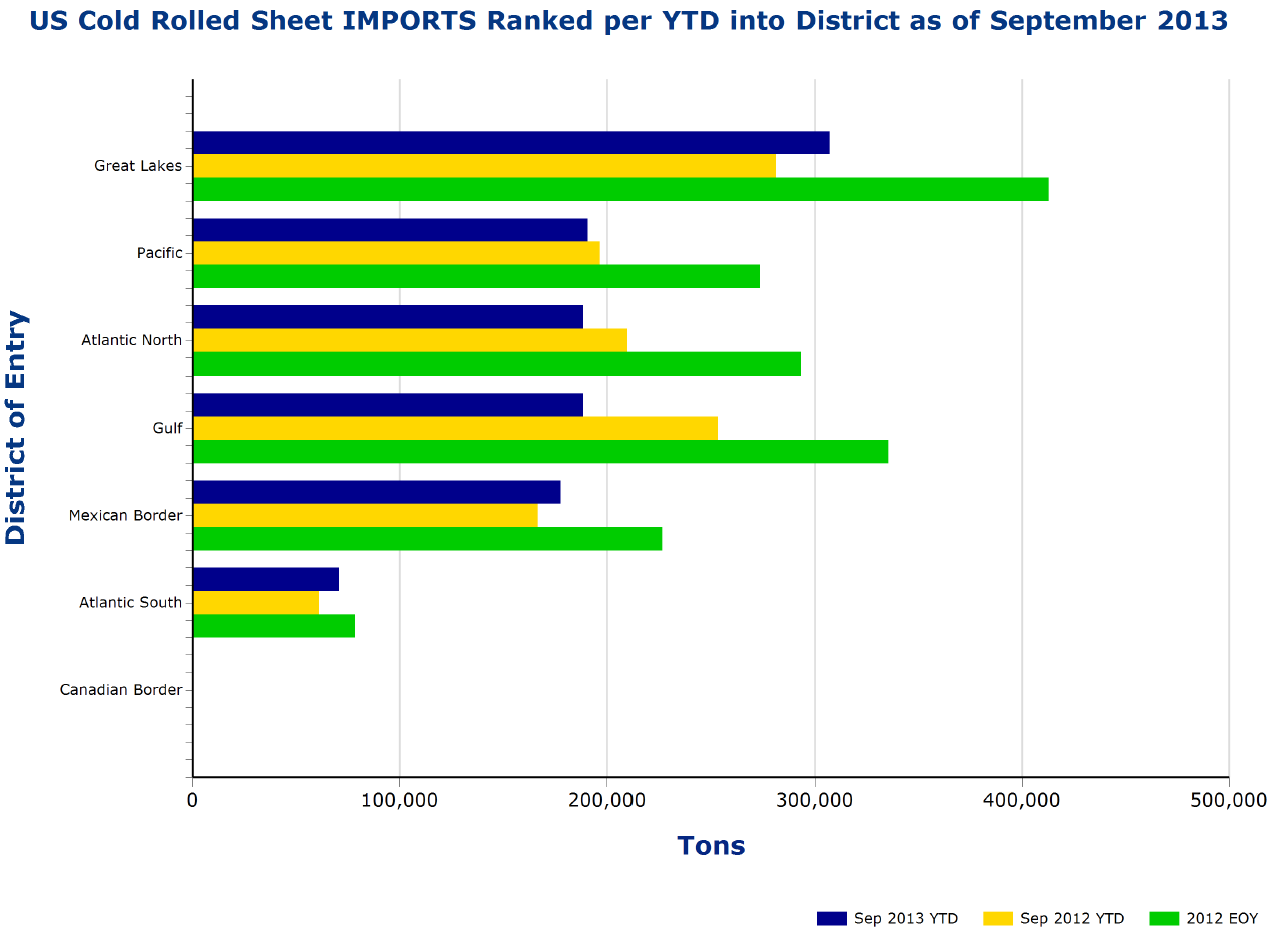
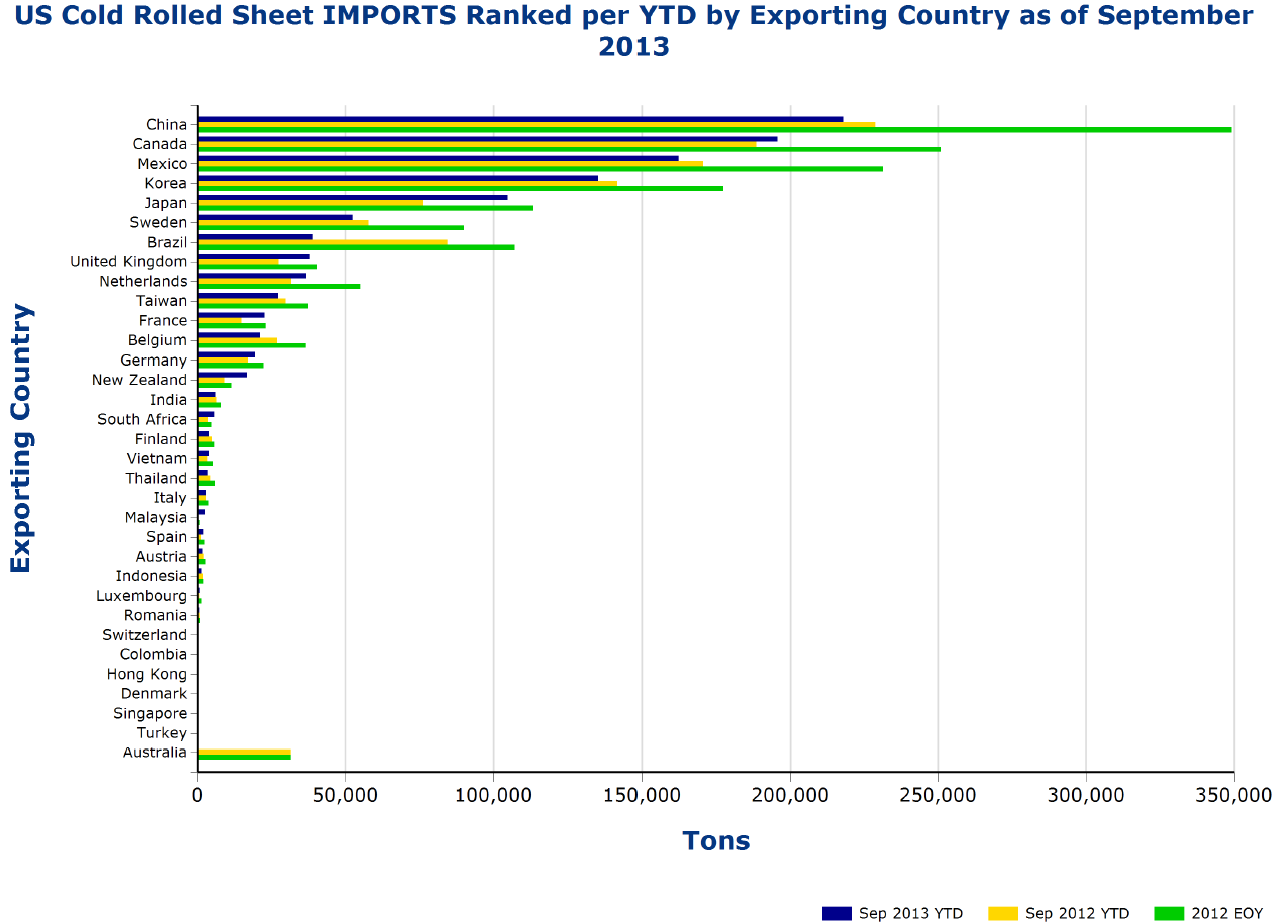
Total cold rolled imports for September 2013 were 124,239 tons, up 16.3 percent from the previous month. 2013 YTD imports were 1,123,757 tons, down 3.9 percent compared to the first 9 months of 2012. The primary countries of export were Canada, China, Japan, Korea, and Mexico combining for 70.3 percent of the total.
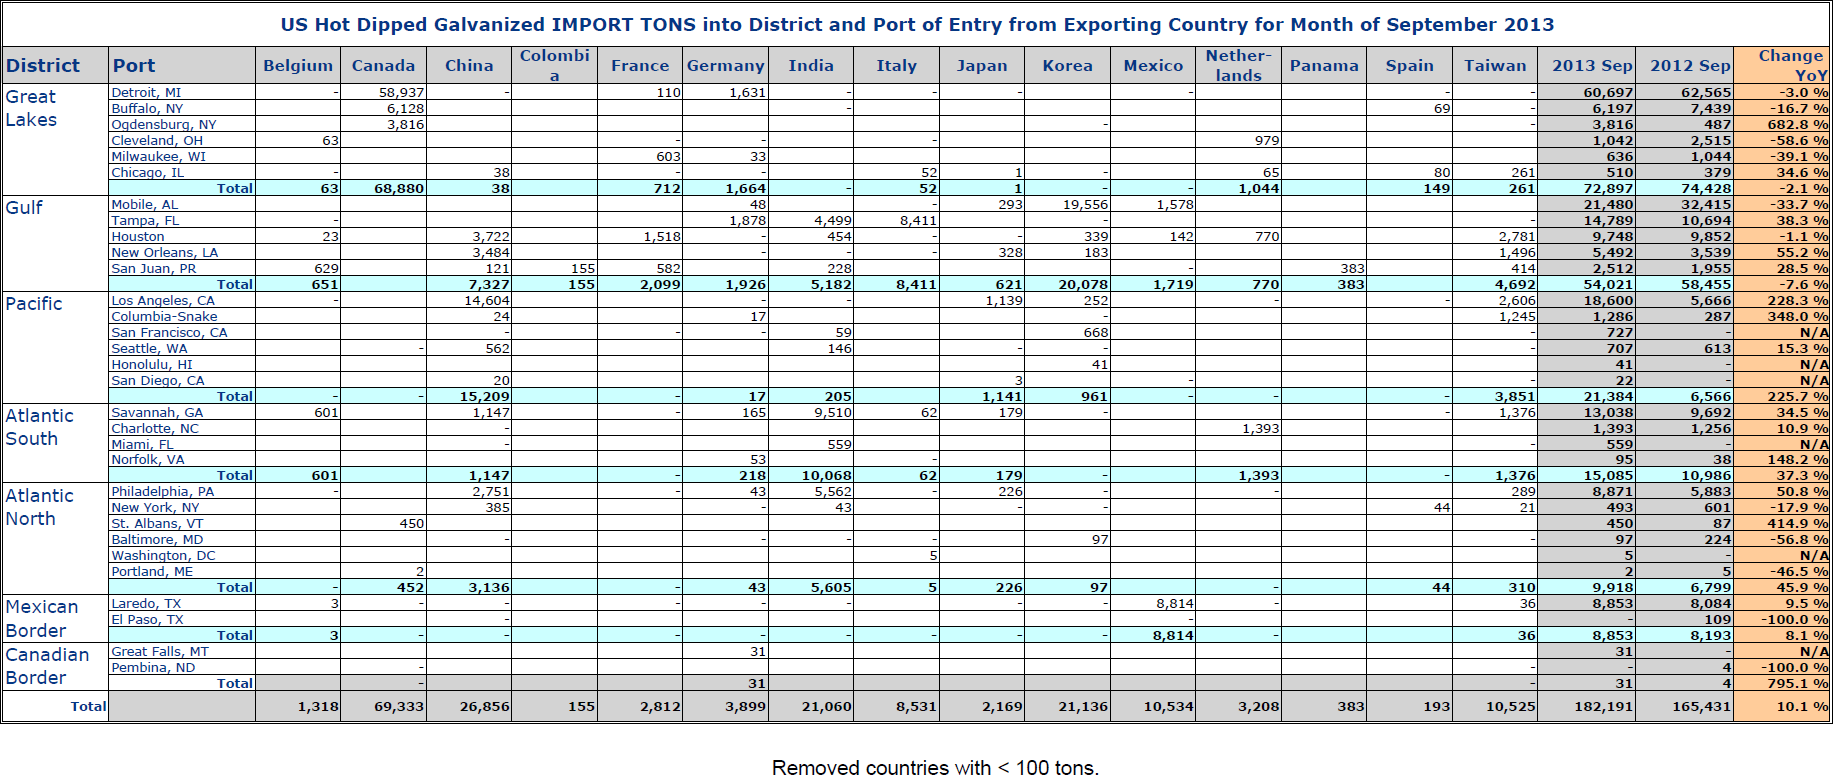
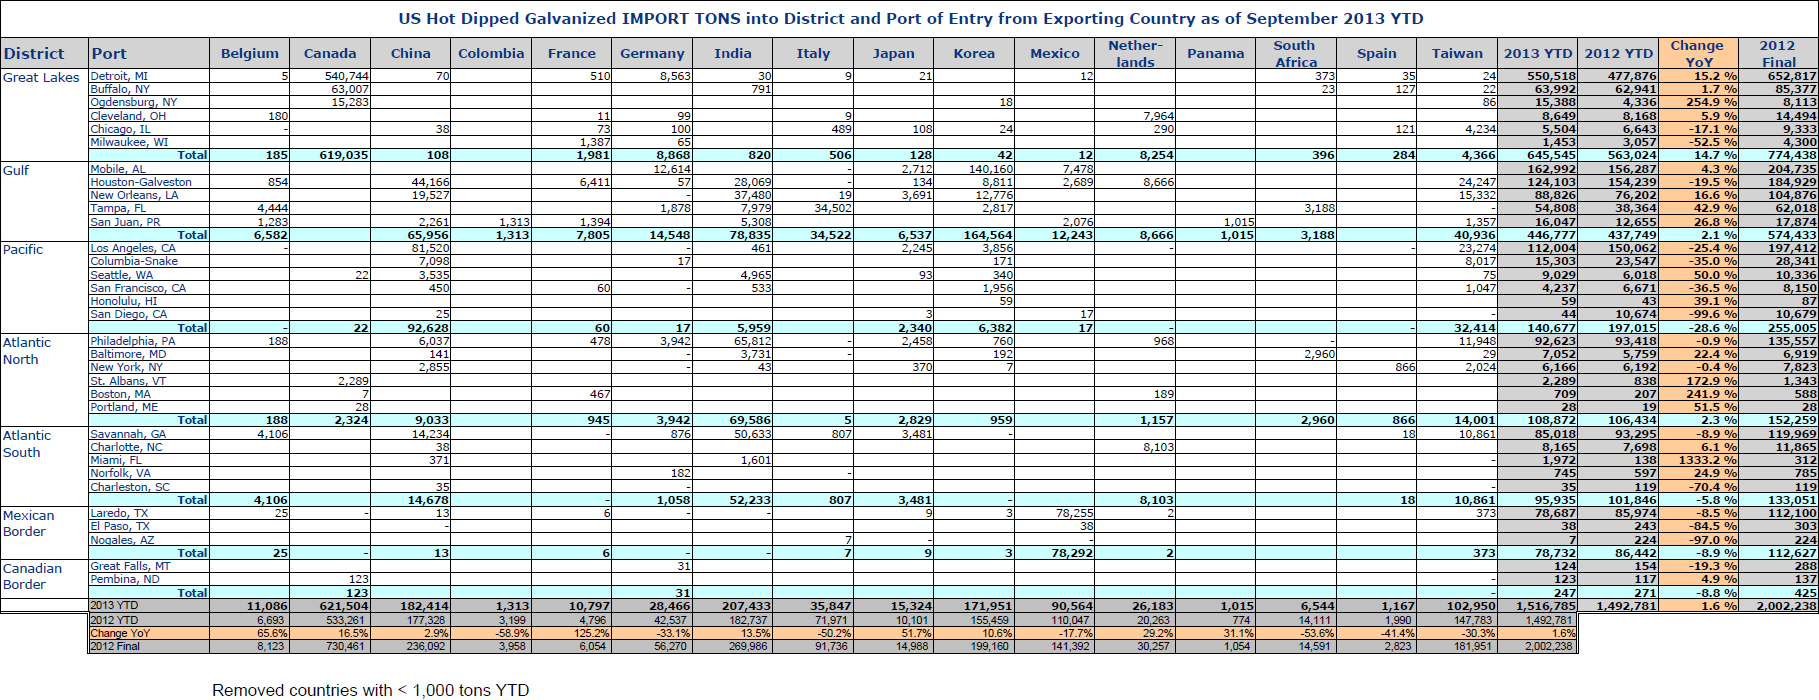
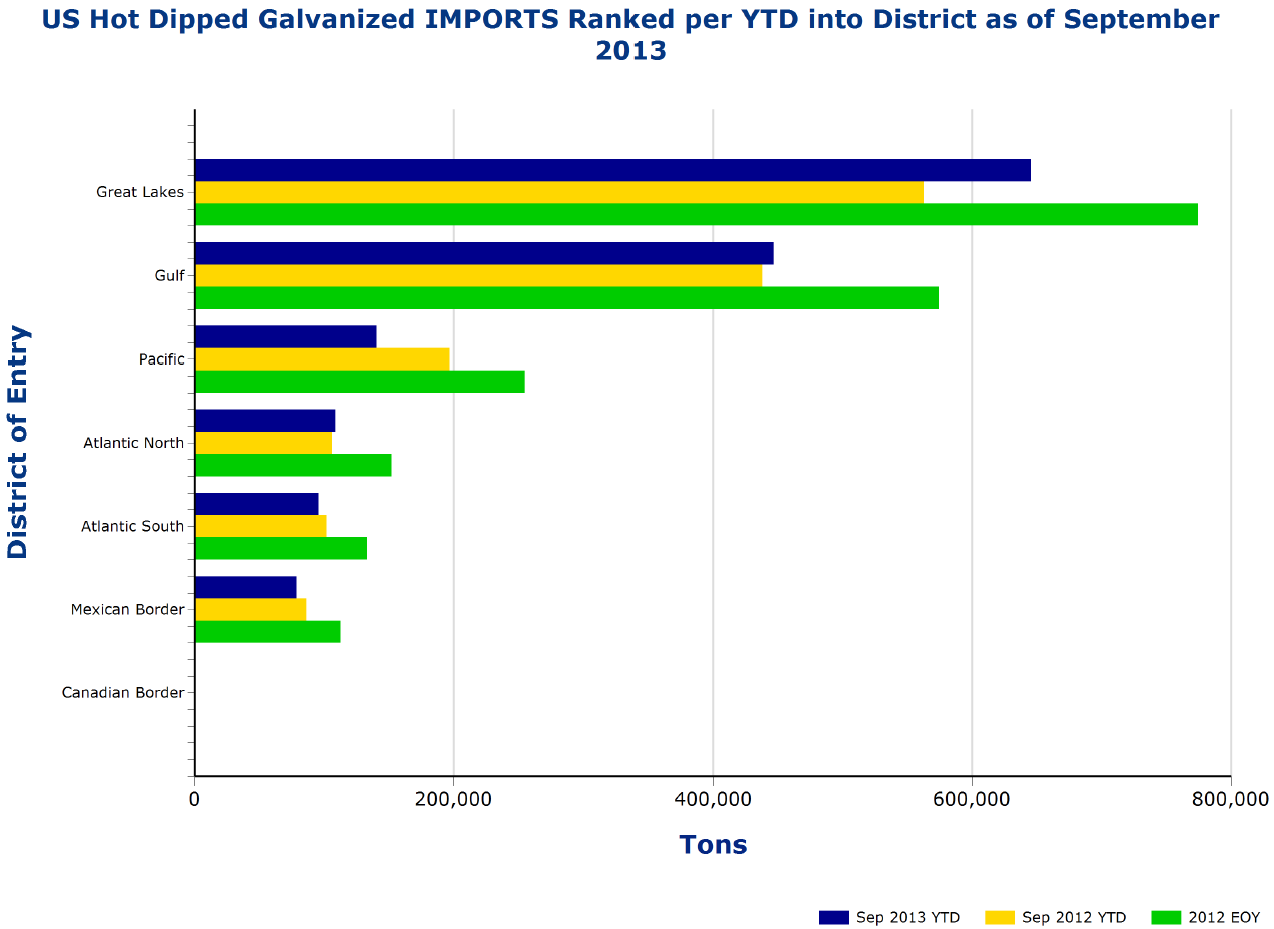
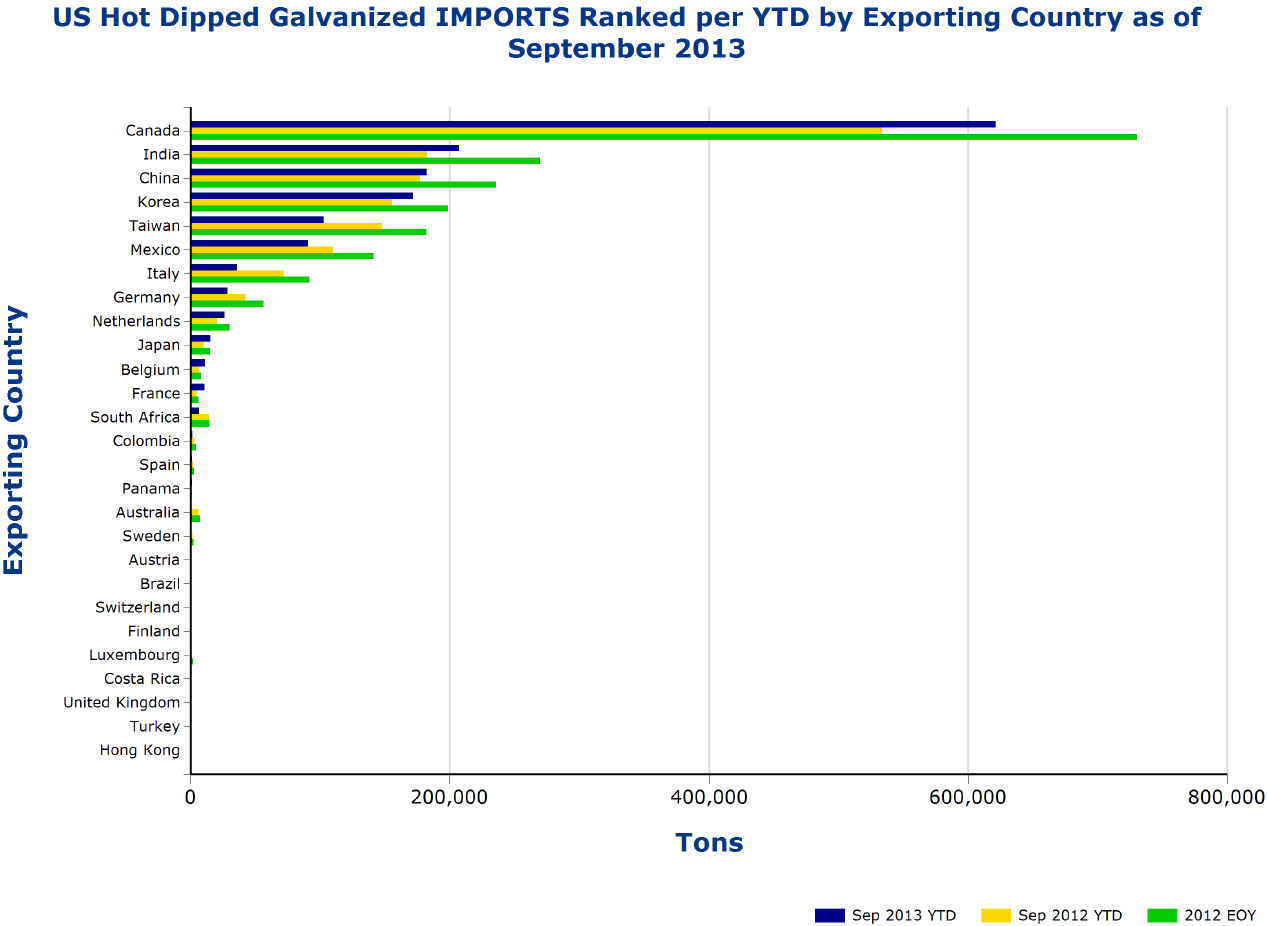
Total galvanized imports for September 2013 were 182,191 tons, down 6.8 percent from the previous month. 2013 YTD imports were 1,516,785 tons, up 1.6 percent compared to the first 9 months of 2012. The primary countries of export were Canada, China, India, and Korea, accounting for 76.0 percent of total imports.
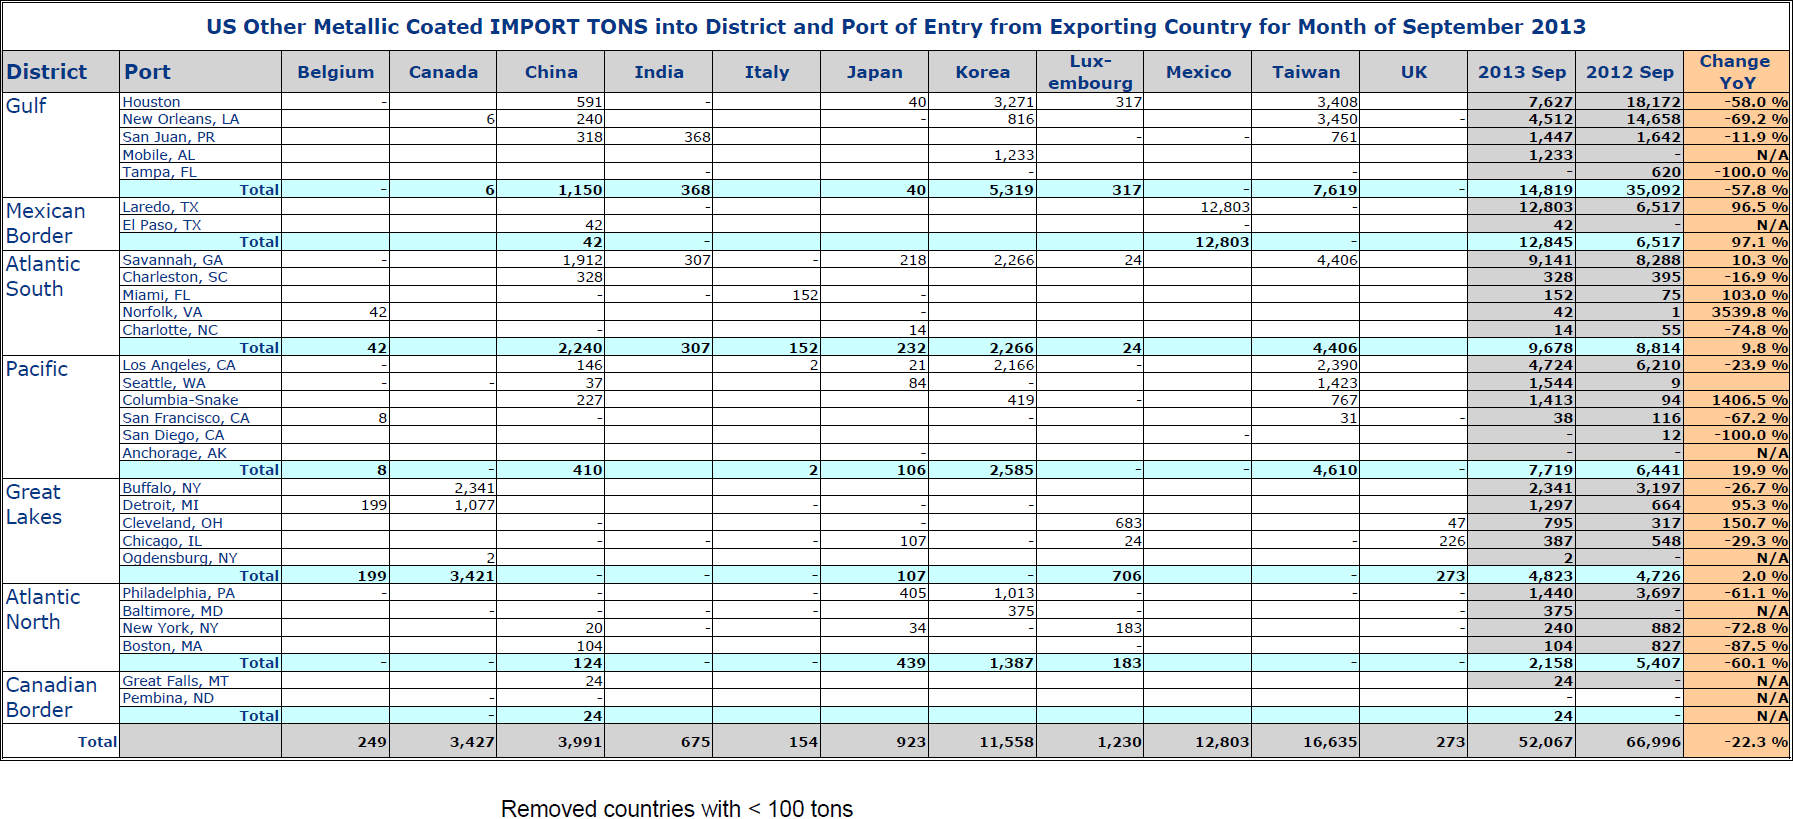
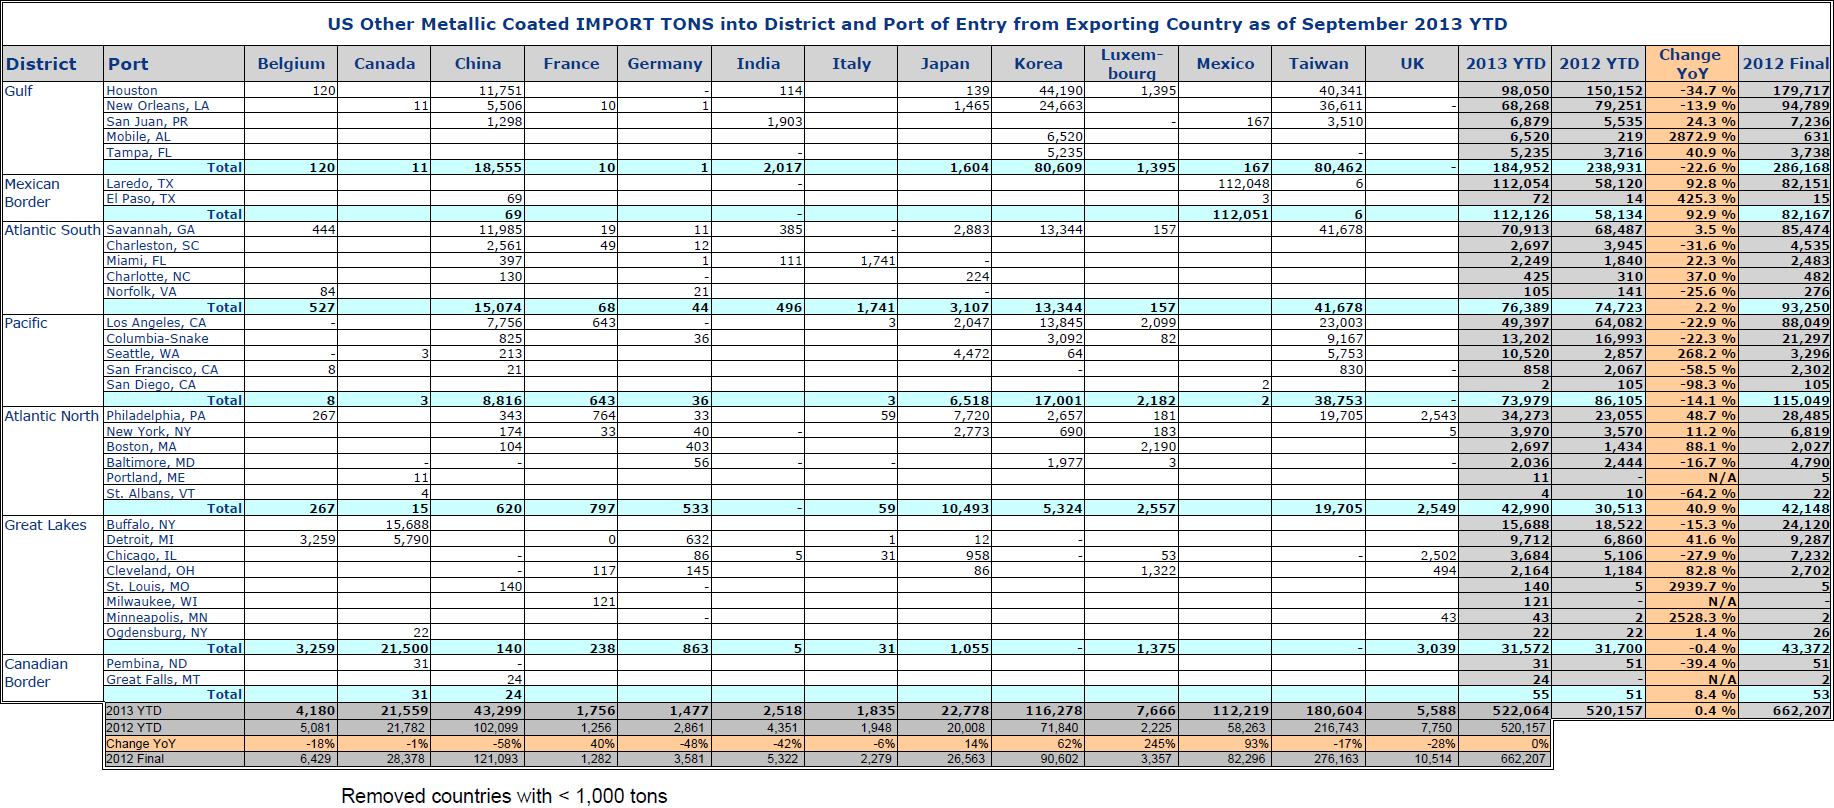
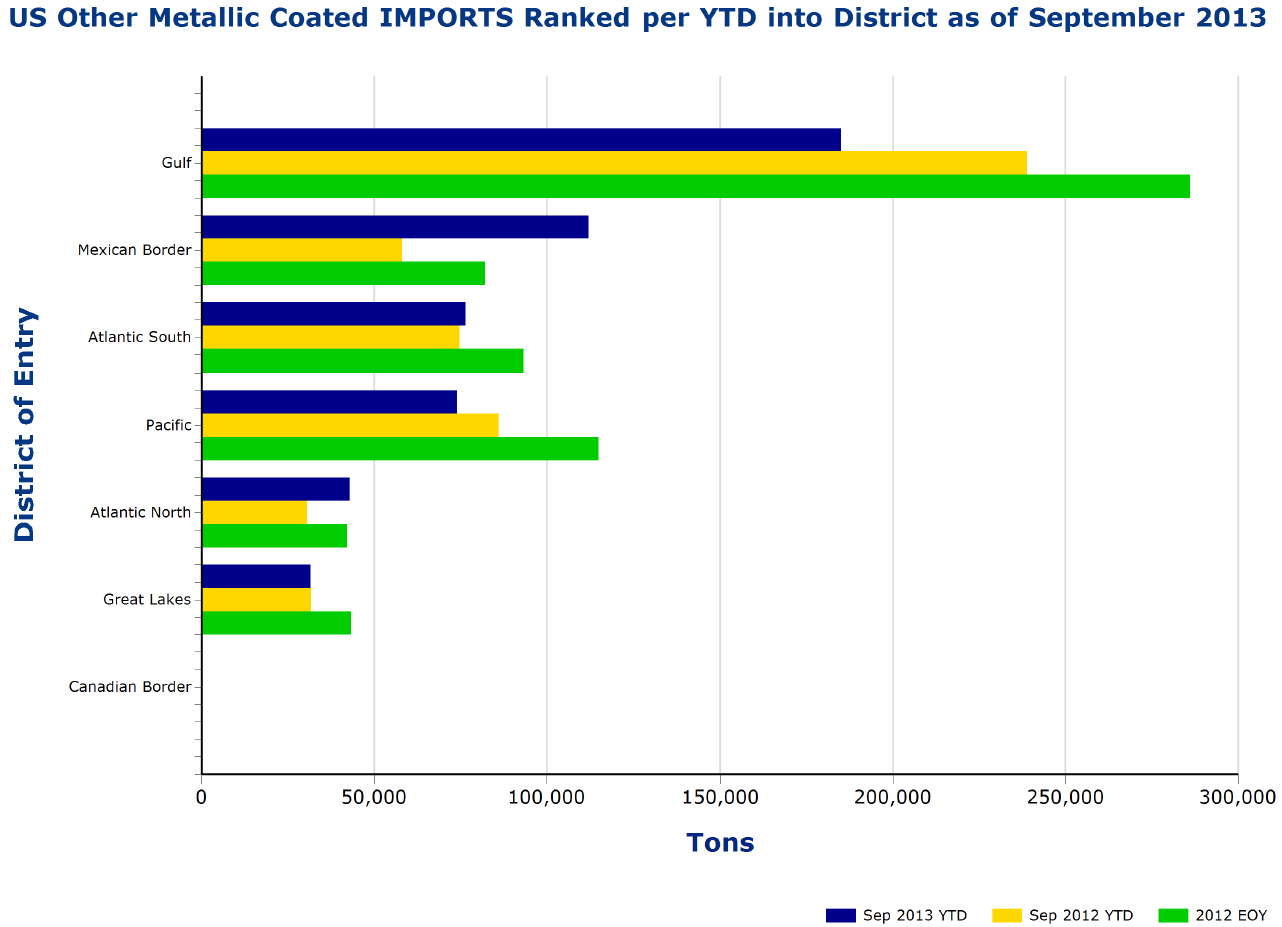
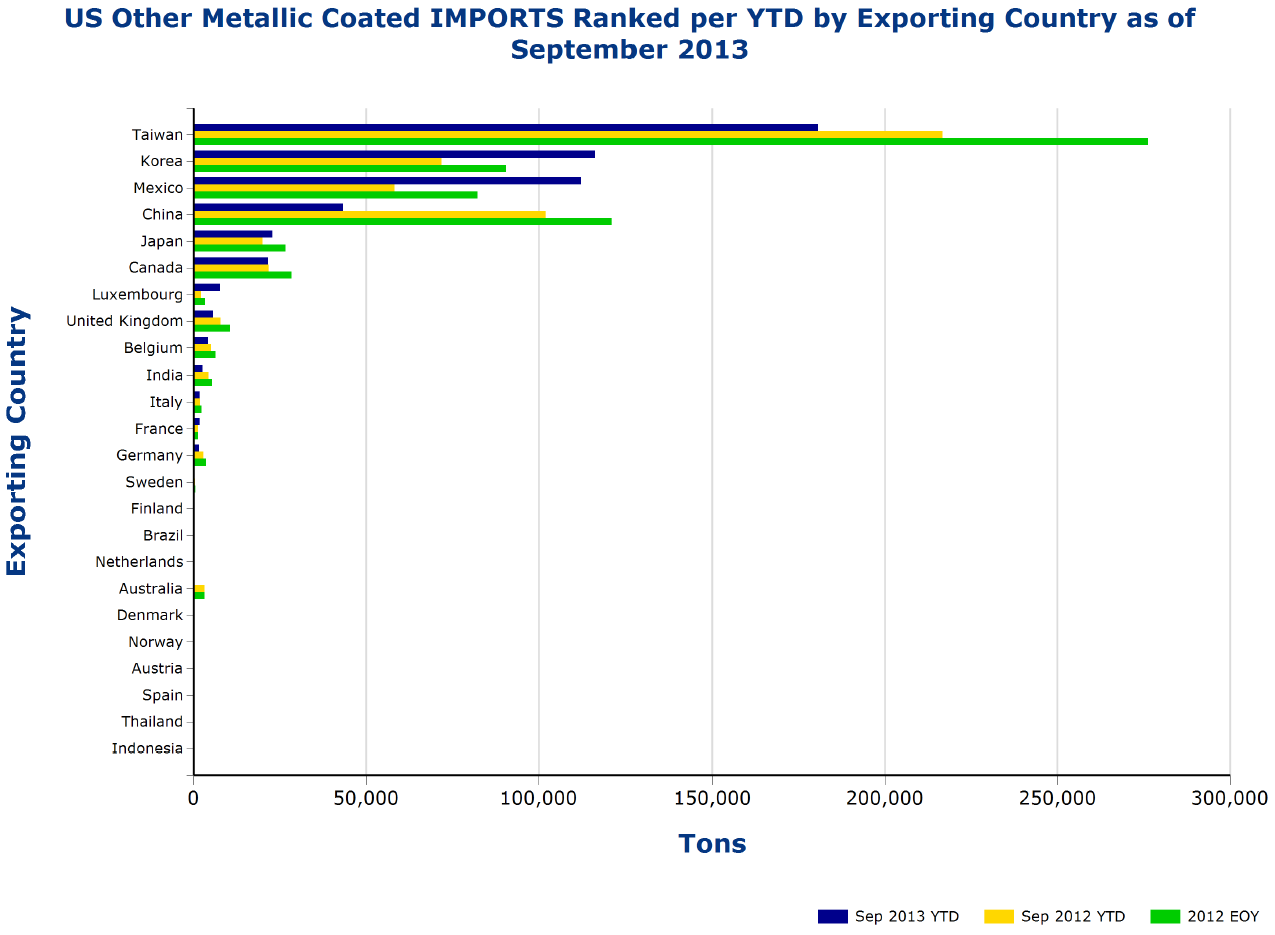
Total other metallic coated imports for September 2013 were 52,067 tons, down 27.3 percent from the previous month. 2013 YTD imports were 522,064 tons, up 0.4 percent compared to the first 9 months of 2012.The primary countries of export were Korea, Mexico, and Taiwan, combining for 78.7 percent of the total.
Below are links to the tables and figures for September imports by product, port and country, along with an explanation of each table and figure.
– Table 1 displays imports into district and port from exporting country for the month.
– Table 2 displays imports into district and port from exporting country for the year-to-date.
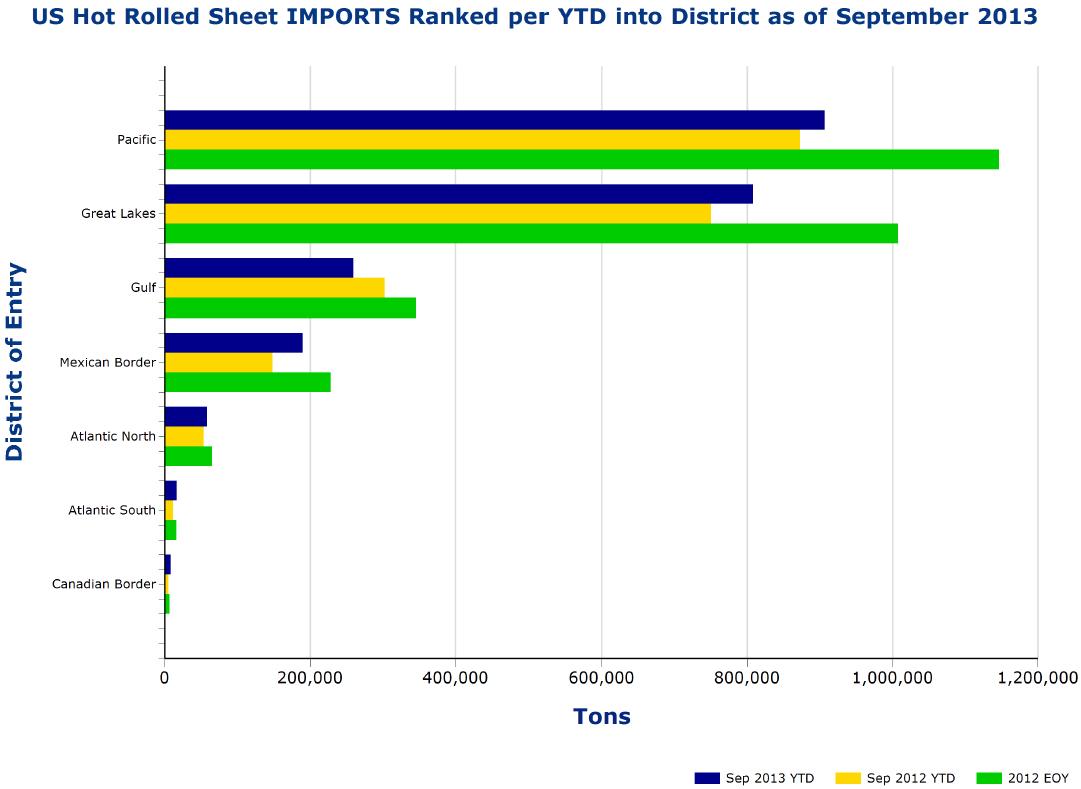
– Figure 1 displays imports ranked per year-to-date into district.
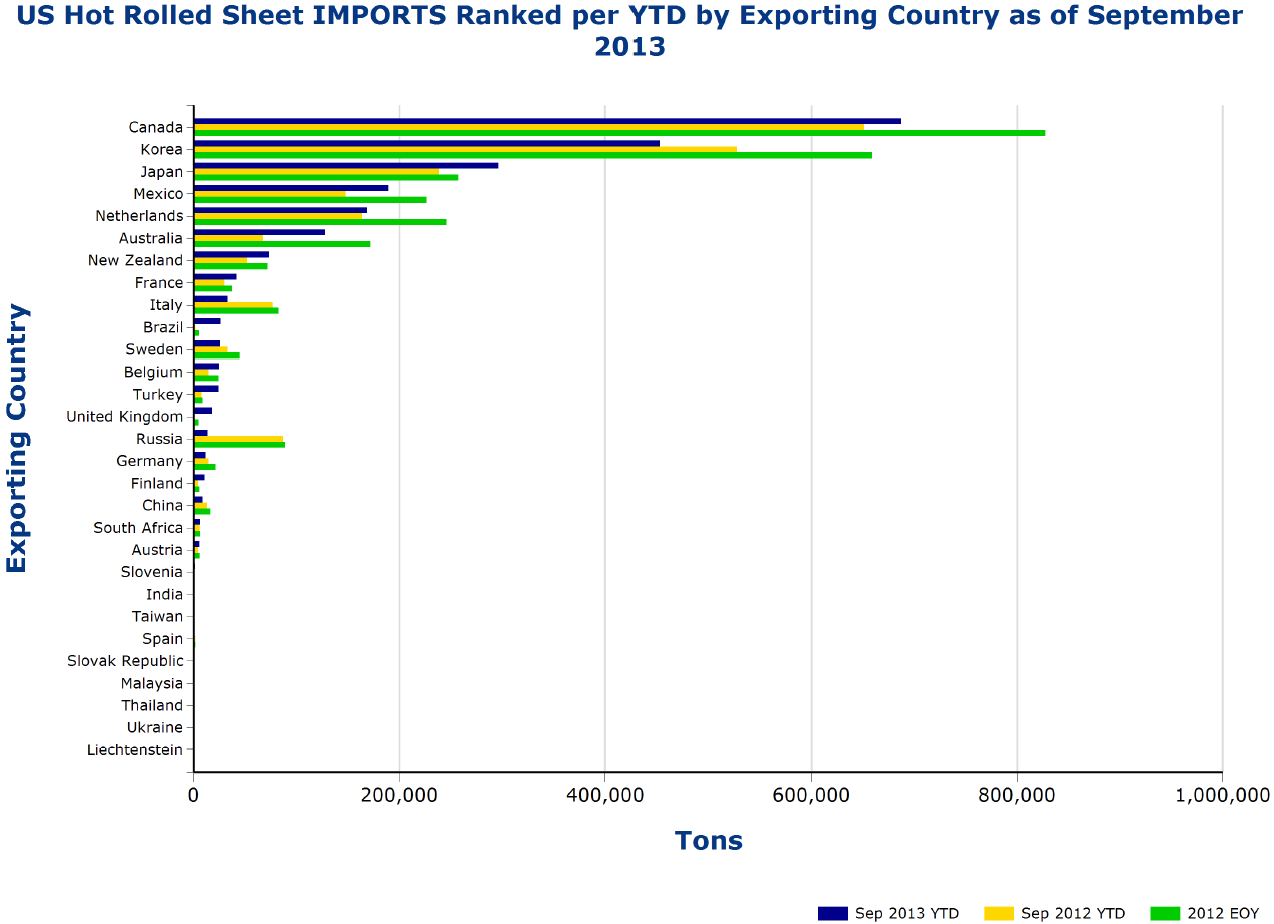
– Figure 2 displays imports ranked per year-to-date by exporting country.
Hot Rolled- Table 1 Table 2 Figure 1 Figure 2
Cold Rolled- Table 1 Table 2 Figure 1 Figure 2


