

Market Data

December 1, 2013
SMU Comparison Price Indices: Quiet Week
Written by John Packard
Steel Market Update (SMU) follows four other indices besides our own and provides the data to our members on a weekly basis. Recently, we asked our readers if they would like for us to continue providing CRU data and the responses indicated there continues to be an interest in their numbers. We have agreed to a new contact with CRU and will continue to supply the numbers over the next 12 months.
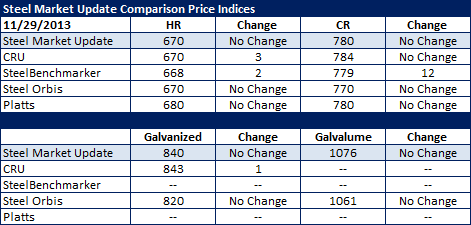
With the exception of SteelBenchmarker, prices remained unchanged over the past week. SteelBenchmarker, which only produces prices twice per month, did come out with new numbers which essentially, caught them up with the rest of the indexes.
The benchmark hot rolled numbers show almost every index at $670 per ton with the exception of Platts which is $10 per ton higher. The indexes are referencing cold rolled at $780 per ton (or close) with the exception of Steel Orbis which is $10 per ton lower. Steel Orbis is also referencing galvanized and Galvalume prices much lower than where SMU and CRU have set our averages.
FOB Points for each index:
SMU: Domestic Mill, East of the Rockies.
CRU: Midwest Mill, East of the Rockies.
SteelBenchmarker: Domestic Mill, East of the Mississippi.
SteelOrbis: Midwest Domestic Mill.
Platts: Within 200-300 mile radius of Northern Indiana Domestic Mill.


