

Market Data

December 15, 2013
SMU Comparison Price Indices: Have Prices Peaked?
Written by John Packard
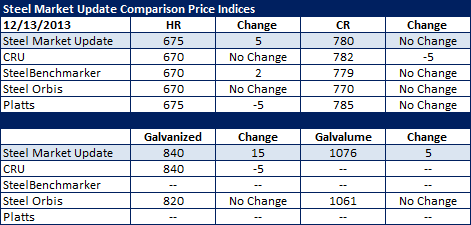
The spread between the various indices followed by Steel Market Update narrowed this past week with only $5 separating the indexes on benchmark hot rolled coil pricing. Platts dropped $5 per ton and met Steel Market Update at $675 per ton while all of the other indices came in at $670 per ton. Cold rolled was also in a very tight range with only $6 per ton separating the highest from the lowest average price.
An interesting development we are beginning to see is fluctuations in pricing both up and down. This week saw lower hot rolled prices out of Platts while the CRU adjusted cold rolled and galvanized prices lower.
FOB Points for each index:
SMU: Domestic Mill, East of the Rockies.
CRU: Midwest Mill, East of the Rockies.
SteelBenchmarker: Domestic Mill, East of the Mississippi.
SteelOrbis: Midwest Domestic Mill.
Platts: Within 200-300 mile radius of Northern Indiana Domestic Mill.


