SMU Data and Models
![](https://www.steelmarketupdate.com/wp-content/uploads/sites/2/media/k2/items/src/d4433e7cc4295f3d880dbab4026c1312.jpg)
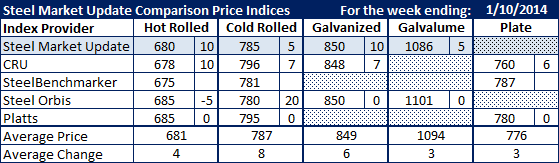
SMU Comparison Price Indices: Prices Move Higher
Written by John Packard
January 12, 2014
Flat rolled steel prices began to rise this past week according to the steel indices releasing data for the week. Benchmark hot rolled now averages $681 per ton with the range being $675 to $685 per ton (although the $675 is from SteelBenchmarker who did not report new numbers last week). Cold rolled is approaching $800 per ton and both galvanized and Galvalume also saw modest increases.
FOB Points for each index:
SMU: Domestic Mill, East of the Rockies.
CRU: Midwest Mill, East of the Rockies.
SteelBenchmarker: Domestic Mill, East of the Mississippi.
SteelOrbis: Midwest Domestic Mill.
Platts: Northern Indiana Domestic Mill.
![](https://www.steelmarketupdate.com/wp-content/uploads/sites/2/2023/04/john-packard.png)
John Packard
Read more from John PackardLatest in SMU Data and Models
![](https://www.steelmarketupdate.com/wp-content/uploads/sites/2/images/Featured_News_Icons/Premium1.png)
Steelmaking raw material prices ease in July
The majority of steelmaking raw material prices declined in June, following the same trend seen in May, according to SMU’s latest analysis.
![](https://www.steelmarketupdate.com/wp-content/uploads/sites/2/2024/01/cropped-SMU_Mobile_final.png)
SMU price ranges: HR declines moderate. Are we near a bottom?
SMU’s sheet price ranges slid again this week. But the declines were more pronounced on tandem products whereas prices for hot-rolled coil held roughly steady.
![](https://www.steelmarketupdate.com/wp-content/uploads/sites/2/images/Featured_News_Icons/Premium1.png)
Some SMU Key Market Indicators improve, others remain near historic lows
SMU’s Key Market Indicators include data on the economy, raw materials, manufacturing, construction, and steel sheet and long products. They offer a snapshot of current sentiment and the near-term expected trajectory of the economy. All told, nine key indicators point lower, 16 are neutral, and 13 point higher. One thing worth noting: The nine indicators pointing lower are all lagging indicators. Many of those pointing upward are leading indicators.
![](https://www.steelmarketupdate.com/wp-content/uploads/sites/2/2024/01/cropped-SMU_Mobile_final.png)
SMU survey: Steel Buyers’ Sentiment Indices rebound
SMU’s Steel Buyers’ Sentiment Indices both saw improvement this week. Current sentiment ticked higher but remains near the four-year low seen earlier this month. Future Sentiment continues to indicate that buyers are optimistic for future business conditions.
![](https://www.steelmarketupdate.com/wp-content/uploads/sites/2/images/Featured_News_Icons/Premium1.png)
SMU market survey results now available
The latest SMU market survey results are now available on our website to all premium members. After logging in at steelmarketupdate.com, visit the pricing and analysis tab and look under the “survey results” section for “latest survey results.” Historical survey results are also available under that selection. If you need help accessing the survey results, or if your […]