

Market Data
February 28, 2014
Key Market Indicators - February 27th 2014
Written by Peter Wright
An explanation of the Key Indicators concept is given at the end of this piece for those readers who are unfamiliar with it.
The total number of indicators considered at present is thirty-six. Please refer to Table 1 for the view of the present situation and the quantitative measure of trends. The present situation of twelve of the indicators based on historical standards was positive on February 27th, an increase of one from last month’s analysis. Demand for commercial and industrial loans, as reported by the Federal Reserve Senior Loan Officer Survey, improved from both large and small firms. Thirteen were negative, which was no change from last month.
This continues to be one of the best results since this analysis was first published in March when seven indicators were positive by historical standards and fourteen were negative. The present situation of the general economy is improving with four indicators positive, three neutral and only consumer confidence being negative. The SMU buyer’s index continues to be positive and the SMU service center excess is neutral. Present situation indicators for long and flat steel products are similar with shipments at both the mill and service levels being low by historical standards. The only difference between the long and flat sectors is that net imports of long products are historically high and those of flat products are neutral. Five of the negative present situation indicators relate to construction, none of the manufacturing indicators are currently negative though three are neutral.
The quantitative analysis of the value of each indicator over time is shown in the “Trend” column. At present twenty-six indicators are trending positive, a net increase of two since this report was last published at the end of January. Trends in the general economy are improving with both bank lending standards and loan demand changing from a negative to a positive trend in the most recent analysis. Trends on the SMU steel buyer’s sentiment index are unchanged. In the long product steel sector, both mill shipments and the price of Chicago shredded reversed course and began to trend negative. We define a falling scrap price as a negative trend. Other trends maintained their direction for long products, including service center shipments which are trending down year-over-year. In the flat rolled sector two indicators trended negative in the last month and four positive. This was an improvement of one on the positive side as mill shipments reversed direction and improved year-over-year. Service center shipments of flat rolled are also trending positive. All the construction indicators are trending positive which was a net change of one since last month as the producer price of commodities reversed direction. We regard the PPI of commodities to be a reliable indicator of industrial construction. All the manufacturing indicators are improving except the ISM Index which on a 3MMA basis fell by 1.7 points to 54.95 but is still a very satisfactory level.
The key indicators analysis confirms our experience that the current market is not great but tells us that most trends which are quantified are moving in the right direction. The trends specific to the steel market are being positively driven by both manufacturing and construction, though the latter has a long way to go before the present situation can be considered to have recovered. SMU has several benchmark analyses that show steel demand to be below the historical norm for this stage of a recovery. This is because the recession in non residential and housing construction was so extreme that it will be years before the 2007 levels are regained. In addition government funded infrastructure work is still depressed.
We believe a continued examination of both the present situation and direction will be a valuable tool for corporate business planning.
(Click the table below for a larger view)
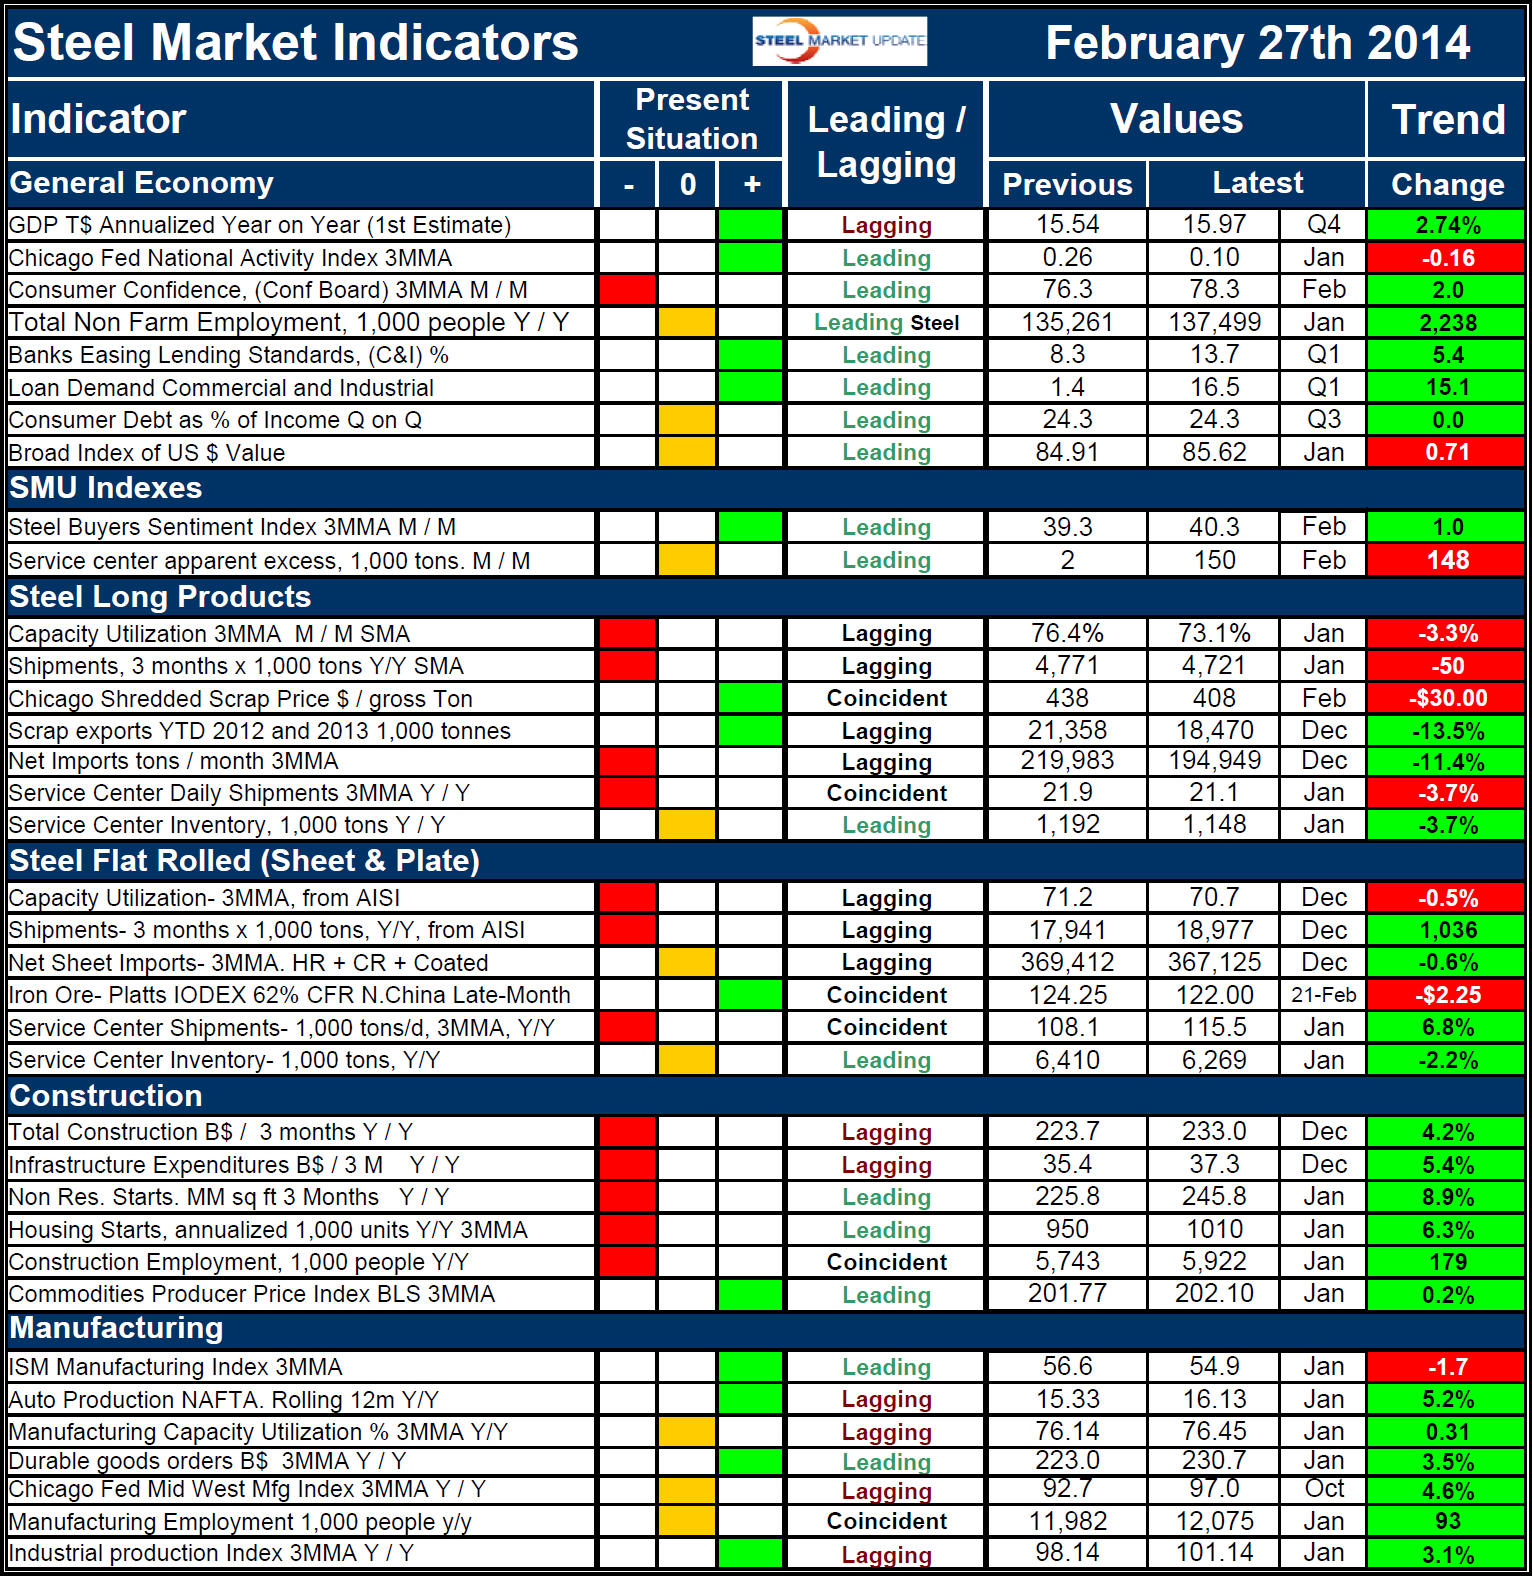
Explanation: The key indicators chart is designed to give a snapshot of the steel market on a specific date. The chart is stacked vertically to separate the primary indicators of the general economy, of proprietary Steel Market Update indices, of both flat rolled and long product market indicators and finally of construction and manufacturing indicators. The indicators are classified as leading, coincident or lagging as indicated.
Columns in the chart are designed to differentiate between the current situation and the direction in which the market is headed. The present situation is sub-divided into, below the historical norm (-), (OK), and above the historical norm (+). The “Values” section of the chart is a quantitative definition of the market’s direction. In cases where seasonality is an issue, the evaluation of market direction is made on a three month moving average basis and compared year-over-year to eliminate this effect. Where seasonality is not an issue concurrent periods are compared. The date of the latest data is identified in the third values column. Values will always be current as of the date of publication. Finally the far right column quantifies the trend as a percentage or numerical change with color code classification to indicate positive or negative direction.


